|
The implications of the Uruguay Round Agreement on Agriculture for developing countries |
||||
|
|
||||
|
|
||||
|
Chapter 4: The impact of the Agreement on agricultural trade |
||||
|
What this chapter is about
The successful conclusion of the Uruguay Round and the creation of the WTO has provided an impetus towards greater liberalisation and integration in the world economy. More specifically in the agricultural sector substantial steps have been made towards liberalisation. This Chapter examines the implications of this for developing countries in their capacity as both exporters and importers.
In Part I we saw that the Uruguay Round heralded a process of gradual liberalisation in global agricultural trade. This chapter begins by examining the extent to which the commitments have been fulfilled and the extent to which it has achieved agricultural liberalisation in the short to medium term. Many commentators argue that the most significant liberalisation measures will come from future negotiating rounds. We detail the likely impacts by examining the positive and negative affects for international trade with specific reference to the outlook for commodities of particular interest to developing countries.
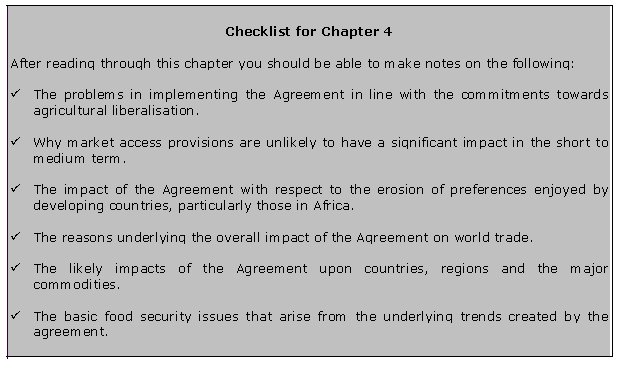
Aims of this chapter
What you will learn
The Punta Del Este Ministerial Declaration stated that there was :
In this section we will examine the extent to which this might be achieved through the Agreement on Agriculture.
The share of developing countries in world agricultural trade is relatively small (25% of world exports in 1992), but of more importance is their growing share of world imports of agricultural commodities. The commitments undertaken in the Agreement are likely to have a significant impact on this trend, with the most significant impact resulting from the commitments undertaken by developed countries with regard to export subsidy reductions. If implemented in accordance with the letter and spirit of the agreement, the commitments in each of the following three areas should in principle contribute to an expansion of market opportunities at the global level.
4.1.1 Market access: Tariffication, tariff cuts and bindings
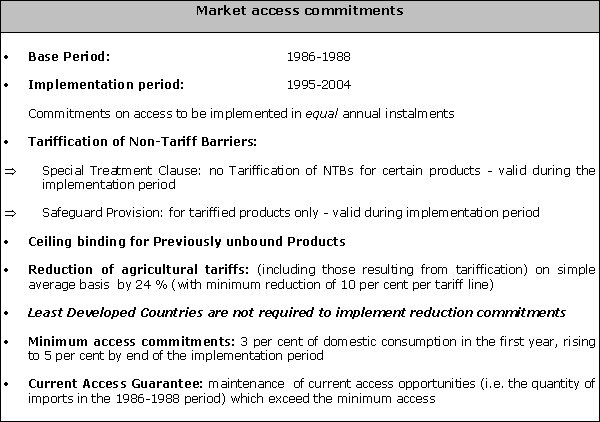
The Box above provides a quick review of the commitments undertaken with respect to market access, detailed in chapters 2 and 3, with the focus on the commitments required from developing countries.
The commitments undertaken with respect to market access by developing countries highlight three elements which warrant particular attention.
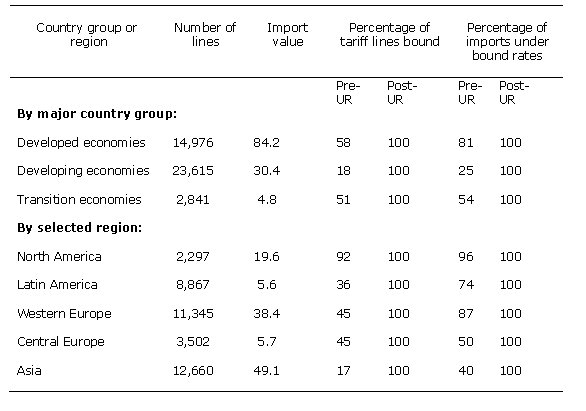
Table 4.1 Pre- and post-Uruguay Round scope of bindings for agricultural products (Number of lines, billions of US dollars and percentages)
Table 4.2: Tariff reductions on agricultural products (% reductions, unweighted reductions)
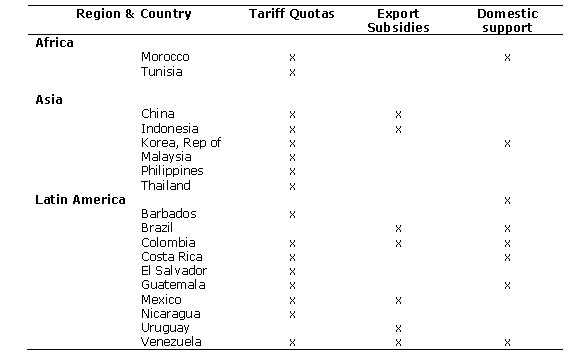
Table 4.3 Developing countries with commitments in respect of access quotas and export subsidy and domestic support reductions
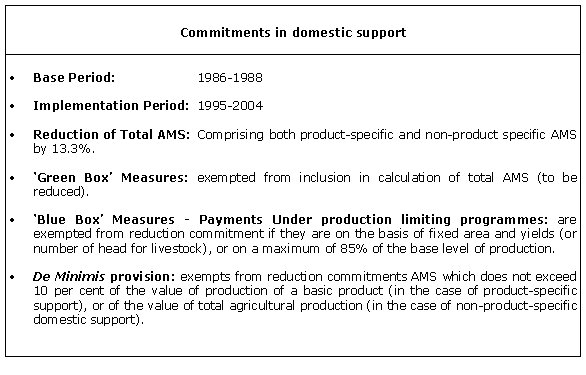
4.1.2 Domestic support reductions
The commitments for domestic support reduction have been detailed in Part I of this manual. The stipulation that it is the aggregate AMS which must be reduced means that there are no commitments to reduce support for individual commodities. This removes from the agenda the politically contentious areas of internal support such as rice in Japan, sugar in the EU and US, and dairy products in most of the OECD countries.
The impact of these reductions in the AMS are more likely to be felt in the longer term following the implementation period
Reductions in support to agricultural producers in both OECD and developing countries are highlighted in Table 4.4.
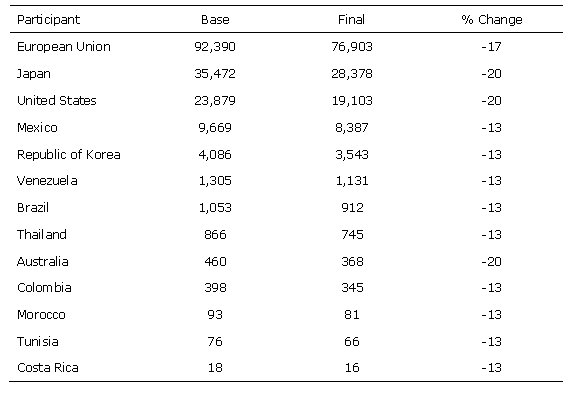
Table 4.4 Reductions in Domestic Support to Agricultural Producers
The countries that have applied non-exempt forms of domestic support were listed in Table 4.3 and highlighted in Table 4.6 above. The developed countries included in the Table are those of export interest to developing countries. The reduction commitment (13.3%) applies to a base period total level of support to agricultural producers e.g. Mexico $9.7 billion and Venezuela $1.3 billion. Thus, by the end of the implementation period the levels of support in these countries will be reduced to $8.4 billion and $1.1 billion respectively.
As in the case of market access there is debate over the extent to which the commitments undertaken represent real reductions. As we have seen the calculation of the base AMS, to which the cuts apply, is based on levels of support between 1986-88, a period characterised by relatively low world market prices for agricultural goods and hence high levels of support to farmers.
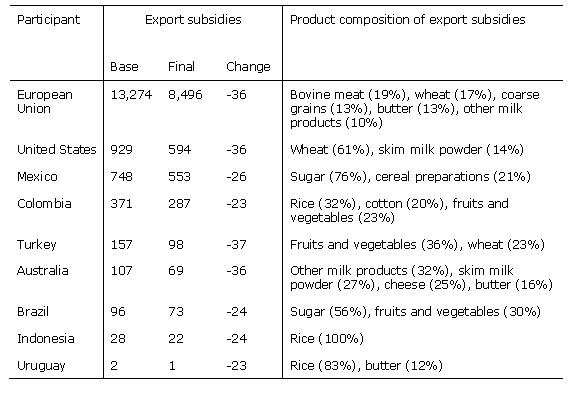
Table 4.3 indicated the developing countries with export subsidies that are subject to reduction commitments. The products most affected by the export subsidies across developing regions include sugar, rice and vegetables. However, with the exception of Mexico and Colombia, export subsidies amongst developing countries are low or not maintained.
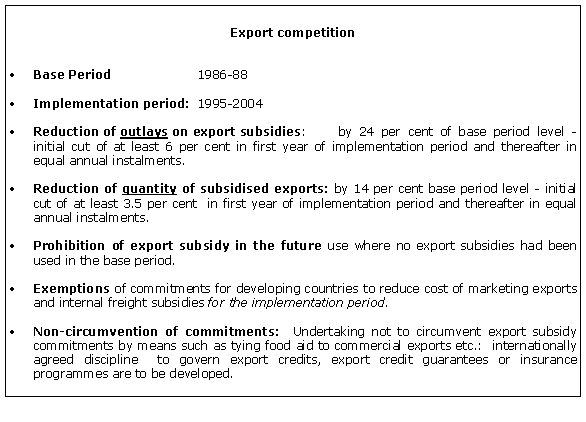
The extent of export subsidy reduction commitments is shown in Table 4.5 while Table 4.6 shows country specific commitments.
During the implementation period the value and quantity of direct export subsidies will be reduced by 36%. This represents a fall from $22.5 billion to $14.5 billion, half of which will be accounted for by the EU. These reductions will have a positive impact for developing exporting countries in traditionally heavily subsidised markets: wheat, beef, coarse grains, dairy products and sugar.
The reduction in the use of export subsidies, although presenting some potential difficulties for net food importing developing countries, should prove beneficial for developing country exporters.
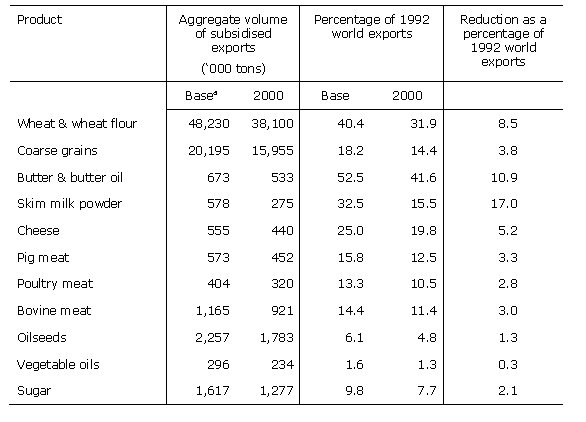
Table 4.5: Export subsidies: Aggregate quantities and reduction commitments of OECD countries for selected commodities
Table 4.6 Export subsidy reduction commitments by country (Millions of US$)
The gains through the reduction in export subsidies are significant but should be tempered with the knowledge that at current levels subsidised exports will still account for a third or more of the trade in beef, wheat and vegetable oils, while a fifth of poultry and course grains can still be subsidised. There will still be considerable distortions despite the achievements made by the Agreement.
4.2 The loss of preferential trading agreements
4.2.1 The general impact
The commitments made towards the greater liberalisation of world trade and the trade in agricultural products will clearly have an impact on developing countries with regard to the level of preferences they will enjoy.
The rationale behind the granting of preferences was the recognition that developing countries needed concessions to be able to compete, even in traditional markets, with more technologically advanced and competitive suppliers.
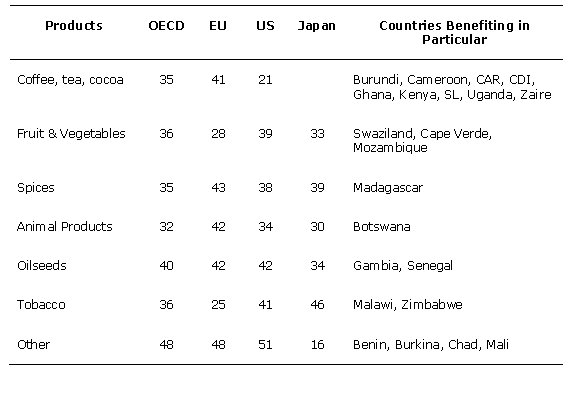
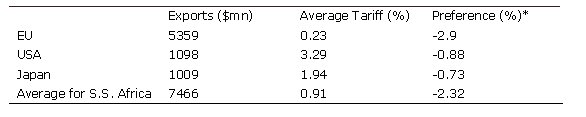
African countries have been the main beneficiaries of preferential arrangements. Table 4.7 shows the level of tariff concessions for a group of sub-Saharan countries which are particularly reliant on provisions. The potential value of preferences given by the EU, Japan and the United States in the agricultural sector in 1992 were estimated at US$1.9 billion, with one third going to developing countries in Africa, 40% to Latin America and the Caribbean, and the rest primarily to the Far East and Oceania. The reduction in MFN rates after the UR will lead to a fall in value of preferences by US$0.8 billion: 0.2 billion in Africa, 0.3 billion in Latin America and the Caribbean. (FAO 1995)
Table 4.7 Tariffs faced by least developed Sub-Saharan African countries
Table 4.8 indicates how small the level of preferences are now. In many cases, we can observe that the MFN rate is below the GSP. In some cases it has fallen to zero. The focus of the negotiating rounds is the reduction of MFN tariff rates. MFN tariff rates are now low and will become lower at the end of the implementation period of the Agreement: tariffs were 6% on average at the beginning of the Round and will be 4% at the end across all sectors.
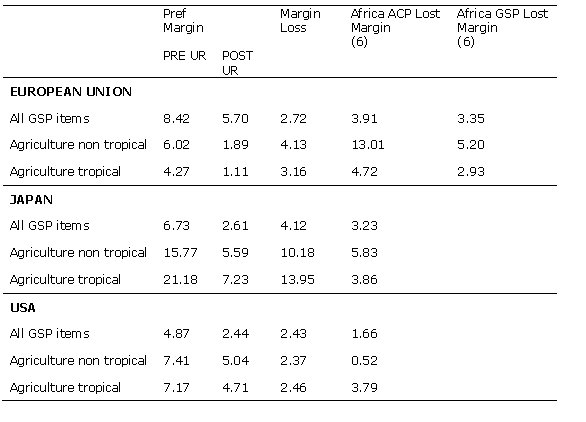
Table 4.8 Erosion of GSP
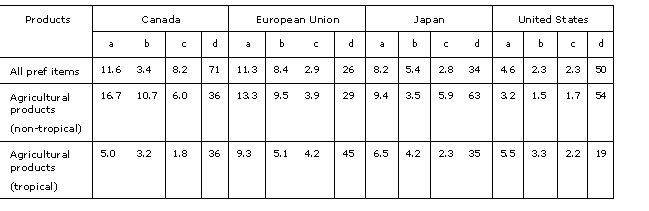
The impact of the loss of preferential margins is likely to be felt most by the least developed countries. 48 countries are identified as least developed of which 39 are in receipt of ACP preferences from the EU. Table 4.9 reflects the particular situation faced by the Least Developed Countries in the Quad markets, i.e. those of EU, USA, Japan and Canada. The table takes into account, on a tariff line basis, the most favourable treatment applicable to LDCs in agricultural markets. It is estimated that the erosion in preferences is most significant in the case of tropical products imported by the EU, where the loss of preferential margins for non-tropical and tropical agricultural products are 29% and 45% respectively. The loss in non-tropical products in the Japanese market is as high as 63%.
Table 4.9 Average erosion of preferential margins for imports from the Least Developed Countries in Quad markets (percentages)
It is the extent of trade creation which is subject to most debate. In the next section we draw on one source of data estimating the impact of the Agreement in this respect. Commentators are divided on the issue but there has been substantial concern expressed regarding the implications for food security. This issue will be considered later.
4.3 The impact of the Agreement on Agricultural Trade Liberalisation
4.3.1 Overview of the agricultural trading environment after the UR
A range of quantitative studies have been undertaken analysing the implications of the Agreement for international trade. The models have used different assumptions, but have in general overestimated the extent of liberalisation in this respect, and thus overestimated the impact on the net food importers. In this section we will examine the impact of the Agreement on the trade balances of developing countries in general, and on key food commodities of significance for developing countries.
Our discussion on the implementation of the market access commitment emphasised that it is unlikely to result in any significant gains for developing countries. In fact, the overall impact of the Agreement is barely significant. Developing countries as a group are net-food importers: higher world prices will lead to a higher import bill, but higher by $240 million from a total import bill of $18 billion. There will be gains for a few exporting countries in Latin America and for Thailand, as a result of these higher prices, but these will also bring difficulties in import finance for many countries, especially in sub-Saharan Africa. This issue is discussed below, and the numbers warrant special attention.
In this section we will draw heavily from the recently published FAO projection to the year 2000. There have been a number of quantitative studies regarding the impact of the Agreement, and the FAO projections represent the most recent.
The FAO model accounted for 59% of the agricultural commodities traded excluding cotton and horticultural products. It takes into account the Uruguay Round changes as well as changes in national policies, and estimates the impact up to the year 2000. The commodities studied include wheat, rice, coarse Grains, oils and fats and oilmeals, sugar, meat, milk and milk products, coffee, cocoa, tea, bananas, hides and skins.
4.3.2 The general impact
The general findings of the FAO study estimated that
4.3.3 The regional impact
Africa
In general, African countries tend to be importers of food, particularly wheat, rice and dairy products. The region consists of over 50 countries of which 28 are classified as least developed and 43 are low income food deficit countries.
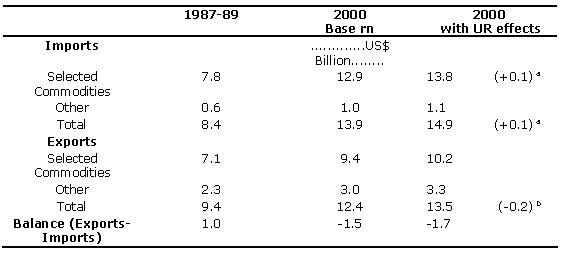
Based upon the FAO projections Table 4.10 highlights the impact of the Agreement on commodity imports and exports.
Table 4.10 Developing countries in Africa: Projected agricultural trade balances to the year 2000
Latin America and the Caribbean
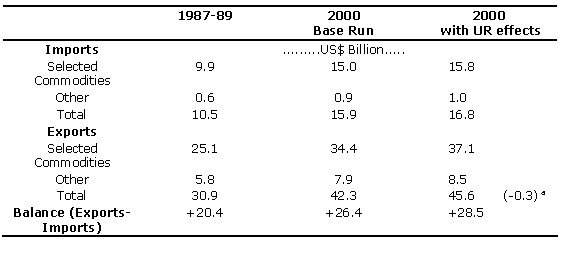
The region as a whole prior to the UR was a net importer of cereals although several countries in the region are net exporters, e.g. Argentina and Uruguay. One country in the region is classified as least developed and 9 are low income food-deficit countries.
Table 4.11 highlights the trade gains and losses for developing countries in Latin America with, and without, the Agreement.
Table 4.11 Latin American and Caribbean developing countries: Projected agricultural trade balances to the year 2000
The Far East
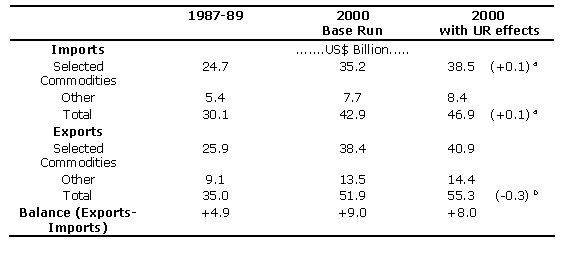
The Developing Countries in the Far East are overall net exporters of rice, fats and oils and tropical products, and net importers of other cereal and milk products. Import increases are forecast to be significant for feed commodities as a consequence of a thriving livestock sector where output is expected to grow by 5% per annum to the year 2000. The projected trade balance is highlighted in table 4.15.
Table 4.12 Developing countries in the Far East: Projected agricultural trade balances to the year 2000
The Near East
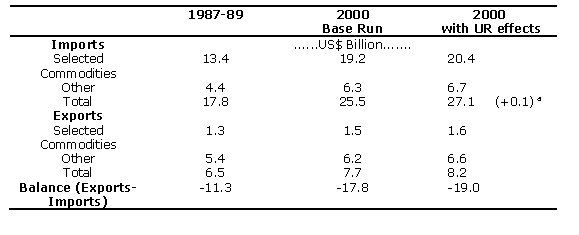
The Far East is predominately a net importer of agricultural products. Only two countries in the region are classified as Least Developed and only a minority of the countries of the region are members of the WTO. Thus, their agricultural policies will not be subject to the commitments of the agreement, but nevertheless they will be affected by them. The region earns little from agricultural products and the bulk of these were outside the commodities analysed. Table 4.13 details the gains and losses and the trade gap is forecast to widen from US$11 to US$19 billion by the year 2000.
Table 4.13 Near East developing countries: Projected agricultural trade balances to the year 2000
4.3.4 The impact on agricultural commodities
The impact of the Agreement is primarily likely to affect international trade in temperate products. These form the main focus of the Agreement, and it is likely that there will be a reduction in world output of these commodities as production in some major developed countries falls.
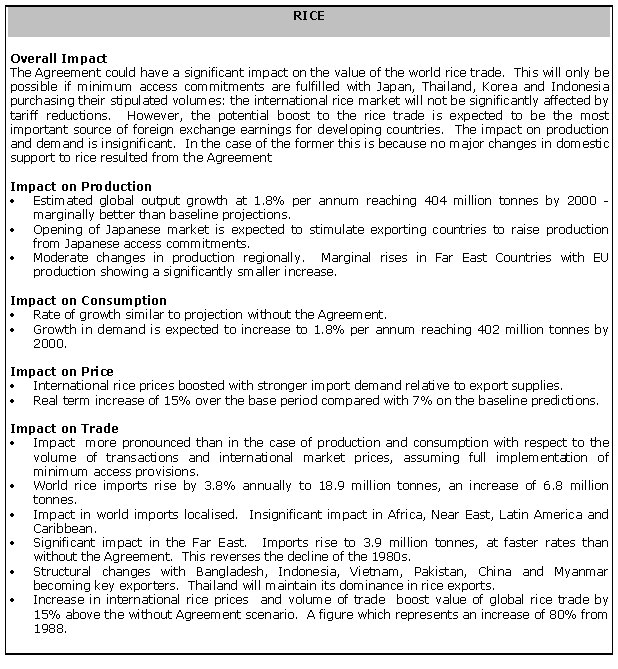
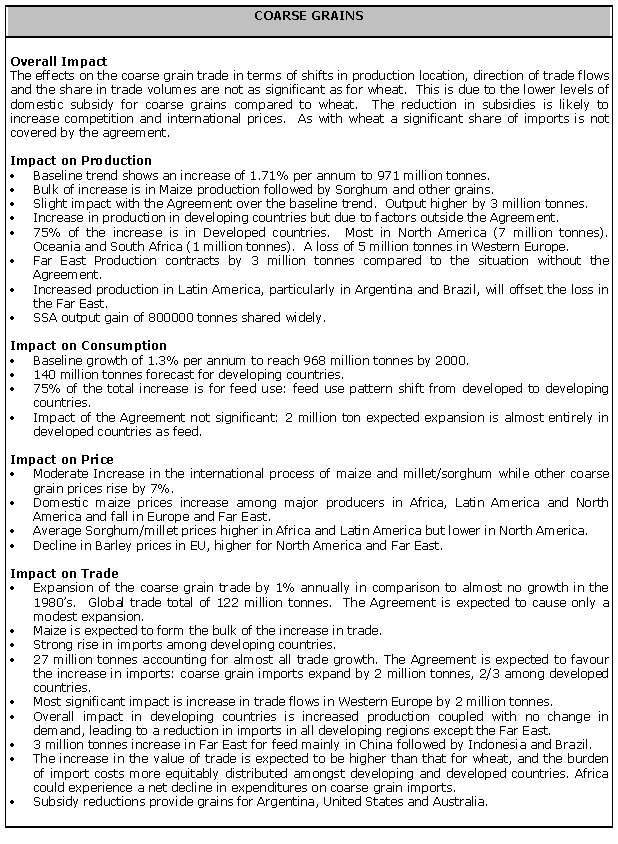
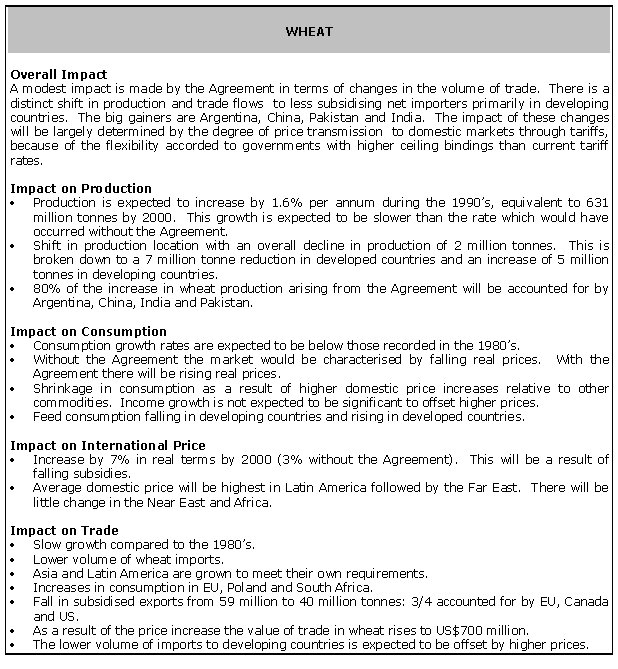
In this section we detail the effects on the world prices and trade in specific agricultural commodities. The implications are likely to be strongest in those products where protection among OECD countries was substantial, namely cereals (in particular, wheat, rice and coarse grains), meat, dairy products and sugar.
It is expected that the effects of the Agreement will:
4.4 The impact on food security The preceding section highlighted that the losers from the Agreement are likely to be the Net Food Importing Countries. This adverse impact was expected to be a short to medium term phenomenon. Developing countries will be affected both as importers and exporters. The impact on the latter was discussed briefly with respect to the erosion of preferential access agreements.
A rise in international prices for major food items such as cereals, dairy products, meats, edible oils and sugar is likely.
In light of the likely negative effects of the changes in the external agricultural trading system, there was a special arrangement in the Final Act to provide some amelioration. The Decision on Measures Concerning the Possible Negative Effects of the Reform Programme on least-Developed and Net Food Importing Countries attempts to deal with the issues relating to food security that arise from the Agreement. As implied, the decision was taken to offset higher world food prices caused by agricultural trade liberalisation, a factor reinforced by the fact that export subsidy reductions will , in some cases, raise the effective price paid by importers. We will examine the details and implementation issues that arise from the Decision in Chapter 7 when we examine the implications for national policy response to deal with food security after the Agreement.
|
||||