Rolando Quirós
Facultad de Agronomía, Universidad de Buenos Aires
Av. San Martin 4453, CF 1045, Buenos Aires, Argentina
ABSTRACT
This paper presents an overview of fish stocking in Latin America (LA) and an evaluation of stocking success for reservoirs situated in tropical LA. In the region, fish stocking has often been recommended as a magic management measure to find solutions to almost every problem we have in freshwater fisheries from low fish production and overexplotation, to habitat degradation. Reservoir fisheries are usually exploited on a trial-and-error basis and assessments of stocking effectiveness are rarely conducted. The main purpose of this study is to evaluate stocking effectiveness for tropical Latin American reservoirs using the relationships between fish yield and predictors like stocking rate, mean fish weight at stocking, and grade of intensification, derived from a number of reservoirs. The studied data base comprises 172 reservoirs and small water bodies throughout tropical LA. Heavy stockings resulted in higher fish yields, but stocking was only a necessary, and non-sufficient, condition to attain a successful enhancement outcome. When the objective is to manage for maximum biomass, stocking rates should be adjusted according to inputs of fertilisers and feed, as was exemplified by some Cuban semi-intensively managed small reservoirs and northeastern Brazil ponds and very small reservoirs. On the other hand, supplemental stocking programmes for self-sustained fish populations in Latin American reservoirs will need to be studied and analysed on a case-by-case basis. Stocking should be adapted to the presence of self-sustained fish populations and should be assessed for each individual reservoir. Some technical mismanagement measures might be easily corrected. Where social and economic considerations are required a preliminary programme assessment is highly appropriate.
1. INTRODUCTION
Latin America comprises a range of climatic zones from cold-temperate in the south to both the south and the north tropical zones. Climatic conditions are modified by altitude in a west-east direction due to the peculiar north-south distribution of the Andes Mountains.
Most of the countries in the region have been using fish stocking to manage their freshwater fisheries since early in the century. For the southern sub-region (Argentina, Chile, and Uruguay), stocking has been used mainly to introduce salmonids for recreational fisheries in the Andes' rivers, lakes and reservoirs, and to introduce the Argentinean silverside (Odontesthes bonariensis). This fish is native to very shallow lakes of the pampas, in central and northern Argentina and Chile, Uruguay, Bolivia, Paraguay, southern Brazil, and Peru, where it is captured by both commercial and recreational fishermen. Supplemental stocking of both salmonids and silversides for self-sustained populations is a common practice in those countries. Common carp (Cyprinus carpio) was also introduced to this sub-region. In Argentina, private funding of stocking for recreational fisheries has shifted from the public to the private sector during the last few years.
For the most geographically heterogeneous northern sub-region (countries from Mexico south to Bolivia and Paraguay), stocking for biomass production is a common practice in the management of reservoirs and other large water bodies. Tilapias (Oreochromis aureus, Oreochromis niloticus, and Tilapia rendalli) have been introduced and stocked in reservoirs located from Mexico and Cuba to southern Brazil and Paraguay, and Chinese carps are introduced and maintained in reservoirs throughout tropical and subtropical Latin America. Other fish species native to large South American river basins (Colossoma macropomun, Piaractus mesopotamicus, several species of the genera Plagioscion and Prochilodus, among other native fish species) have been introduced and maintained or stocked in reservoirs situated in northeastern and southeastern Brazil, Colombia, and Venezuela. Rainbow trout (Oncorhynchus mykiss) introductory and supplemental or maintenance stocking is also a common practice in high altitude lakes of Andean countries. Supplemental stocking with native and introduced fish species is a usual practice to manage large water bodies and medium-sized and small reservoirs in Mexico. For this sub-region the public sector has usually been funding stocking in reservoirs.
Supplemental stocking is usually indicated when low production levels and low yields of favoured fish species are seen to be due to insufficient recruitment to the fishable population. In the region as a whole, most countries stock reservoirs for both recreational (managed for fish size) and commercial (usually managed for biomass) fisheries. Stocking rate alone may be a poor indicator of survival of stocked material or of its contribution to the catch (Welcomme, 1995), and numbers or weight of fish stocked are inadequate measures of management success. In Latin America and the Caribbean reservoir fisheries have been usually exploited on a trial-and-error basis (Quiros, 1995) and, in many areas of the region, reservoirs have been stocked for many years but an assessment of stocking effectiveness was never conducted. Cuban reservoirs do constitute an exception (Fonticiella et al., 1995). It is our intention here to show that the relationship between stocking density and fish yield might be a good indicator of stocking success when managing for a maximum biomass. Therefore, our goals here are to test the hypothesis that fish yields for homogeneous climatic regions are directly related to fish stocking densities and to show how the intensity of inputs influences the shape of the general relationship.
2. OBJECTIVES
The main purpose of this study is to evaluate stocking effectiveness for tropical Latin America reservoirs using the relationships between fish yield and predictors like stocking rate, mean fish weight at stocking, and grade of intensification, through the comparison among reservoirs. Secondary objectives are:
3. METHODS
To explore fish stocking impact on fish yield two data bases were constructed, each one depending on information on total stocking rate and stocking rate by species, respectively. The first group (SET#1, n=172) included large and medium-sized reservoirs in Mexico (Olmos et al., 1992) and Cuba (Fonticiella et al., 1995; Remedios and Cabezas, 1995), small and very small reservoirs in Cuba (Fonticiella et al., 1995; Remedios and Cabezas, 1995), and very small reservoirs and ponds situated in NE Brazil, SE Brazil, and throughout tropical Latin America (Quiros files) (Table 1). All water bodies are used for culture-based fisheries or aquaculture. Fish species and altitude effects were not analysed for SET#1. However, both native and introduced species were included.
Table 1. Fisheries and stocking characteristics for SET#1 and SET#@ datasets.
| Variable | SET#1 | SET#2 |
|---|---|---|
| Surface area | 2256 (0.016 – 96000) | 770 (5 – 7945) |
| Fish yield | 2837 (12 – 15000) | 372 (19 – 2032) |
| Latitude | 16 (5 – 28) | |
| Fishing effort density | 5.4 (0.7 – 43.2) | |
| Stocking density (SDN, fish/ha/yr) | 6747 (2 – 89200) | 1825 (36 – 11814) |
| Stocking density (SWD, kg/ha/yr) | 99 (0.02 – 930) | 11.8 (0.5 – 96) |
| Mean weight at stocking (W, g) | 15.0 (2.2 – 76.3) | |
| Tilapia stocking (SDWTi, kg/ha/yr) | 4.5 (0 – 32.3) | |
| Carp stocking (SDWCi, kg/ha/yr) | 7.3 (0 – 91.8) |
The second group (SET#2, n=86) consisted of Cuban reservoirs (Table 1). For extensively used reservoirs (n=57), the data used for inter-reservoir comparisons were derived from actual yields (year y) and stocking densities lagged three years before the year of capture (year y-3). For this time-lag, relations between yields and stocking rates (year y-3) show the best correlation. For semi-intensive reservoirs (n=29) most fish were captured one year after stocking (year y-1) (Remedios and Cabezas, 1995; Fonticiella et al., 1995). Therefore, for this type of reservoir, relationships were derived from captures in year y and stocking densities in year y-1. The ratio of biomass of cyprinids to total fish biomass, both at stocking and at landing, was used to study effects of cyprinid stocking on total yield.
Data were analysed by linear correlation, partial correlation, simple and multiple regression on the total data and on several data subsets (Weisberg, 1980). Stepwise multiple regression analysis was applied to the data using variables related to climate, morphometry, fisheries and stocking. Curvilinear trends in data and in simple regression residuals were studied using robust locally weighted regression and smoothing graphic techniques (Cleveland, 1979). The Number Cruncher Statistical System (NCSS, Hintze, 1988) was used. Time series relations between yields and stockings for individual reservoirs were studied using lag-correlation techniques (Davis, 1986). In order to take account of the intensity of use for fish production of each aquatic environment, a dummy variable denominated grade of intensification (#grade), was defined as 1 and 2 for extensively (no fertilisation or feeding) and semi-intensively (just fertilization) used reservoirs, respectively, and as 3 for intensive culture (fertilisation and feeding). Original information given by the authors was used to adjudicate #grade value. In order to stabilise the variance, all the variables except latitude, #grade, and fish biomass ratios were log-transformed. The latter, as proportions, were transformed to their arc-sine (Draper and Smith, 1981).
4. RESULTS
4.1 Total stocking effectiveness in tropical Latin America reservoirs
For Latin America reservoirs (SET#1), total fish yield was highly and positively correlated with stocking density, grade of intensification, and mean weight of fish at stocking. On the other hand, fish yield was highly and inversely related to surface area (Fig. 1) and latitude (Table 2). The direct relationships between fish yield and stocking density or grade of intensification were also significant when surface area or latitude was held constant in partial correlation analyses (Table 3). However, the inverse relationship between fish yield and reservoir area or latitude was no longer significant when stocking density or grade of intensification was held constant (Table 4).
Figure 1. Relationship between fish yield (Y, kg/ha/year) and surface area (A, km2)
for 129 water bodies in tropical Latin America. (□), extensively used
Mexican and Cuban reservoirs; (■), semi-intensively used Cuban
reservoirs;  , intensively used water bodies.
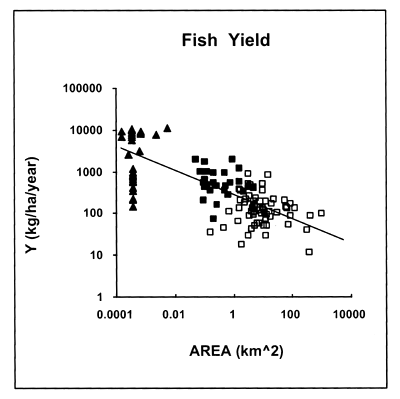
These results indicate that reservoir area or latitude are not the best statistical variables to explain total fish yield variability in tropical Latin America reservoirs managed for culture-based fisheries. Moreover, regression models including fish stocking density and grade of intensification as independent variables will explain total fish yield variability better for this type of fisheries.
Table 2. Correlation matrix for total data (SET#1).
| A | SDN | SDW | W | Latitude | #GRADE | |
|---|---|---|---|---|---|---|
| Y | -0.74 | 0.78 | 0.83 | 0.68 | -0.62 | 0.82 |
| (n = 129) | (n = 172) | (n = 144) | (n = 144) | (n = 172) | (n = 172) | |
| SDN | -0.84 | 1 | 0.96 | 0.42 | -0.56 | 0.79 |
| (n = 129) | (n = 144) | (n = 144) | (n = 172) | (n = 172) | ||
| SDW | -0.86 | 0.96 | 1 | 0.63 | -0.77 | 0.85 |
| (n = 120) | (n = 144) | (n = 144) | (n = 144) | (n = 144) | ||
| Latitude | 0.79 | -0.56 | -0.77 | -0.69 | 1 | -0.74 |
| (n = 129) | (n = 172) | (n = 144) | (n = 144) | (n = 172) |
Table 3. Partial correlation matrix for total data (SET#1). Reservoir surface area constant (A = constant).
| SDN | SDW | W | Latitude | #GRADE | |
|---|---|---|---|---|---|
| Y | 0.44 | 0.57 | 0.63 | -0.09 | 0.52 |
| (n = 172) | (n = 144) | (n = 144) | (n = 172) | (n = 172) | |
| SDN | 1 | 0.86 | 0.17 | 0.29 | 0.01 |
| (n = 144) | (n = 144) | (n = 172) | (n = 172) | ||
| SDW | 0.86 | 1 | 0.61 | -0.29 | 0.27 |
| (n = 144) | (n = 144) | (n = 144) | (n = 144) | ||
| Latitude | 0.29 | -0.29 | -0.67 | 1 | -0.04 |
| (n = 172) | (n = 144) | (n = 144) | (n = 172) |
Table 4. Partial correlation matrix for total data (SET#1). Stocking density in weight constant (SDW = constant).
| A | SDN | W | Latitude | #GRADE | |
|---|---|---|---|---|---|
| Y | -0.11 | -0.12 | 0.37 | 0.04 | 0.38 |
| (n = 129) | (n = 172) | (n = 144) | (n = 172) | (n = 172) | |
| SDN | -0.13 | 1 | -0.85 | 0.96 | 0.19 |
| (n = 129) | (n = 144) | (n = 172) | (n = 172) | ||
| Latitude | 0.39 | 0.96 | -0.42 | 1 | -0.27 |
| (n = 129) | (n = 172) | (n = 144) | (n = 172) |
Results from partial correlation analyses are reflected in regression models. Reservoirs that have been stocked more intensively showed the highest fish yields (Tables 2 and 5), but the LOWESS analyses show that fish yield varies non-linearly with stocking density (Figs. 2 and 3). Moreover, the most significant changes in slope are concurrent to the changes in the grade of intensification.
Non-linear relation between fish yield and stocking rate was better displayed when residuals to stocking density - fish yield regressions had been plotted against stocking density (Figs. 4 and 5). Mexican reservoirs and large and some medium-sized Cuban reservoirs deviate positively at the lower stocking densities. At intermediate stocking rates, reservoirs deviate both sides from the log-log linear regression equation, although most reservoirs deviate negatively from the regression line. This group encompasses most of medium-sized and small Cuban reservoirs and one fourth of other ponds and very small reservoirs throughout tropical LA. Mean value for 31 public reservoirs in northeastern Brazil also lies within this subgroup, slightly above the zero residual value (Quiros, 1994). Furthermore, at high stocking densities most ponds and small reservoirs have fish yields higher than predicted from the linear regression model. At the highest levels of fish stocking density, fish yield appears to reach a mean maximum at 14,000 – 15,000 kg/ha/year for stagnant water bodies (high water residence time) (Figs. 3 and 5).
Table 5. Some linear regression models for the relationship between the fish yield (Y, kg/ha/year) and stocking density in weight (SDW, kg/ha/year and in numbers (fish/ha/year).
| Set | N | Equation | R2 | P |
|---|---|---|---|---|
| SET#1 | 172 | loge Y = 1.262 (0.340) + 0.711 (0.043) loge SDN | 0.611 | <0.000 |
| Extensive (1) | 7 | loge Y = 3.032 (0.612) + 0.536 (0.231) loge SDN | 0.519 | =0.068 |
| Extensive (2) | 63 | loge Y = 5.309 (0.661) - 0.041 (0.107) loge SDN | 0.002 | =0.706 |
| Semi-intensive (3) | 23 | loge Y = -1.154 (1.608) + 0.910 (0.195) loge SDN | 0.509 | <0.000 |
| Intensive (4) | 79 | loge Y = 0.316 (0.869) + 0.870 (0.096) loge SDN | 0.519 | <0.000 |
| SET#1 | 144 | loge Y = 4.464 (0.128) + 0.636 (0.036) loge SDW | 0.691 | <0.000 |
| Extensive (1) | 7 | loge Y = 5.500 (0.580) + 0.536 (0.231) loge SDW | 0.520 | =0.064 |
| Extensive (2) | 63 | loge Y = 5.015 (0.212) + 0.034 (0.125) loge SDW | 0.001 | =0.784 |
| Semi-intensive (3) | 23 | loge Y = 4.725 (0.537) + 0.675 (0.172) loge SDW | 0.424 | =0.001 |
| Intensive (4) | 51 | loge Y = 1.972 (0.392) + 1.158 (0.074) loge SDW | 0.833 | <0.000 |
(1) = Large Mexican water bodies;
(2) = Large and medium-sized Cuban reservoirs;
(3) = Small and very small Cuban reservoirs;
(4) = Ponds and very small reservoirs throughout tropical Latin America.
Figure 2. Relationship between fish yield (Y, kg/ha/year) and fish stocking density in
numbers (SDN, fish/ha/year) for 172 water bodies in tropical Latin
America. (□), extensively used Mexican and Cuban reservoirs; (■), semi-intensively
used Cuban reservoirs;  , intensively used water bodies.
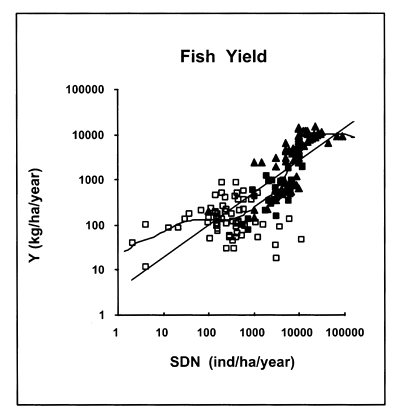
Figure 3. Relationship between fish yield (Y, kg/ha/year) and fish stocking density in
weight (SDW, kg/ha/year) for 144 water bodies in tropical Latin America.
(□), extensively used Mexican and Cuban reservoirs; (■), semi-intensively
used Cuban reservoirs;  , intensively used water bodies.
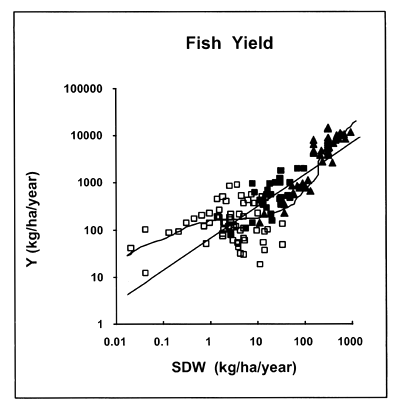
Figure 4. Relationship between residuals to stocking density in numbers (SDN) - fish
yield (Y) and stocking density in numbers (SDN) for 173 water bodies in
tropical Latin America. (□), extensively used Mexican and Cuban
reservoirs; (■), semi-intensively used Cuban reservoirs;  , intensively
used water bodies.
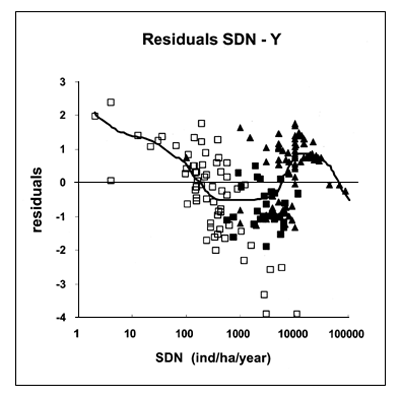
Figure 5. Relationship between residuals to stocking density in weight (SDW) - fish
yield (Y) and stocking density in weight (SDW) for 144 water bodies in
tropical Latin America. (□), extensively used Mexican and Cuban
reservoirs; (■), semi-intensively used Cuban reservoirs;  , intensively
used water bodies.
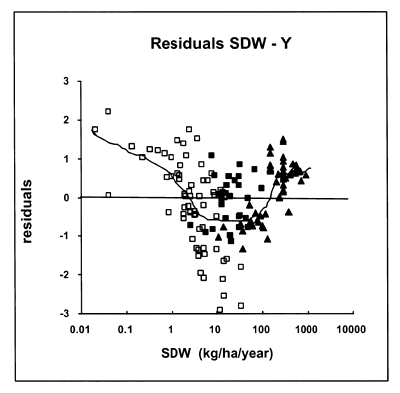
Figure 6. Relationships between fish yield and stocking density in numbers for: ( 1 ), large Mexican reservoirs; ( 2 ), Cuban large, medium-sized and small reservoirs; ( 3 ), Cuban very small reservoirs; ( 4 ), other ponds and very small reservoirs throughout tropical Latin America.
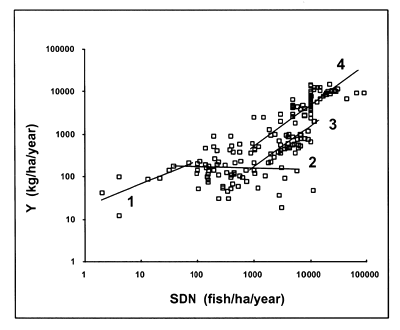
Fish yield was highly related to stocking in intensively and semi-intensively used reservoirs (Table 5, Fig. 6). Furthermore, for extensively used reservoirs, total fish yield was not significantly related to total fish stocking density (Figs. 2 and 3), although for large Mexican water bodies yield was directly related to stocking (Table 5, Fig. 6).
Mean fish weight at stocking (W) was also an important variable explaining total fish yield variability, in spite of reservoir area or latitude (Tables 2 to 4), after stocking density effects have been accounted for. In multiple regression analyses for the total data set (SET#1), incorporation of weight improved the explained variation in yield (Y) from 69% to 73% and from 55% to 72% (n=144) for stocking density in weight (SDW) and in numbers (SDN), respectively. Moreover, the distribution of residuals has not changed qualitatively (Figs. 4 and 5).
4.2 Stocking effectiveness for self-sustained fish populations and non-reproducing fish species
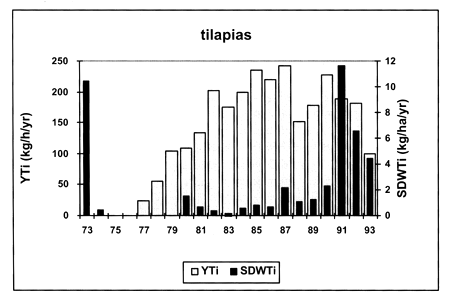
The case of fish species stockings in Cuban reservoirs (SET#2) is analysed as follows. Cuban reservoir stocking programmes began in the early 1970s. Tilapia (Oreochromis aureus) stockings began in 1973 with high annual stocking densities mainly in large reservoirs, and the tilapia fishery has been developed since 1977 for most reservoirs with A > 100 ha (Mari, 1992; Fonticiella et al., 1995). Fish yields and stocking densities for tilapia in 49 reservoirs are shown in Figure 7 for the period 1973–1993. After the initial stocking, stocking densities were held almost constant in spite of the increase in tilapia yields. Stocking strategies for tilapia have changed abruptly since 1990. The increase of tilapia stocking densities in weight and in numbers was noticeable. During the period 1990–1993 hatchery rearing patterns shifted toward producing a bigger number of smaller fish (Diaz Perez, pers. comm.).
Figure 7. Tilapias yield (YTi, kg/ha/year) and stocking density in weight (SDWTi, kg/ha/year) for 49 Cuban reservoirs.
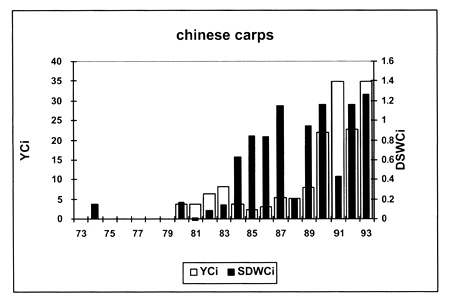
On the other hand, stocking of cyprinids (Hypophthalmichthys molitrix, Hypophthalmichthys nobilis, Cyprinus carpio, Ctenopharyngodon idella) also began in the early 1970s, with a noticeable increase since 1984 (Fig. 8). Stocking of Chinese carps was restricted mainly to small and very small reservoirs, although medium-sized and large reservoirs were also stocked (Fonticiella et al., 1995). High stocking densities were also noted in individual reservoirs for both tilapias and cyprinids for the years 1992 and 1993. Among stocked fish, only tilapias in large, medium-sized, and most of the small reservoirs have natural recruitment to fishable populations. Chinese carps are usually bred in public hatcheries. In the last few years some medium-sized reservoirs that had been used for extensive tilapia fisheries were moved to a semi-intensive cyprinidculture. More details, covering fishing effort and a regional analysis for Cuban reservoirs, are given in Fonticiella et al. (1995).
Figure 8. Chinese carps yield (YCi, kg/ha/year) and stocking density in weight SDWCi, kg/ha/year) for 49 Cuban reservoirs.
4.2.1 Reservoir comparisons
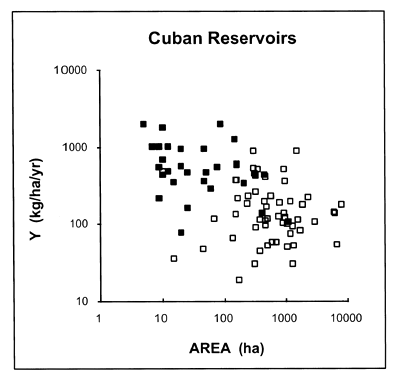
Cuban reservoirs (SET#2, n=86) are a selected subset of total data (SET#1, n=1 72) for which stocking data by groups of fish species were available. General results of correlation analyses were similar to those obtained for total data (Section 4.1) ( Table 6, Fig.9). However, total fish yield was just slightly related to total fish stocking density for total Cuban reservoirs (Table 7, Fig.10). Total fish yield and total stocking density were highly related for semi-intensively used reservoirs (#grade = 2) and these variables were not at all related for extensively used reservoirs (#grade = 1) (Table 7, Fig.10). As expected, total fish yields and fishing effort densities were highly related for the total of Cuban reservoirs and for both extensively and semi-intensively used reservoirs (Tables 6 and 7, Fig. 11). Similar results for fishing effort/density-fish yield relationships have been obtained before for large Mexican water bodies, extensively used Cuban reservoirs, and public reservoirs located in northeastern Brazil (Quiros, 1994), and for Salvadoran water bodies, small and very small Cuban reservoirs, and large reservoirs situated on large South American rivers (Quiros, 1995).
Total fish yield was related to stocking density of cyprinids for total data and for semi-intensively used reservoirs (Tables 6 and 7, Fig. 12). Cyprinid stockings have been reflected in total yield increases only for semi-intensively used reservoirs. On the contrary, total fish yields and tilapia stockings were not related at all for Cuban reservoirs (Fig. 13).
Table 6. Correlation matrix for Cuban reservoirs (SET#2, n=86).
| A | SDW | SDWTi | SDWCi | Effort | #grade | |
|---|---|---|---|---|---|---|
| Y | -0.49 | 0.44 | -0.05 | 0.60 | 0.87 | 0.57 |
| YTi | 0.17 | -0.20 | -0.14 | -0.16 | 0.28 | -0.17 |
| YCi | -0.78 | 0.73 | 0.29 | 0.87 | 0.78 | 0.65 |
| SDW | -0.74 | 1 | 0.54 | 0.83 | 0.63 | 0.66 |
| SDWTi | -0.15 | 0.54 | 1 | 0.12 | 0.17 | 0.15 |
| SDWCi | -0.76 | 0.83 | 0.12 | 1 | 0.76 | 0.73 |
Figure 9. Relationship between fish yield (Y, kg/ha/year) and surface area (A, km2) for 86 Cuban reservoirs. (□), extensively used reservoirs; (■), semi-intensively used reservoirs.
Similarly to total yields, tilapia yields were not significantly related to tilapia stockings for total data and for both extensively and semi-intensively used reservoirs (Tables 6 and 7, Fig. 14). On the other hand, yields and stockings for cyprinids were highly related for total reservoirs and for both extensively and semi-intensively used reservoirs (Tables 6 and 7, Fig. 15). Those results may indicate that stocking of non-reproducing cyprinids has been contributing to total yield, whereas tilapia stocking was misleading after self-sustained tilapia populations developed.
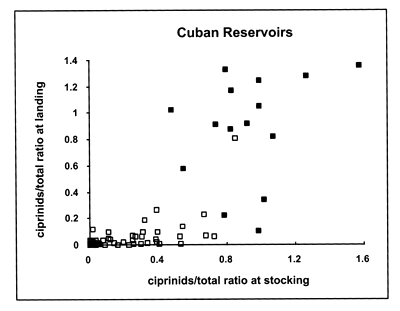
And how has cyprinid stocking affected the total fish yield for both extensively and semi-intensively used reservoirs? There was not a direct relationship between the cyprinid to total biomass ratio at landing and total fish yield for extensively used reservoirs (Fig. 16). However, the cyprinid to total biomass ratio at stocking had a clear enhancement effect on total fish yield for semi-intensively used reservoirs (Fig. 17). It is also evident that, for both types of reservoirs, some stocked cyprinids have not been fished, but a clear threshold was situated between extensively and semi-intensively used reservoirs (Fig. 18). Therefore, the impact of stocking cyprinids in the expectation of increasing yields in the extensively used tropical reservoirs, is not clear from the results obtained for extensively used Cuban reservoirs. However, some cyprinid stockings have not been reflected in catch yet. Some other plausible and alternative explanations related to the fishing effort and applied to cyprinid stocks in extensively used reservoirs are discussed in Fonticiella et al. (1995).
Table 7. Correlation matrices for extensively (#grade=1, n=57) and semi-intensively (#grade=2, n=29) used Cuban reservoirs, respectively.
#grade = 1
| A | SDW | SDWTi | SDWCi | Effort | |
|---|---|---|---|---|---|
| Y | -0.07 | -0.12 | -0.22 | 0.05 | 0.82 |
| Yti | 0.24 | -0.04 | -0.11 | 0.12 | 0.77 |
| Yci | -0.47 | 0.27 | -0.01 | 0.63 | 0.58 |
| SDW | -0.53 | 1 | 0.77 | 0.57 | 0.11 |
| SDWTi | -0.20 | 0.77 | 1 | 0.03 | -0.03 |
| SDWCi | -0.48 | 0.57 | 0.03 | 1 | 0.29 |
#grade = 2
| A | SDW | SDWTi | SDWCi | Effort | |
|---|---|---|---|---|---|
| Y | 0.36 | 0.69 | -0.08 | 0.76 | 0.86 |
| Yti | 0.45 | -0.27 | -0.04 | -0.21 | 0.11 |
| Yci | -0.73 | 0.78 | -0.07 | 0.92 | 0.73 |
| SDW | -0.52 | 1 | 0.33 | 0.91 | 0.75 |
| SDWTi | 0.13 | 0.33 | 1 | 0.01 | -0.19 |
| SDWCi | -0.58 | 0.91 | 0.01 | 1 | 0.80 |
Figure 10. Relationship between fish yield (Y, kg/ha/year) and stocking density in weight (SDW, kg/ha/year) for 86 Cuban reservoirs. (□), extensively used reservoirs; (■), semi-intensively used reservoirs.
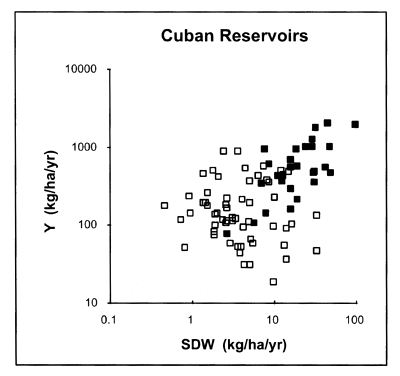
Figure 11. Relationship between fish yield (Y, kg/ha/year) and fishing effort density (effort, men day/ha/year) for 86 Cuban reservoirs. (□), extensively used reservoirs; (■), semi-intensively used reservoirs.
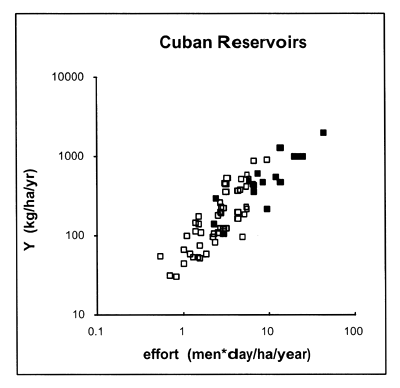
Figure 12. Relationship between total fish yield (Y, kg/ha/year) and cyprinids stocking density in weight (SDWCi, kg/ha/year) for 86 Cuban reservoirs. (□), extensively used reservoirs; (■), semi-intensively used reservoirs.
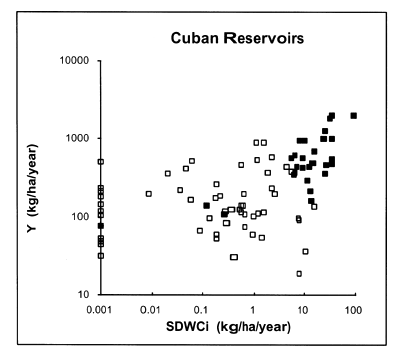
Figure 13. Relationship between total fish yield (Y, kg/ha/year) and tilapias stocking density in weight (SDWTi, kg/ha/year) for 86 Cuban reservoirs. (□), extensively used reservoirs; (■), semi-intensively used reservoirs.
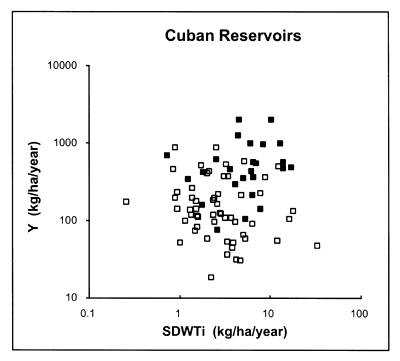
Figure 14. Relationship between tilapias yield (YTi, kg/ha/year) and stocking density in weight (SDWTi, kg/ha/year) for 86 Cuban reservoirs. (□), extensively used reservoirs; (■), semi-intensively used reservoirs.
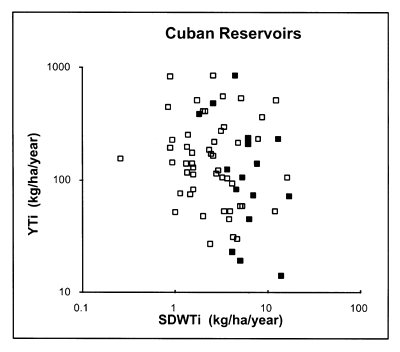
Figure 15. Relationship between cyprinid yield (YCi, kg/ha/year) and stocking density in weight (SDWCi, kg/ha/year) for 86 Cuban reservoirs. (□), extensively used reservoirs, (■), semi-intensively used reservoirs.
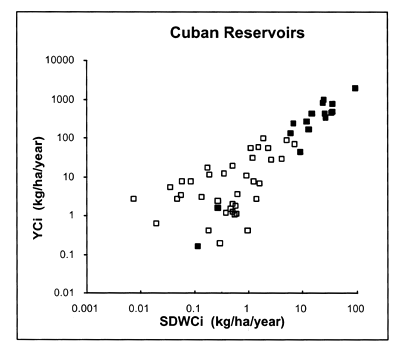
Figure 16. Relationship between total yield (Y, kg/ha/year) and cyprinids to total fish biomass ratio at landing (arc-sin transformed) for 86 Cuban reservoirs. (□), extensively used reservoirs; (■), semi-intensively used reservoirs.
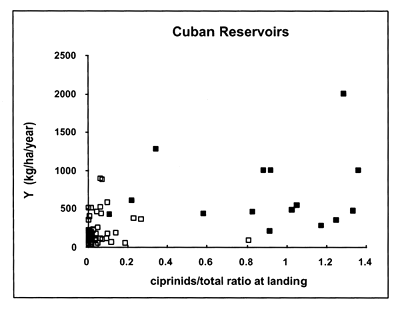
Figure 17. Relationship between total yield (Y, kg/ha/year) and cyprinids to total fish biomass ratio at stocking (arc-sin transformed) for 86 Cuban reservoirs. (□), extensively used reservoirs; (■), semi-intensively used reservoirs.
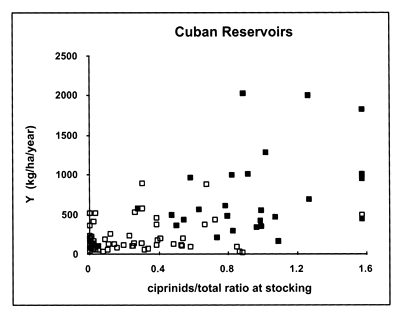
Figure 18. Relationship between cyprinids to total fish biomass ratio at landing and at stocking (both arc-sin transformed) for 86 Cuban reservoirs. (□), extensively used reservoirs; (■), semi-intensively used reservoirs.
4.2.2 Time-series analyses
The results obtained from reservoir comparisons are “mean effect results” and many exceptions for individual reservoirs can be expected. Similar results have been obtained from time-series lag-correlation analyses for total data for 49 extensively used Cuban reservoirs (Fig. 19). Cyprinid yields were significantly related to cyprinids stocked in previous years, although the relationship for lags from 0 and 1 may be related to high cyprinid stockings for the years 1992 and 1993 (Fig. 8). However, there were no significant lag-correlations for tilapias and for total fish, although positive relationship from lags 0 to 2 may be related to high stockings for the period 1991–1993 (Fig. 7).
Figure 19. Lag -correlation analysis between yield and stocking density for 49 Cuban reservoirs. Y, results for total fish; YTi, results for tilapias; Yei, results for Chinese carps. Time series for the period 1973–1993.
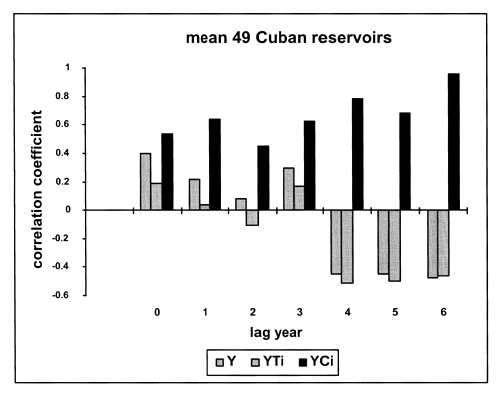
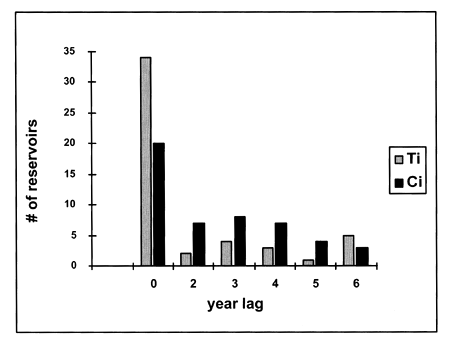
An extensive time-series analysis of stockings for selected Cuban reservoirs has been conducted by Fonticiella et al. (1995). Time-series analyses for each of 49 extensively used Cuban reservoirs (Fonticiella et al., 1995) during the 1973–1993 period are presented here. Six of these reservoirs were moved to semi-intensive use the last few years of the analysed period. The obtained results for the 49 reservoirs are shown in Figure 19. For more than half (n = 29) of the reservoirs, cyprinid stockings were significantly related to cyprinid yields with time lags between 2 and 6 years. For tilapias, stockings were significantly related to yields for a third of the reservoirs (n = 15). Most of the reservoirs show significant spurious correlations for synchronic time-series analyses (year lag = 0).
To what extent the more productive reservoirs have been heavily stocked is a question we can not answer here. However, the high number of reservoirs with significant correlations for lag 0 (Fig. 20) may be indicating a fishery management bias; the most extensively used reservoirs were stocked heavily with tilapias and cyprinids, and intensively fished in the same year.
Figure 20. Number of Cuban reservoirs with significant lag-correlations for the period 1973–1993. 49 reservoirs have been analyzed. Ti, results for tilapias; Ci, results for Chinese carps.
4.3 Socio-economic stocking constraints
The lack of detailed socio-economic information for reservoir fisheries in Latin America makes evaluation of stocking programmes difficult. Full accounting of costs and benefits, including those that have usually been externalised or ignored, has been recommended (White et al., 1995).
An important result from the analysis of the Cuban reservoir tilapia fishery was that it has been cost effective for the extensively used, relatively low stocked, fishery period from the 1970s into the 1980s. On the contrary, economic analyses were negative both for overstocked tilapia fishery and the cyprinid fishery (Fonticiella et al., 1995). However, social benefits would cancel economic costs for the Cuban reservoir fisheries (Fonticiella et al., 1995), as well as for the northeastern Brazil reservoir fisheries (Fonteles-Filho and Alves, 1995).
Stocking is a hot issue for fisheries managers in Latin America. Welcomme (1995) mentioned cost and survival as the two main factors that influence the size chosen for stocking material. However, in Latin America, socio-economic constraints like public impulses and political pressure, also constrain both stocking numbers and mean fish weight at stocking.
5. DISCUSSION
As expected, heavy stocking resulted in higher fish yields, but stocking was only a necessary, and non-sufficient, condition to attain a successful enhancement outcome. Other conditions, like presence of self-sustained and/or non-reproducing fish population, exploitation of stocked fish, external inputs (fertilisers and/or food) adapted to stocking rates, and, obviously, stocking rates adapted to water body natural carrying capacity and/or external inputs, must also be considered.
Some other reservoir data sets have been studied worldwide for the relation between fish yield and stocking rate (De Silva et al., 1992; Quiros, 1995). However, this study is one of the first where reservoirs with very different situations, sizes, and fishery enhancement levels have been compared. Regardless of the wide-scale results obtained, it is believed that these general patterns may be useful for the management of groups of reservoirs for culture-based fisheries.
Stocking effectiveness for individual reservoirs could be evaluated using the obtained relationship between fish yield and stocking density. From the study of the relation between fish yield and stocking density, in tropical Latin America three main groups of reservoirs can be distinguished (Box 1):
Box 1. General Distribution Pattern for Stocked Reservoirs
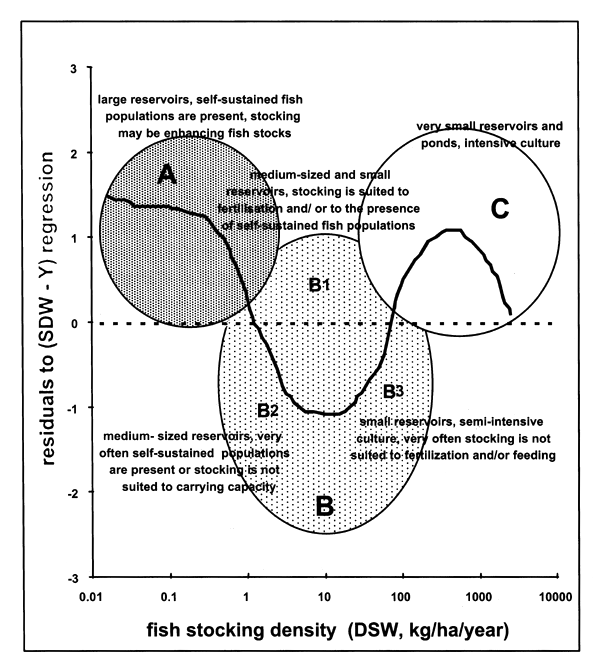
A. This first group encompasses large reservoirs where self-sustained fish populations are present. The water bodies included in this group have relatively low fish yields and low stocking densities suited to the presence of self-sustained fish populations. Stocking may be enhancing fish populations (both self-sustained and non-sustained), increasing recruitment to the fishable stocks. For this group, total fish yield is higher than predicted by the lineal relation between total yield and stocking density. Mexican reservoirs and large and some medium-sized Cuban reservoirs are included in this group.
B. This group includes medium-sized and small reservoirs used for semi-extensive fish production. They have been stocked from medium to large stocking densities. There is not an increasing relation between stocking density and fish yield, and one can identify three subgroups:
B1. Medium-sized and small reservoirs that deviate positively from the general log-log regression model relating fish yield to fish stocking density. For this group, stocking linked to external inputs, like fertilisers, and/or to the presence of self-sustained fish populations may be beneficial. Almost one third of the analysed Cuban reservoirs belong to this subgroup.
B2. Medium-sized reservoirs used for extensive culture-based fisheries. Very often self-sustained populations are present and stocking would probably not lead to any gain. These reservoirs deviate negatively from the general log-log regression model. Almost half of medium-sized Cuban reservoirs belong to this subgroup.
B3. Small and very small reservoirs used for semi-intensive culture. Very often stocking is incompatible with fertilisation and/or feeding levels and, therefore, fish yield is lower than predicted from the general log-log regression model. More than half of small and very small Cuban reservoirs and one fourth of other ponds and very small reservoirs in tropical LA belong to this subgroup.
C. This group encompasses very small reservoirs and ponds used for intensive fish production where stocking density is linked to fertilisation and feeding levels may be beneficial. At the highest levels of fish stocking density, fish yield may be far over carrying capacity for stagnant water bodies. It can generally be assumed that the degree of exploitation of water bodies of this subgroup is close to the sustainable maximum, despite omnivorous fish species in culture.
Management measures to improve culture-based fisheries and to correct mismanagement are, in some way, implicit in the description of each reservoir subgroup. A similar general pattern has been observed for data sets for water bodies situated in both tropical and temperate regions worldwide (Quiros, unpublished data).
The non-significant relationship between total fish yield and stocking density for reservoirs under extensive exploitation is to be expected. Most of the reservoirs included in that subgroup have self-sustained fish populations, and in more than half of them self-sustained populations might not have recruitment failures. It is to be expected that morphoedaphic factors (Ryder, 1968) and hydrology (water residence time) will have a great influence on fish production of tropical reservoirs (Mari and Quiros, 1986).
Fishery managers have developed a cyprinid fishery based on maintenance stocking. However, since 1990 stocking of tilapia in reservoirs was not adjusted to the self-reproduction of the already existing stocks and the non-reproducing cyprinids co-existing in the same reservoirs. Cuban reservoir tilapia fisheries are well managed and do not require further stocking after the initial introduction. Fishery managers have been developing a cyprinid fishery based on maintenance stocking. However, since 1990 stocking has not always been suited to self-sustained tilapia populations and to non-reproducing cyprinid species in the same reservoirs.
Fisheries managed for biomass have problems with the supplementation concept, similar to fisheries managed for biodiversity. The supplementation concept seems out of keeping with ecological and rational management (White et al., 1995). In some sense the Cuban reservoir fishery has been a well-managed fishery. Fish yield was highly related to fishing effort (Mari and Quiros, 1986; Quiros, 1994) on a sustainable basis (Fonticiella et al., 1995). Therefore, indiscriminate supplemental overstocking is not a good way to enhance freshwater fisheries. Supplemental stocking programmes for self-sustained fish populations in reservoirs need to be studied and analysed in a case-by-case basis.
Unfortunately, there are no available data which would make it possible to analyse stocking public reservoirs in northeastern Brazil. Previous results indicated that for these reservoirs fish yields for introduced species were positively related to fish species stocking, whereas for native species yields and stocking were not related (Fonteles-Filho and Alves, 1995). It is probable that most of the introduced fish species to those reservoirs (including tilapias) did not develop self-sustained populations.