Three major management strategies have been described (see Caddy and Mahon, 1996), namely management for a given level of quota, for a given exploitation rate or for a pre-agreed level of spawning escapement. These have more recently been combined with threshold or limit reference point policies (e.g. Quinn et al., 1990). Viewed from the perspective of precaution and the reference points involved, the first of these strategies implies of course quota control, and despite current perspective in many areas of its suitability as a limit reference point, MSY, or more precautionary 2/3 MSY, are RPs here.
The second strategy could, of course, be implemented in a straightforward fashion with control of fleet capacity and fishing power as its primary control variables, although, again, some secondary application of quotas to keep exploitation rates close to constant is usually the strategy adopted. The reference points F0.1 (Gulland and Boerema, 1973) or, more cautiously, F0.2 (Butterworth et al., 1997) are the classical target reference points that correspond to this strategy, with some common RPs, such as FMAX, potentially providing an upper limit.
The third strategy is of course a biomass-based approach, with emphasis on maintenance of spawning potential and monitoring survival of recruits. Here, stock-recruit approaches originally applied for salmon stocks on the Pacific coast of North America have been applied in North-Atlantic areas to groundfish, using either the classical Beverton and Holt or Ricker S-R relationships to define RPs such as FLOSS (Table 4). Recently, the Shepherd production model, which is fitted to age structured data, is the model which is most commonly used and is employed to define truly catastrophic LRPs such as FCRASH (Fig. 5). Where age-structured time series are not available, SSB/R calculations yield LRPs such as F%SPR as described by Clark (1991).
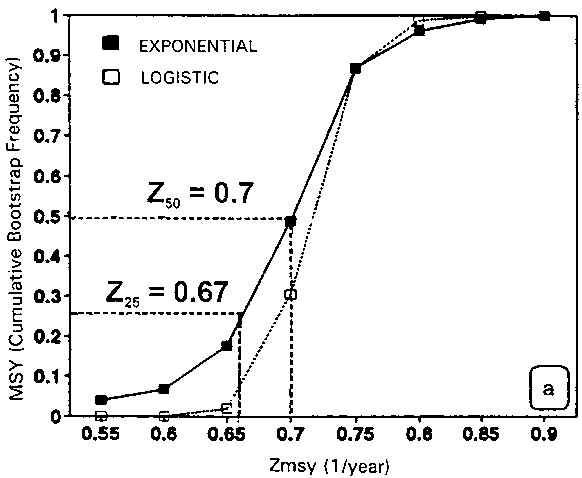
Figure 7. Bootstrap estimates of the total mortality rate at MSY (ZMSY) in a logistic model expressed as cumulative values. Two percentiles, S25 and Z50, might be candidates for a TRP/LP pair (Caddy and Defeo, 1996)
