![]()
![]()
![]()
After having surveyed the important upwelling areas associated with the Somali Current and the Canary Current, the DR. FRIDTJOF NANSEN started surveys of the area associated with the Benguela Current in 1985. The programme started in Angola, Congo and Gabon in 1985 and was extended into Namibia in January 1990 shortly before the independence of that country. Southwest Africa has also become the main area of work for the new DR. FRIDTJOF NANSEN in 1994, however, this review only covers the surveys done with the old DR. FRIDTJOF NANSEN until mid 1993. In order to facilitate the discussion of shared resources the results will be presented following the direction of the Benguela Current, from south to north. Emphasis has also been placed on describing the historical developments of the important fisheries in Namibia and Angola.
A comprehensive and long-lasting series of investigations started in January 1990 with the DR. FRIDTJOF NANSEN immediately prior to the achievement of independence for the country. Following independence, an EEZ was declared and Namibia's jurisdiction over the shelf and its rich fish resources was established. Important fisheries had, however, been developed during the previous state of open access of the Namibian shelf, and an account of the history of these pre-independence fisheries is desirable as a background for the description of the surveys and their results.
Two major industrial fisheries were established off Namibia in the 1950s and 1960s, an inshore pelagic fishery for pilchard and anchovy conducted by a Namibian based purse-seine fleet and an offshore trawl fishery for hake and horse mackerel mainly conducted by distant water fleets from a number of nations. From the 1970s, a limited number of Namibian based vessels participated in the trawl fishery for hake and other groundfish species and with increasing effort in the 1980s. The responsibility for management of the resources and regulation of the fisheries up to independence was divided between the Republic of South Africa's administration in Windhoek (inshore fisheries), and the International Commission for the Southeast Atlantic Fisheries (ICSEAF) (offshore fisheries).
ICSEAF was established by a convention signed in Rome in 1969 and ratified by well over a dozen countries during the 1970s, and ceased functioning in 1990 following the establishment of the Namibian EEZ.
Although ICSEAF's reference area also included the seas off Angola and the Republic of South Africa, its main activities related to the resources and the fisheries off Namibia. This was in fact one of the few rich coastal fishing areas for which an EEZ had not yet been introduced. ICSEAF formed a forum for co-operation among the many fishing countries whose fleets operated in the area with the overall objective of preservation of the resources through regulation of the fisheries.
The catches were reported to ICSEAF by statistical divisions which are no longer used, but are still helpful for describing the history of the offshore fisheries. These divisions start at the northern border of Angola at 5°S and consist of blocks of 5° latitude. Figure 7.1 shows statistical divisions 1.3, 1.4 and 1.5 off Namibia.
The dimensions of the fisheries towards the end of the ICSEAF period can be roughly assessed from the catch statistics. The mean total annual catch from Divisions 1.3, 1.4 and 1.5 over the three-year period 1986–88 as reported to ICSEAF from the various participating countries, was close to 1.3 million t, of which hake 330,000 t, horse mackerel 500,000 t, pilchard and anchovy 230,000 t and others about 230,000 t.
These catches derived from the fishing grounds that now are part of the Namibian EEZ, except for some catches of horse mackerel and other species from southern Angolan waters and small catches by South Africa in the Southern part of Division 1.5.
The main participants in the offshore fisheries in the late 1980s, as demonstrated by reported catches of hake and horse mackerel in Divisions 1.3, 1.4 and 1.5, are shown in Table 7.1. USSR and Spain reported the largest landings followed by Rumania, Bulgaria, Portugal, Cuba and Poland.
Figure 7.1 Namibian shelf and statistical divisions formerly used by ICSEAF
Table 7.1 Main participants in the offshore fishery off Namibia 1986–88 as shown by catches of hake and horse mackerel in ICSEAF Divisions 1.3, 1.4 and 1.5. Mean annual catch (1,000 t)
| Hake | Horse mackerel | ||
|---|---|---|---|
| Spain | 150 | USSR | 231 |
| USSR | 118 | South Africa | 96 |
| Portugal | 29 | Rumania | 70 |
| South Africa | 29 | Bulgaria | 47 |
| Others | 6 | Poland | 15 |
| Rumania | 4 | Others | 18 |
| Poland | 4 | Cuba | 18 |
| Spain | 18 | ||
| Total | 340 | Total | 511 |
| Source: ICSEAF Stat.Bull. 1986 and 1987 and SAC/89/Doc. 12. | |||
The management measures introduced by ICSEAF included global TACs for horse mackerel, chub mackerel and snoek, TACs allocated by country for the hake stocks, a minimum trawl mesh size, an inshore prohibition zone for trawling, and a maximum percentage bycatch of hake in the horse mackerel catches.
The inshore pelagic fishery: Pilchard and anchovy
The fishery for Southern African pilchard (Sardinops ocellatus) and Southern African anchovy (Engraulis capensis, also named E. encrasicolus) was based in Walvis Bay, and in some years included also factory ships. Following a period of rapid development of the fishery for pilchard in the early 1950s the yields remained quite stable until the early 1960s due to a policy of strict regulation of both landing quotas and processing capacity (Table 7.2).
Table 7.2 Landings of pilchard in Namibia. Catches by factory ships included. (1,000 t)
| Year | Landings | Year | Landings | Year | Landings |
|---|---|---|---|---|---|
| 1951–55 | 273 | 1972 | 562 | 1981 | 374 |
| 1956–60 | 248 | 1973 | 561 | 1982 | 408 |
| 1961–65 | 540 | 1974 | 452 | 1983 | 44 |
| 1966 | 801 | 1975 | 200 | 1984 | 56 |
| 1967 | 926 | 1976 | 46 | 1985 | 54 |
| 1968 | 1,387 | 1977 | 34 | 1986 | 53 |
| 1969 | 1,110 | 1978 | 11 | 1987 | 67 |
| 1970 | 514 | 1979 | 52 | 1988 | 63 |
| 1971 | 325 | 1980 | 51 | 1989 | 76 |
| Sources: 1951–66 (Newman, 1970); 1967–82 (ICSEAF, 1983), 1983–86 (Le Clus et al., ICSEAF), 1987–89 Dept. of Agriculture, Namibia. | |||||
From 1959 onwards, the policy of strict regulation was abandoned. Quotas rapidly increased and during the mid-1960s the fishery greatly expanded. The boom culminated in 1968 with a total catch of pilchard in Namibian waters, including that of South African factory ships, of nearly 1.4 million t. Thereafter, the catch fell drastically because of fish scarcity until 1972 when, due to improved recruitment in the stock, the decline was temporarily halted and was even reversed for a couple of years. After 1976 the downward trend accelerated to the average low level of about 50,000 t during 1978–90.
As a consequence of the decline in the stock the fleet was reduced to less than half its previous size and large segments of the processing industry were closed down.
To counterbalance the dwindling supply of pilchard for the processing industry, the fleet directed its attention towards other pelagic resources which can be harvested by purse-seine, primarily anchovy, round herring or redeye (Etrumeus whiteheadi) and horse mackerels (Cape horse mackerel, Trachurus capensis, and Cunene horse mackerel, Trachurus trecae.) These species are found in the same inshore fishing localities as the pilchard, and the occurrence of fishable aggregations of all three species may overlap considerably both with regard to locality and season. There was thus a problem of by-catch of pilchard, especially juveniles, in the fisheries directed towards these other pelagic species.
The fate of the pilchard stock during the 1960s and 1970s must be described as a collapse caused by depletion through excessive fishing. Over 12 years, 1967–78, the estimated total biomass of the stock declined from some 6 million t to about 100,000 t.
Several other large pelagic stocks were depleted around this period (North Sea and Atlanto-Scandian herring, Peruvian anchoveta) and in retrospect it must be recognized that fishery science was by that time perhaps not sufficiently developed to enable a proper management of these types of fish stocks. In particular, it is now realized that catch rates for typically schooling species are not a reliable measure of the abundance of the stock.
ICSEAF's Scientific Council reviewed the pilchard stock annually from 1976 to 1989. For 1978 a recommendation was passed to set the quota “as low as possible to maintain a viable fishery based on alternative stocks”. In 1979 and at a number of later sessions recommendations for stringent regulatory measures were submitted, including that of a total ban on fishing adult pilchard and limitations on the bycatch of juvenile pilchard in the anchovy fishery. In later years, however, the reports from the Council must be interpreted as following a policy of recommending catch levels which would maintain the stock at its very low level. Thus for the 1988 season it was suggested that the TAC be set at between 20% and 25% of the projected standing biomass and for 1989 it was proposed that the TAC should not exceed 40,000 t.
The anchovy fishery started in 1968 when small-meshed purse-seine nets were introduced. This short-lived fish showed large natural year-to-year fluctuations of yield and stock abundance from the start of the fishery, and annual catches varied between 83,000 t and 355,000 t until 1983, (Table 7.3). By the early 1980s, however, a general decline of adult stock biomass was recorded and the fishery came to depend on higher proportions of juveniles. The low catches during 1984–86 demonstrated a depleted stock. An unexpected large increase of yield took place in 1987. This was concurrent with a record increase of stock size and catch of the South African anchovy and South African investigations have indicated the possibility of a relationship between the recovery of the Namibian anchovy stock and that of the South African stock. Whether this happened remains uncertain, but afterwards the Namibian anchovy stock and the landings again declined.
Table 7.3 Landings of anchovy in Namibia (1,000 t)
| Year | Landings | Year | Landings |
|---|---|---|---|
| 1968 | 161 | 1979 | 277 |
| 1969 | 226 | 1980 | 190 |
| 1970 | 189 | 1981 | 199 |
| 1971 | 185 | 1982 | 83 |
| 1972 | 137 | 1983 | 184 |
| 1973 | 296 | 1984 | 14 |
| 1974 | 249 | 1985 | 51 |
| 1975 | 186 | 1986 | 16 |
| 1976 | 88 | 1987 | 376 |
| 1977 | 133 | 1988 | 117 |
| 1978 | 355 | 1989 | 79 |
| Sources: ICSEAF, 1983, Le Clus et al., 1986. 1987–89: Department of Agric., Namibia | |||
The trawl fisheries
The existence of large offshore demersal and semi-pelagic resources in the Benguela Current system was proved by surveys in the late 1950s. Exploitation of these resources began in the early 1960s with long-distance trawlers and by 1965 had developed into a 500,000 t multinational fishery.
This development coincided with a rapid general build-up in many countries of modern stern-trawler fleets, which resulted in heavily increased fishing pressure and subsequently reduced catch rates in the North Atlantic demersal fisheries. The deep-sea fisheries development off Southwest Africa was, therefore, basically a much needed redeployment of excessive catching capacity from the North Atlantic, a need further enhanced by the introduction of the EEZ regime in the mid-1970s by most coastal States.
In the beginning, fishing was concentrated on hakes (Cape hake, Merluccius capensis and deep-water Cape hake, Merluccius paradoxus) but, during the 1970s horse mackerels became increasingly important, particularly after 1976 when hake catches started to decline rapidly.
Hakes were primarily fished with a standard bottom trawl, fairly similar in all fleets, although differing somewhat in details of net construction and rigging. The minimum codend mesh size for hake was stipulated by ICSEAF regulations as 110 mm. However, when trawling for horse mackerels with bottom trawls, some hake were often taken as bycatch and, since this gear had a smaller codend mesh size (60 mm), some quantities of juvenile hake may have been caught.
From the mid 1970s, directed fishing for horse mackerel was carried out with pelagic trawls, sometimes also operated in a semi-pelagic mode. This technology was closely related to that developed for blue whiting and mackerel in the North Atlantic, i.e., pelagic trawls with a very large opening and with the front part and wings made of very large meshes and/or longitudinal ropes.
In the late 1980s the majority of the foreign fleet vessels fishing off Namibia, were large long-range freezer trawlers (≥ 1,000 t), many also equipped for further processing of the catches on board (factory vessels).
The state of the hake stocks
The two species, Cape hake and deep-water Cape hake are not distinguished in the commercial fishery in Namibia, but were identified in the sampling during surveys with the DR. FRIDTJOF NANSEN. Cape hake is found along the entire Namibian shelf, while deep-water hake has its main distribution south of 25°S.
Therefore, the validity of ICSEAF's views of the stock structure of the Namibian hakes with a northern and a southern stock divided at approximately 25°S is doubtful, but for the purpose of this historical description, reference to this stock structure has been maintained.
The stocks were monitored from the early 1970s by ICSEAF scientists. There was a rapid build-up of fishing effort on the northern stock from the mid 1960s to the early 1970s, with catches increasing to a peak of about 606,000 t in 1972 (Table 7.4). The effort remained at a high level towards the end of the 1970s but with declining catches and catch rates.
The history of the fishery on the southern Division 1.5 stock shows much the same picture of high catches in the late 1960s and early 1970s followed by a sharp trend of decline until the early 1980s.
Table 7.4 Catches of hake off Namibia (1,000 t)
| Year | Northern stock Division 1.3 + 1.4 | Southern stock Division 1.5 | Total |
|---|---|---|---|
| 1965 | 93.5 | 99.7 | 193.2 |
| 1966 | 212.4 | 122.2 | 334.6 |
| 1967 | 195.0 | 199.4 | 394.4 |
| 1968 | 382.7 | 247.7 | 630.4 |
| 1969 | 320.5 | 206.2 | 526.7 |
| 1970 | 402.5 | 224.7 | 627.2 |
| 1971 | 365.6 | 229.7 | 595.3 |
| 1972 | 606.1 | 214.0 | 820.1 |
| 1973 | 377.6 | 290.3 | 667.9 |
| 1974 | 318.8 | 195.7 | 514.5 |
| 1975 | 309.4 | 178.7 | 488.1 |
| 1976 | 389.0 | 211.9 | 600.9 |
| 1977 | 275.9 | 154.5 | 430.4 |
| 1978 | 254.2 | 125.1 | 379.3 |
| 1979 | 170.0 | 140.1 | 310.1 |
| 1980 | 97.2 | 71.6 | 168.8 |
| 1981 | 90.3 | 120.6 | 210.9 |
| 1982 | 176.4 | 130.1 | 306.5 |
| 1983 | 216.1 | 123.3 | 339.4 |
| 1984 | 228.5 | 141.8 | 370.3 |
| 1985 | 211.4 | 200.1 | 411.5 |
| 1986 | 231.1 | 149.8 | 380.9 |
| 1987 | 136.4 | 162.6 | 299.0 |
| 1988 | 211.7 | 123.2 | 338.2 |
| Source: ICSEAF, 1983, 1986, 1987, 1989 | |||
The hake stocks became seriously overexploited already by the mid 1970s and remained in that state in spite of the efforts on the part of the ICSEAF countries to manage these resources by various regulations of the fisheries. Table 7.5 summarizes the history of ICSEAF's efforts to manage the fisheries on the Namibian hake stocks with an outline of the scientific diagnosis of the state of the stocks, the management advice submitted to the Commission, the regulations adopted and the reported total catch in the year to which the regulation applied.
A mesh increase to 110 mm was introduced in 1975. By that time the scientists had already concluded that the stocks were heavily fished and they recommended a limitation of total catches in 1976. Such limitations were adopted from 1977 onwards, but the effects of these measures can only have been limited since the adopted TACs exceeded the actual catches by more than 100,000 t for the years up to 1980.
Towards 1980, the effort in the hake fisheries declined; this was not the effect of management measures but the reaction of the fleets to declining stocks and catch rates. Recruitment to the stocks was, however, greatly improved in the early 1980s especially the 1982 and 1983 year classes. Fishing then soon revived with considerably increased ICSEAF quotas and in two years, 1983 and 1984, the total catches approached the level of the quotas. It quickly became apparent, however, that no use had been made of the high recruitment in the early 1980s to rebuild the adult stock. From 1985 on the total annual catches were about 100,000 t below the adopted TACs (Abello et al., 1988; Macpherson et al., 1985 and 1986).
It seems evident from the stock history from the mid 1980s that the ICSEAF scientists' assessments based on total production models exceeded the potentials of the stocks and it is reasonable to conclude that either the data or the model used must have been at fault. Assessments of the stocks in 1986 based on a Virtual Population Analysis (VPA) (Schumacher, 1987) deviated significantly from other results and indicated an exerted level of fishing mortality at more than the double of Fmax, whereas the assumption had been that the stocks were fished at a moderate level. The assessment also showed that the fishing mortality of two-year old was excessive, particularly in the years 1982–84. Later developments in the fishery confirmed the diagnosis of over-fished stocks with declining catch rates and low recruitment.
According to the VPA assessment the level of the exploitable stock biomass in the early period of the fishery (1968–76) was about 800,000 t based on data from ICSEAF Divisions 1.3 and 1.4, while including Division 1.5 it would probably be 1.2 million t. This could be considered as an approximate target for standing stock biomass for a long-term optimal exploitation of the hakes referring to the exploitable part of the stocks in these divisions. It would represent an annual sustainable catch level of about 400,000 t. The mean reported annual landings in the period 1968–77 were 590,000 t, but this would include yields from an accumulated stock. On the other hand, the mean annual catch in the period 1978–87 when the stock was reduced by over-exploitation was only 318,000 t.
Table 7.5 Management history record for the Namibian hake stocks Source: ICSEAF, 1972–1988
| Year | Scientific diagnosis | Scientific advice given | Management regulations adopted and TACs set | Total catch corresponding with TAC |
|---|---|---|---|---|
| 1973 | Small mesh size wasteful | Increase mesh to 110 mm | 110 mm mesh size from 1/1 1975 | 667,900 t ('73) |
| 1974 | Hake stocks heavily fished risk of decline of total yield | Prevent further substantial increase in amount of fishing | None | 514,500 t ('74) |
| 1975 | Hake stocks fully exploited yield from two stocks 650,000 t | Prevent that catches in divisions 1.3, 1.4, 1.5 and 1.6 exceed 800,000 | None | 488,100 t ('75) 600,900 t ('76) |
| 1976 | Revised assessment for two stocks 550,000 | Not to exceed 480,000 t for both stocks (300 + 180) | 1977 TAC of 536,000 t with allocation by countries | 435,000 t ('77) (277 + 158) |
| 1977 | Further revision of assessment recommend a 10% decrease in FMSY TACs in 1976 and f0.1 = 360,000 t | Not to exceed 410,000 t for both stocks | 1978 TAC: 480,000 t | 382,000 t ('78) (258 + 124) |
| 1978 | 1977 measures inadequate for stock recovery; decline not halted | Not to exceed 300,000 t (200 + 100) | 1979 TAC: 415,900 t | 302,000 t ('79) (172 + 130) |
| 1979 | f0.1 in present stock conditions may be higher than F0.1 or Fmax of analytical model | 1980 TAC: 320,000 t | 160,000 t ('80) (90 + 70) | |
| 1980 | Stock in 1.3 and 1.4 further signs of severe deterioration, stock in 1.5 more stable | TAC for 1.3 + 1.4 not to exceed 90,000 t and for 1.5: 100,500 t | 1981 TAC: 210,000 t (110 + 100) Closure of inshore zone | 208,000 t ('81) |
| 1981 | Notable reduction of effort in fisheries. Regretable lack of data for virtual population analysis | North: f0.1 = 217,000 t South: f0.1 = 135,000 t | 1982 TAC: 352,000 t | 305,000 t ('82) |
| 1982 | Stock recovering slightly as result of decreased effort since 1980 | North:f0.1 = 270,000 t South: f0.1 = 143,000 t | 1983 TAC: 413,000 t | 339,000 t ('83) |
| 1983 | Recovery of stocks levelled out in 1982 | North: f0.1 = 253,000 t South: f0.1 = 138,000 t | 1984 TAC: 391,000 t | 370,300 t('84) |
| 1984 | Stock in recovery but concern over heavy rate of exploitation on recruiting fish | North: TAC = 266,000 t South: TAC = 163,000 t | 1985 TAC: 429,000 t | 411,500 t ('85) |
| 1985 | Estimated increase of catch rates in northern stock but not in south | North: TAC = 318,000 t South: TAC = 163,000 t | 1986 TAC: 481,000 t | 381,000 t ('86) |
| 1986 | New VPA shows present F double Fmax for northern stock but production models show state of moderate exploitation | North: TAC 253,000 t South: TAC 158, 000 t | 1987 TAC: 411,000 t | 299,000 t ('87) |
| 1987 | Models considered to give overoptimistic estimate. Direct measures show trends of decline | North: TAC 253,000 t South: TAC = 158,000 t | 1988 TAC: 411,000 t | 335,000 t ('88) |
| 1988 | Models indicate TAC at about previous levels, but scientists concerned about declining catch rates and low recruitment | North: TAC = 253,000 t South: TAC = 158,000 t | 1989 TAC: 411,000 t |
The state of the stock of Cape horse mackerel
Catches of Cape horse mackerel (T. capensis) since 1966 are shown in Table 7.6. Some, usually minor, amounts derive from fishing in southern Angola. The fishery on this stock expanded greatly with catches below 100,000 t until 1970, then at about 200,000 t till 1975 and fluctuating around 500,000 t from 1976 to 1980. Catches peaked in 1982 with 660,000 t, and later declined. It is possible, however, that the highest catch of this species, about 800,000 t, was obtained already in 1978 when for a few years very high catches of what was assumed to be Cunene horse mackerel (T. trecae) were reported from Division 1.3. The major part of these may in fact have been Cape horse mackerel (T. capensis) since there is some confusion over the separation of the two species in this area where they both occur.
Table 7.6 Catches of Cape horse mackerel reported from divisions 1.3, 1.4 and 1.5 in 1966–89 and ICSEAF TACs 1980–88. (1,000 t)
| Year | Catch | Year | TAC | Catch |
|---|---|---|---|---|
| 1966 | 99.6 | 1980 | 500 | 544 |
| 1967 | 72.4 | 1981 | 500 | 590 |
| 1968 | 69.2 | 1982 | 500 | 660 |
| 1969 | 46.5 | 1983 | 643 | 606 |
| 1970 | 50.4 | 1984 | 647 | 530 |
| 1971 | 214.5 | 1985 | 630 | 435 |
| 1972 | 72.2 | 1986 | 485 | 448 |
| 1973 | 271.4 | 1987 | 440 | 548 |
| 1974 | 193.1 | 1988 | 472 | 539 |
| 1975 | 242.2 | 1989 | 497 | |
| 1976 | 456.2 | |||
| 1977 | 352.1 | |||
| 1978 | 516.2 | |||
| 1979 | 401.6 | |||
| Source: ICSEAF, 1983, 1986, 1987; FAO Yearb. Fish.Stat. Vol. 60 | ||||
It proved difficult for the ICSEAF researchers to obtain precise and reliable assessments of this stock, one reason being the problem of obtaining meaningful indices of abundance from catch rates in a directed fishery for this schooling species. Since the mesh size of the trawl gear used for horse mackerel must be smaller than the minimum mesh of 110 mm used in the hake fishery, the bycatch of small hake in the horse mackerel catches was a management problem. An ICSEAF provision stipulated a maximum bycatch level of 20% of hake.
With the objective of limiting the total fishing effort in the horse mackerel fishery, ICSEAF adopted a global TAC each year from 1980 to 1989 (Table 7.6), together with a catch reporting scheme to the Secretariat to permit closure of the fishery when the quota was reached. However, the catches often exceeded the global TACs.
In evaluations in the late 1980s ICSEAF scientists considered the Cape horse mackerel stock to be in a healthy state. In a general way the results of the fishery seem to have confirmed this diagnosis.
Other exploited resources
Various other species of demersal fish were taken mostly as subsidiary catches in the offshore trawl fisheries for hake and horse mackerel. Kingklip (Genypterus capensis) was caught both as a by-catch in the trawl fisheries and in directed long-lining. Total catches were around 15,000 t of which somewhat less than one-third in Namibian waters. Anglerfish (Cape monk, Lophius vomerinus, synonym: L. upsicephalus) was mainly taken as bycatch in the hake fisheries, with catches in the late 1980s of about 15,000 t of which roughly two-thirds came from Namibian waters. Catches of large-eye dentex (Dentex macrophthalmus) exceeded 25,000 t in the late 1970s, but declined to 6,000–8,000 t in the 1980s.
In the group of other pelagic fish snoek (Thyrsites atun) was the most important species. Catches by long-line alone at a level of 5,000–20,000 t, increased to 80,000 t with the start of a trawl fishery in the late 1970s. A major part of the catches came from Namibian waters. A global TAC of 34,000 t was adopted by ICSEAF in 1985 and maintained at about this level, but catches during 1987 and 1988 only reached some 25,000 t.
Chub mackerel (Scomber japonicus) showed varying catch levels, in the latest years about 30,000 t.
Squids were caught at a level of about 10,000 t over the 1980s, most of this catch coming from Namibian waters.
Survey objectives and operational data
In the Southwest African People's Organization's (SWAPO) plan for the reconstruction and development of independent Namibia (UNIN, 1986), the recovery of depleted and overexploited fish stocks was described as one of the foremost objectives of the country's fisheries policy, and this priority was adopted by Namibia's first Government in its fisheries sector plan. Since the offshore fisheries as well as all ICSEAF-sponsored activities ceased following Independence, this traditional source of information on the state of the fish stocks was not to be available for guiding the future management of the sector. Direct observations of the stocks obtained through surveys by fishery research vessels can, however, provide most of the information needed for fishery management and the DR. FRIDTJOF NANSEN programme in Namibia was perceived as one of the tools of such an approach.
The survey objectives were accordingly defined simply as being descriptions of the distribution, composition and abundance of the most important resources of fish and shellfish (although little information was expected to be obtained on lobster). The pelagic fish - horse mackerel, pilchard and anchovy - would be investigated by the acoustic integration method combined with sampling with mid-water and bottom trawls, while a swept-area trawl survey programme would be used for the demersal stocks, mainly hakes.
Environmental studies would include recording of surface temperature on a continuous basis and occupation of hydrographic stations in a series of fixed profiles.
These main objectives were maintained throughout the survey period, 1990–93. More specific tasks were added as required, for example: survey 3/90 and 2/91 to use the acoustic system to observe and assess hake in mid-water; survey 2/91 trawl selectivity experiments for hake with metal frame separator; survey 1/92 collection of taxonomic data for preparation of a species guide in co-operation with the FAO Species Identification Programme (Bianchi et al., 1993).
It proved practical to separate the planning and execution of the surveys of demersal resources from those of small pelagics. The first needed a fairly synoptic coverage of the whole shelf from about 150–500 m depth, while the surveys for the pelagic fish, especially pilchard and anchovy could be limited to the middle and inner shelf from central Namibia northwards.
Table 7.7 gives the timing and some data on the survey effort. There were two surveys per year for each group, mostly in the summer (January-March) and late spring (October-December). The demersal trawl stations were positioned in a semi-random manner along course tracks, and after more data had been obtained the density of the stations was adapted to the expected fish densities. The balance between the effort expended and the need for precision of the hake estimates was thought to have been found with 180–190 trawls stations in a 35–40 day survey. Problems of survey methodology, especially that of the occurrence of hake in mid-water above the headline of the trawl, are described and discussed below. Figure 7.2 shows an example of course tracks and stations in one of the later hake surveys, survey 2/1992.
The survey intensity in the investigations of pelagic fish varied, but was generally very high in inshore pilchard areas and was further increased when the pilchard stocks diminished in 1992–93. The extreme inshore distribution of the pilchard schools was a constraint on a full coverage of the resource in several surveys, while other methodological problems were also experienced. Therefore repeat surveys under different conditions were often made. Complementary and co-operative surveys with the Namibian research vessel BENGUELA added to the effort spent in the pelagic investigations from late 1991 on, as did scouting activities by commercial purse-seiners jointly with or prior to the surveys. The total effort in these surveys in the period 1990–93 must be assessed to have been very high. Figure 7.3 shows an example of repeat coverages for pilchard under different conditions in survey 2/93.
Figure 7.2 Example of the course tracks and stations of one of the later hake surveys (survey 2/92)
Figure 7.3 Example of repeated coverages of pilchard under different conditions of fish behaviour (survey 2/93)
Table 7.7 Operational details of the surveys in Namibia, 1990–93
| Objectives | No. of days work | No. of fishing stations | ||||||
|---|---|---|---|---|---|---|---|---|
| Survey | Dates | Demersal fish | Pelagic fish | Demersal and pelagic | Demersal and pelagic | |||
| I | 1/90 | 25/1-10/3 | X | X | 44 | 169 | ||
| II | 2/90 | 27/5-20/6 | X | 23 | 96 | |||
| III | 3/90 | 11/9-6/10 | X | 26 | 129 | |||
| Demersal | Pelagic | Demersal | Pelagic | |||||
| IV | 1/91 | 15/1-22/3 | X | X | 34 | 20 | 174 | 69 |
| V | 2/91 | 23/10-16/12 | X | X | 29 | 24 | 170 | 102 |
| VI | 1/92 | 23/4-21/6 | X | X | 30 | 29 | 164 | 102 |
| VII | 2/92 | 20/10-16/12 | X | X | 42 | 14 | 192 | 43 |
| VIII | 1/93 | 20/1-19/3 | X | X | 37 | 23 | 184 | 45 |
| IX | 2/93 | 21/4-19/6 | X | X | 35 | 24 | 208 | 88 |
Responsibility for planning and execution of the surveys was shared between the Ministry of Fisheries and Marine Resources of Namibia, in particular the research unit in Swakopmund and the IMR, Bergen. Representatives of FAO Marine Resources Service participated in taxonomic work.
Cruise reports were issued after each survey, (IMR, 1990a, 1990c, 1990e, 1991a, 1991d, 1992e, 1992g, 1993a, 1993b). A summary report covering this period has not been produced, however IMR, 1994b contains an overview of work done with the old DR. FRIDTJOF NANSEN, see Appendices I and II). All biological data were entered in the NAN-SIS databank during the surveys.
The shelf and the slope
The coastline is about 800 nmi from the mouth of the Orange River (28°38'S) in the south to that of the Cunene River (17°15'S) in the north. The depths over the shelf and the slope and the quality of the bottom were incompletely described in the available nautical charts. Observations of depths from the DR. FRIDTJOF NANSEN surveys were used to prepare the bathymetric chart presented in Figure 7.4. Echosounding also provided information on the type of bottom, smooth and even or uneven, and rough and hard or soft.
From the Orange River to Panther Head (27°55'S) the shelf is wide with 200 m isobath at 70–80 nmi offshore. The slope is relatively steep and the 500 m isobath lies about 90 nmi offshore. Considerable parts of the bottom are uneven and rough, especially inshore. Hard and rough bottom was also found on the slope, especially around the 300 m range. From Panther Head up past Lüderitz (26°35'S) the 200 m isobath approaches the coast to about 20 nmi, but the slope is gentler and the 500 m isobath lies 50–60 nmi or more off the coast. Rough and uneven bottom is common over the inshore parts. In the northern part of the ICSEAF Division 1.5 up past Easter Point (25°18'S) the shelf is wide with the 500 m isobath at about 70 nmi from the coast and with more than half of that width consisting of a gently deepening slope from 200 to 500 m. Rough, uneven bottom dominates the innermost parts of the shelf up to 20–30 nmi from the coast and there is also rough ground offshore especially off Dolphin's Head (25°40'S) at 200–300 m depth.
Figure 7.4 Bathymetric chart of the Namibian shelf based on echosounder observations from the DR. FRIDTJOF NANSEN surveys 1990–91. Type of bottom indicated
The broad shelf continues from Easter Point (25°18'S) northwards towards Ambrose Bay (21°S) with a generally gentle slope from 200 to 400 m depth. Most of the bottom is smooth with few and limited rough parts. An inshore belt extending out past 100 m depth, in some places to 150 m has very soft muddy bottom. At times, indications of anoxic conditions were found in this type of bottom and catches were absent or low. In some hauls from this zone the trawl contained large numbers of fish bones, and in other cases large amounts of dead mussels. Frequently the trawl got stuck after a short tow, being filled with mud. This mud layer is mainly of biogenic origin and derives from the intensive organic production caused by upwelling. Anoxic conditions associated with upwelling at times causes mass mortalities of fish and shellfish.
From Ambrose Bay up towards Cape Frio (18°30'S) the shelf maintains a width of about 70 nmi to the 500 m depth line, of which about half consists of a gentle slope from 200 m outwards. From Cape Frio to the Cunene River (17°15'S) the shelf narrows to about 25 nmi with a steep slope from the 200 m depth line.
Table 7.8 shows the approximate extensions of the areas between various depth ranges along the coast based on the depth chart shown in Figure 7.4. The total shelf area to 250 m is 25,000 nmi2 and the slope from 250 to 550 m about 19,000 nmi2.
Table 7.8 Coastline (nmi) and areal extension of shelf and slope by depth strata (nmi2)
| Coastline nmi | 0–250 m nmi2 | 250–350 m nmi2 | 350–450 m nmi2 | 450–550 m nmi2 | |
|---|---|---|---|---|---|
| Orange River - 25°S | 240 | 12,000 | 3,300 | 3,000 | 1,700 |
| 25°S - 21°S | 250 | 8,300 | 3,700 | 1,700 | 700 |
| 21°S - Cunene River | 250 | 5,100 | 2,700 | 1,600 | 800 |
| Total | 740 | 25,400 | 9,700 | 6,300 | 3,200 |
Hydrography
The hydrographic conditions during each survey as observed by the oceanographic programme are described in each of the preliminary survey reports. No collective analysis has as yet been made of these data, the main problem being the very limited representativity in time of surface layer observations. Nearly all surveys experienced the effects of a few days gale in changing the surface layer conditions. The data may, however, be of value in supplementing satellite observations and in studying deeper layers. Thus, simple inspection of the observed dissolved oxygen in the profiles indicates a prevalence in many surveys of low oxygen near the bottom of the inner shelf in the central region from Conception Bay to Cape Cross.
The coastal hydrography of Namibia is well described in the literature. The waters form part of the Benguela Current system, one of the four major eastern boundary systems of the world. The surface current in general flows northwards, roughly following the isobaths between latitudes 34°S and 23°S, while north of 23°S (near Walvis Bay) it tends to veer away from the coast (Parrish et al., 1983). In the north a front of Angola warm surface water moves latitudinally with the season and reaches its southernmost position in the autumn (November).
There is a southward undercurrent flowing parallel to the coast west off the shelf edge and penetrating to the coast south of Lüderitz (Shannon, 1985). This undercurrent is at times characterized by a low dissolved oxygen content, typically between 1 and 2 ml/l.
Upwelling intensity varies in space and time following changes in the wind regime and because of coastline and shelf topography. Major centres of upwelling in Namibia are near Cape Frio (18°30'S) and from Lüderitz to the Orange River estuary (26°35'S to 28°38'S). The latter is believed to effectively divide the Benguela Current system into two regions, acting as an environmental barrier for some key species.
Upwelling is perennial off Namibia, but less intensive in the north in summer, while inter-annual variability is important. Although there have been several warm and cool periods in the Benguela Current from the early 1950s to 1985, according to Shannon (1985) only two events come close to major El Niño type situations viz. in 1963 and 1984. In these events warm highly saline Angolan water intruded southward and temperatures of 2–4 degrees above normal were recorded in the upper 50 m off Namibia. The most important biological effect is probably an accompanying reduced primary productivity.
The species covered by these investigations were pilchard, anchovy, round herring (Etrumeus whiteheadi) and Cape horse mackerel, of which pilchard and anchovy had the highest priority. The distribution of horse mackerel was covered in most cases mainly over the inshore and middle shelf.
Several methodological problems were encountered in the attempts to describe the distribution and abundance of the stocks by echo integration surveys. Especially two features of pilchard behaviour created difficulties: an extreme inshore distribution in some surveys particularly in the Cape Frio area and a distribution at the surface at night which took most of the biomass above the reach of the transducer. During daytime the pilchard in a particular area would at times aggregate in a few very large schools causing high variance of the estimates. Attempts to overcome these problems of method were made by repeating surveys in areas where fish concentrations had been located. Identification to species level based on acoustic observations of such characteristics as school form and density was at times not possible and therefore trawl sampling was intensive although at times complicated by high densities of jellyfish.
In conclusion it is thought that the methodological problems were largely overcome by the very high effort put into the investigations through the combined use of the DR. FRIDTJOF NANSEN, BENGUELA and the commercial vessels. The findings show trends in stock biomass over time and can in general be said to be consistent with the outcome of the fishery.
Figure 7.5 Distributions of pilchard, with some anchovy and round herring. May-June 1990 (2/90) (left top and bottom); Nov-Dec 1991 (2/91) (right top and bottom) and March 1993 (1/93) far right, bottom)
Pilchard
Distribution
With its original large stock size in the 1960s, pilchard was distributed from south of Lüderitz northwards into Angola. The fisheries were based in Walvis Bay, Lüderitz and Moçâmedes (now Namibe, 15°10'S). Pilchard tagged in Walvis Bay were recaptured in Angola and Lüderitz, but only very few in the South African western Cape fishery (Newman, 1970) demonstrating the structure of a Namibian stock. Aerial spotting in the early 1970s showed that fish occurred fairly evenly along the coast between 19°S (Rocky Point) and 25°S (Easter Point) during summer, but mainly from Walvis Bay northward in winter (Agenbag, 1980). The pelagic fish was found in an intermediate zone between inshore waters of dense phytoplankton and offshore waters of dense zooplankton. Offshore distribution (to 50 nmi) declined more rapidly in summer than in winter.
Pilchard shares the inner shelf with anchovy and round herring, classified together as “Type 1 pelagic fish” in the terminology of acoustic surveys. In many of the DR. FRIDTJOF NANSEN survey reports the distribution of these species was shown together, although the important aggregations were identified by trawl sampling to species level. In addition, young Cape horse mackerel was common on the inner shelf from about Walvis Bay northward.
Figures 7.5a through c, show the distribution of pilchard with some anchovy and round herring for a selection of the surveys over the period, viz., 2/90, 2/91 and 1/93. Of the total of eight surveys three were from summer February-March, three from autumn May-June and two from late spring November-December. An inspection of the distributions shows no clear latitudinal shift with the season along the Namibian coast. As described in Section 7.2 below, the occurrence of pilchard in southern Angola appeared to have a seasonal cycle with a maximum in winter. Some of the pelagic surveys from Namibia also covered the Angolan shelf to Tombua, in a co-operation with IIP Luanda.
The data presented in Table 7.9 seem to confirm that pilchard undertakes northward seasonal migrations towards the Cunene-Tombua shelf in August.
All three Namibian May-June surveys showed a distribution of pilchard south of Walvis Bay and it seems likely that these north-south migrations affect the whole stock as observed before the collapse of the stock (Agenbag, 1980).
An inspection of the distribution charts in sequence gives the impression that a higher proportion of the pilchard is found in the north over the survey period. It should also be noted that the stock as a whole tended to be found progressively more inshore, perhaps an effect of the narrow shelf from Cape Frio (18°30'S) northwards.
Biomass estimates
Biomass estimates were based on target strength for pilchard assumed to be similar to that of the North Sea herring. From survey 2/91 on a change was made in the assumption of the condition factor for the pilchard necessitating a reduction of 25% in the biomass estimates reported from previous surveys. Table 7.9 shows the time-series of the estimates.
Table 7.9 Biomass estimates of pilchard 1990–93 by areas and surveys. Data from Angola surveys included (1,000 t)
| Season | Survey | Angola | Namibia | Total | Namibia (S) | |
|---|---|---|---|---|---|---|
| Tombua-Cunene | Cunene-Ambros Bay | Ambros Bay-Easter Point | Tombua-Easter Point | Panther Head-Orange River | ||
| Feb-Mar | N1/90 | n.s. | 120 | 60 | 180 | |
| N1/91 | n.s. | 200 | 400 | (600) | ||
| N1/93 | 45 | 325 | 0 | 370 | ||
| May-Jun | A1/91 | 26 | (560) | |||
| N2/90 | 360 | 200 | 575 | |||
| N1/92 | 45 | 510 | 20 | 361 | 197 | |
| N2/93 | 98 | 253 | 10 | |||
| Aug | A2/91 | 130 | n.s. | n.s. | ||
| A1/92 | 210 | n.s. | n.s. | |||
| Nov-Dec | N2/91 | 120 | 513 | 88 | 721 | |
| N2/92 | n.s. | 300 | 150 | (450) | ||
| Mean of surveys | 323 | 116 | ||||
| n.s.: no survey | ||||||
The low estimate from the first survey is thought to have been caused by a lack of awareness, at that time, of the periodic inshore distribution of pilchard in the Cape Frio area. Otherwise the estimates show that the standing stock of pilchard remained at a level of 600,000–700,000 t from 1990 through 1992. Early 1993 there is a sudden decline to about half the previous level. It is assumed that the 197,000 t of juvenile pilchard (modal length 11 cm) found near the border to South Africa between Panther Head and Orange River in survey 2/93 would not represent recruits to the Namibian stock.
The size compositions from the trawl samples pooled by areas usually showed one or a few distinct modal groups. However, it is uncertain whether a representative size sampling was achieved. Table 7.10 shows modal lengths by areas over the survey period. On the Tombua-Cunene shelf only adult large sized pilchard was found. In the Cunene-Ambros Bay area which accounted for the largest part of the biomass, young pilchard of 15–17 cm was commonly found together with medium sized, 19–21 cm, and some times larger specimens. This seems to have been the main feeding area. Another conclusion which may be drawn from a review of the distribution of modal groups over the period is that the pilchard stock in this period was not dominated by one or a few strong year classes. Recruitment seems to have occurred over most of the survey period at roughly the same level.
The observed decline of the pilchard stock coincided with a northward shift of its distribution. A possible explanation may be found in the structure of the original Namibian pilchard stock. As a whole it may have represented a super-population consisting of several partly mixing sub-populations arranged along the coast. Stocks in the central area would be more vulnerable to fishing and to predation from the seal population. The natural predator prey relationship between the two populations has been distorted by the collapse of the pilchard stock and at its recent low level the stock was not sustainable.
Table 7.10 Modal lengths in pooled samples of pilchard by survey, sub-areas and season. Main modes underlined
| Season | Survey | Angola | Namibia | Namibia (S) | |
|---|---|---|---|---|---|
| Tombua-Cunene | Cunene-Ambros Bay | Ambros Bay-Easter Point | Panther Head Orange River | ||
| Feb-Mar | N1/91 | 15, 24 | 14, 23 | ||
| N1/93 | 26 | 16, 19 | 15, 20 | ||
| May-Jun | N2/90 | n.s. | 20 | 22 | |
| N1/92 | 20, 23 | 15, 21 | 10, 24 | ||
| N2/93 | 23 | 15, 20 | 21 | 11 | |
| Nov-Dec | N2/91 | 25 | 17, 23 | 23 | |
| N2/92 | 16 | 21 | |||
| n.s.: no survey | |||||
Anchovy and round herring
In larval surveys in 1978/79 when the anchovy stock was still relatively abundant (Badenhorst and Boyd, 1980) the highest densities were found inshore and from Walvis Bay northwards. In acoustic surveys, Cruickshank (1983) found anchovy inside 100 m and more shallow than pilchard.
Figure 7.6 Distribution of anchovy and round herring in May-June 1992 (2/92)
After a decline in the early 1980s, there was a brief recovery of the anchovy stock and the fishery in 1987 and 1989 which has been related to the contemporary large increase in the abundance of South African anchovy. The stock again declined and the surveys show that it remained at a low level until 1993.
Anchovy and round herring were assessed together in six out of nine surveys. Figure 7.6 shows the distribution of the two species in the DR. FRIDTJOF NANSEN survey 2/92. The two species were found in the same inshore zone as the pilchard. In contrast with the pilchard, no northward shift of the anchovy and round herring stocks seems to have occurred.
The combined biomass estimates for anchovy and round herring are presented in Table 7.11. Based on the trawl samples, anchovy was twice as abundant as round herring. The mean total biomass for all surveys in Namibia is 184,000 t with 124,000 t anchovy and 60,000 t round herring. There was little variation in the standing stock biomass estimates over the survey period apart from the low estimate of survey 2/92, thought to have been caused by inadequate survey coverage.
Table 7.11 Anchovy and round herring: Combined biomass estimates by season, survey and area (1,000 t)
| Season | Survey | Angola | Namibia | Total | Namibia (S) | |
|---|---|---|---|---|---|---|
| Tombua-Cunene | Cunene-Ambros Bay | Ambros Bay-Easter Point | Tombua-Easter Point | Panther Head Orange River | ||
| Feb-Mar | 1/90 | n.s. | 90 | 125 | 215 | |
| 1/91 | n.s. | 10 | 125 | 135 | ||
| 1/93 | 0 | 150 | 185 | 335 | ||
| May-Jun | 2/90 | n.s. | 70 | 115 | 185 | |
| 1/92 | 5 | 100 | 75 | 180 | ||
| 2/93 | 6 | 76 | 72 | 154 | 84 | |
| Nov-Dec | 2/91 | 70 | 242 | 0 | 312 | |
| 2/92 | n.s. | 27 | 5 | 32 | ||
| Mean | 96 | 88 | ||||
| n.s.: no survey | ||||||
Cape horse mackerel
In a survey between Walvis Bay and Cunene, Olivar and Rubiés (1983) found eggs and larvae of horse mackerel only north of 22°S (Cape Cross), with the highest concentrations offshore over depths of 200–300 m. This also represents the main distributional area of adult horse mackerel in Namibia.
The inshore distribution area of young horse mackerel overlaps with that of pilchard and anchovy and this was covered in all of DR. FRIDTJOF NANSEN's pelagic surveys, while the middle and outer shelf off the central and northern regions were covered in four of the surveys: 1/90, 2/90, 2/91 and 1/92. Because horse mackerel was only a secondary objective of these investigations, sampling intensities on the outer shelf were not high and the precision of the estimates may be low. There may also be a bias because of lack of coverage of the shelf edge and the slope.
Figure 7.7 Distribution of horse mackerel in surveys 2/90 (left) and 1/92 (right)
Figure 7.7 shows the distribution in surveys 2/90 and 1/92. The central region was well covered in 1990, but had low survey intensities in 1991 and 1992. These last surveys included the Angolan shelf from Tombua to Cunene, which is the northern boundary of the Cape horse mackerel. In several of the surveys the seaward limits of the distribution were not well defined in various locations.
In most cases the inshore high densities represented juvenile horse mackerel which tended to form dense day-time schools. The adult fish usually formed looser aggregations during the day often near the bottom or at middle depths, and dispersed in upper water layers during the night. Surface schools might be formed in the morning. These characteristics of behaviour determine the catchability of these fish by different gears. Juvenile horse mackerel is fished with purse-seines, and the adult fish by trawl. Offshore purse-seining has not been developed in Namibia although this is a common fishing method for horse mackerels in other parts of the world.
Measurements of swim bladder volumes from the early surveys indicated that horse mackerel might have a lower acoustic target strength than clupeids, but subsequent in situ observations did not confirm this. Therefore, also in this case the target strength used for North Sea herring was assumed in the biomass estimates, combined with a condition factor of 0.85.
Table 7.12 shows the biomass estimates with totals ranging from 1.2 to 2.1 million t. The data by sub-areas seem to demonstrate a northward displacement of the biomass, but the course tracks of the 1991 and 1992 surveys show an inadequate coverage of the central offshore shelf and the 1990 surveys did not include southern Angola. It may be concluded that the mean biomass in the survey period probably exceeded 2 million t.
Table 7.12 Biomass estimates of Cape horse mackerel by season, survey and area (1,000 t)
| Season | Survey | Angola | Namibia | Total | |
|---|---|---|---|---|---|
| Tombua-Cunene | Cunene-Ambros Bay | Ambros Bay-Easter Point | |||
| Feb-Mar | 1/90 | n.s. | 560 | 660 | (1,220) |
| May-Jun | 2/90 | n.s. | 340 | 1,360 | (1,700) |
| 1/92 | 700 | 1,400 | 0 | 2,100 | |
| Nov-Dec | 2/91 | 340 | 1,100 | 0 | 1,440 |
| Mean of surveys | 850 | 505 | |||
| n.s.: no survey | |||||
Summary of biomass estimates and densities of small pelagic fish
It is of interest to consider the mean standing biomass of the various stocks over the period of the surveys and their densities by shelf area and coastline length. Table 7.13 provides a summary of these data.
Table 7.13 Small pelagic fish: rough estimates of standing biomass (mean of survey results) by species; means of annual landings (1,000 t) and derived densities in t per nmi2 and t/nmi of coast line
| Cunene-Ambros Bay | Ambros Bay-Easter Point | Total area | Mean landings | |
|---|---|---|---|---|
| Shelf area (nmi2) | 7,400 | 10,900 | 18,300 | |
| Coast length (nmi) | 250 | 250 | 500 | |
| Species groups: | ||||
| Pilchard | 323 | 116 | 439 | 100 |
| Anchovy and | ||||
| round herring | 96 | 88 | 184 | 50 |
| Horse mackerel | 850 | 505 | 1,355 | 300 |
| Total pelagics | 1,269 | 709 | 1,978 | 450 |
| Density (t/nmi2) | 171 | 65 | 108 | (25) |
| Density (t/nmi coastline) | 5,076 | 2,836 | 3,956 | (900) |
The density of small pelagic fish measured per unit shelf area was almost three times higher in the northern than in the central region. Measured by length of coastline it was nearly twice as high.
The densities observed in the 1986, 1989 and 1992 DR. FRIDTJOF NANSEN surveys of the corresponding shelf of perennial upwelling in the Canary Current system, the coast from Cape Bojador to Cape Blanc (Chapter 6) were 295 t/nmi2 of shelf and 12,500 t per n.mile of coastline. Comparable densities in Namibia were about 60% lower per unit shelf and unit coastline. It seems likely that sardine, that dominates in northwest Africa, is placed lower in the food chain than the horse mackerel and is a more efficient utilizer of biological production. Therefore the productivity of small pelagic fish in Namibia may have been considerably higher than the present level prior to the depletion of the pilchard stock.
Survey effort
The effort in the eight trawl surveys during 1990 to 1993 (see Table 7.7) to study the demersal resources was high (Table 7.14) and provided sets of very comprehensive data on the composition, distribution and abundance of most of the commercial bottom fishes of the shelf and slope. All catches were sampled to species level by weight and numbers, and biological sampling was made of commercially important stocks. The NAN-SIS databank was used for storing and processing all data.
The two species of hake (Merluccius capensis and M. paradoxus) were the primary objective and since these species do not occur inside 100–120 m depth off Namibia except in the extreme south, the nearshore grounds were not surveyed.
Table 7.14 Effort in Namibian hake surveys 1990–93. Swept-area fishing stations, number of samples (mostly by sex) and number of specimens measured, in thousands
| Survey | Orange River-St. Francis | St. Francis-Ambrose Bay | Ambrose Bay-Cunene | Total Namibia | ||
|---|---|---|---|---|---|---|
| I | 1/90 | No. of stations | 59 | 73 | 37 | 169 |
| 25/1–10/3 | No. of samples | 37 | 73 | 25 | 114 | |
| No. measured | 6.0 | 10.7 | 2.6 | 18.6 | ||
| III | 3/90 | No. of stations | 44 | 51 | 34 | 129 |
| 11/9–6/10 | No. of samples | 68 | 106 | 77 | 251 | |
| No. measured | 9.3 | 10.3 | 5.6 | 25.2 | ||
| IV | 1/91 | No. of stations | 41 | 77 | 56 | 174 |
| 25/1–28/2 | No. of samples | 104 | 170 | 114 | 388 | |
| No. measured | 6.8 | 13.3 | 6.9 | 27.0 | ||
| V | 2/91 | No. of stations | 52 | 69 | 49 | 170 |
| 23/10–21/11 | No. of samples | 110 | 132 | 110 | 352 | |
| No. measured | 7.1 | 14.3 | 9.6 | 31.0 | ||
| VI | 1/92 | No. of stations | 57 | 60 | 47 | 164 |
| 23/4–21/5 | No. of samples | 136 | 141 | 102 | 379 | |
| No. measured | 9.0 | 11.2 | 8.2 | 28.4 | ||
| VII | 2/92 | No. of stations | 64 | 78 | 50 | 192 |
| 20/10–1/12 | No. of samples | 188 | 169 | 143 | 500 | |
| No. measured | 13.1 | 13.4 | 7.8 | 34.3 | ||
| VIII | 1/93 | No. of stations | 72 | 56 | 56 | 184 |
| 20/1–25/2 | No. of samples | 197 | 162 | 118 | 477 | |
| No. measured | 12.7 | 11.9 | 7.6 | 32.2 | ||
| IX | 2/93 | No. of stations | 61 | 78 | 69 | 208 |
| 22/4–25/5 | No. of samples | 173 | 202 | 163 | 538 | |
| No. measured | 10.8 | 13.9 | 10.2 | 34.9 |
Problems of methods in the hake surveys
Early estimates of the Namibian hake stocks were made by acoustic methods (Cushing, 1968), while ICSEAF survey assessments were by the swept-area method.
The survey design was a semi-random allocation of stations along course tracks which covered the distributions from their eastern shallow to the western deep limit at 500–600 m. Post-stratification by densities was used for biomass estimates of Cape hake. The validity of this method is discussed in Chapter 2. With the increased effort towards the end of the period, the precision of the biomass estimates was generally high, 11–14% (95% confidence limits).
Sources of bias probably represented more serious problems. Assumptions regarding the effective fishing width and height of the trawl and the distance of towing are critical for the accuracy of the estimates.
In survey 3/90 observations were made with SCANMAR™ instrumentation of headline height and distance between wings of the type of bottom trawl used by the vessel in the Namibian surveys (Table 7.15).
Table 7.15 Observations of headline height and distance between wing tips during trawling. Means of 4–6 observations (m)
| Section No. | Bottom depth (m) | Distance of wing tips | Headline height |
|---|---|---|---|
| 360 | 173 | 20.3 | 5.5 |
| 367 | 165 | 19.4 | 5.4 |
| 397 | 202 | 18.9 | 5.7 |
| 455 | 253 | 16.5 | 4.8 |
| 464 | 322 | 18.9 | 5.3 |
| 500 | 150 | 17.5 | 6.2 |
The positions of the wing sensors were slightly more forward on stations 360 and 367 than in the following experiments. The experiments at stations 455, 464 and 500 were performed with a different net of the same design. The low values obtained at station 455 may have been caused by a catch of jellyfish which is expected to have resulted in heavy drag of the net due to clogging. The overall mean of the observations of distance is very close to the value used in the swept-area estimates of 1/100 nmi or 18.6 m. The SCANMAR measurements indicated that in normal hauls the distance may be somewhat greater, and perhaps lower when by-catches of jellyfish occur.
Following these measurements and perhaps not entirely justified, no change was made in the assumption that 18.6 m was the effective fishing width of the trawl for all species and fish sizes. In addition to the reduced wing-spread of hauls with jellyfish, it was realized that clogging of the meshes by jellyfish would also reduce the fishing power resulting in a trend of underestimation because of low catch rates in seasons of high abundance of jellyfish.
The trawl gear was not instrumented for bottom contact and the start of the 30 min (exceptionally 60 min) tows was determined by the fishing master who estimated the interval after shooting needed to reach the bottom. Instrumented tows with the new vessel have indicated that the time allowed for the trawl to sink to the bottom may have been consistantly underestimated, which again would result in an underestimate of the biomass.
However, the most important source of bias in the biomass estimates of the hakes based on swept-area calculations relates to their mid-water occurrence. Hakes are often described as mid-water feeders with swarms of krill, mysids and various pelagic fish as their main food source. In Namibia, gobies, myctophids and horse mackerel are important potential food sources in mid-water in addition to the krill.
The general experience of hake behaviour over the survey period was that it varies with size and age of the fish and with depth. The 1–2 year Cape hake of 20–30 cm length, found in highest concentrations in the 180–250 m depth range, often stayed very close to the bottom during the day, but regularly lifted during the night and formed well defined single fish layers. In southern Namibia, near the Orange River, this group was found close inshore, at 70–110 m depth, a difference in behaviour which is probably related to different environmental conditions. With sampling restricted to daylight hauls the 1–2 group hake will be well covered.
With increasing size, above 30–35 cm and age 3–4 years, the Cape hake moves into deeper water, 250–300 m, where it mixes with larger fish. At higher ages, hake is found on the slope, from 300 m to more than 400 m. At these depths it was frequently observed in mid-water also during the day. There were, however, special difficulties in observing and measuring the density of hake at these depth ranges, primarily because it was found together with other organisms which appeared as spurious scattering layers in the echograms. To distinguish hake traces, in dense layers of crustaceans or myctophids in mid-water or in layers of other fish such as blackbelly rosefish or Jacobever (Helicolenus dactylopterus) or greeneyes (Chlorophthalmus atlanticus) nearer the bottom, was often difficult and a separation for density estimations was at times not possible.
Acoustic estimates of the pelagic hake by areas or depth ranges were not attempted, but a procedure was developed to compensate for the occurence of hake in mid-water, above the headline of the trawl. The density obtained from trawl hauls was adjusted by simple adding the mean acoustic density observed in this mid-water layer during the tow to the trawl estimate. A target strength similar to that used for cod was applied: TS = 20 logL - 68.
A considerable change in the behaviour was already observed in the first surveys. In survey 1/90, mid-water occurrence of the hake was expected and attempts were made to observe it, but significant amounts were only recorded in mid-water in some areas at night. Then the swept-area estimates were considered to be reliable. A few months later, in survey 3/90, hake was only found to be distributed in mid-water both day and night in the north from Ambrose Bay to Cunene. Attempts were made to estimate the densities by acoustic methods. These indicated that the swept-area method would result in a considerable underestimate, perhaps as much as 100%.
The SIMRAD™ EK 500 acoustic system installed in the vessel in January 1991, provided a better tool for observations and estimates of the density of hake in mid-water. Figure 7.8 shows an example of an echogram of hake above the bottom recorded with this equipment during trawling in daytime.
Table 7.16 shows the level of the adjustments which were made in the surveys from 1991 onwards, in an attempt to include the biomass of the pelagic hake. Survey 1/91 stands out with very high correction factors indicating that a very high proportion of the Cape hake biomass was found in mid-water. In general there was a tendency for the northern region to have the highest incidence (% occurrence in the trawl hauls) and correction factors. This is the area with the highest proportion of large-sized Cape hake. There seemed to be no clear seasonal trend except perhaps lower spring (Oct-Dec) than summer (Jan-Feb) values. Adult deep-water hake in the south was seldom found in mid-water.
Stock evaluation of semi-demersal fish by a combination of swept-area trawl surveys and acoustics has been approached in different ways by researchers. For walley pollock in the Eastern Bering Sea independent surveys were developed using the two techniques (Karp and Walters, 1994) with a qualitative comparison of the results considering their respective biases rather than a combined assessment. For cod and haddock in the Barents Sea a simultaneous twin-method survey system has been developed (Korsbrekke et al., 1995) which provides two comparable indices.
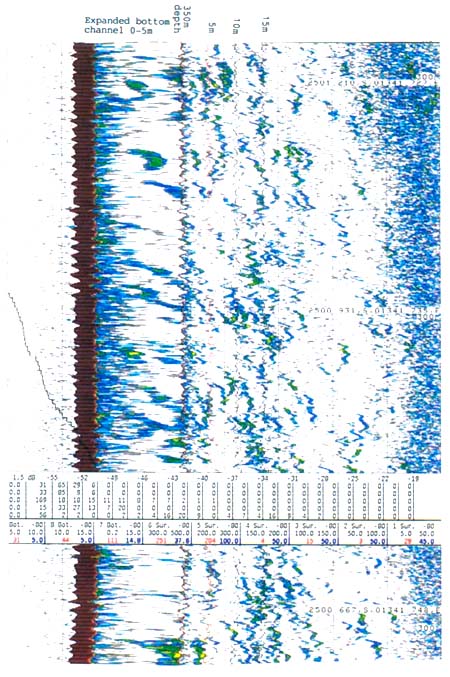
Figure 7.8 Echogram showing traces of hake off the bottom during trawling in daytime. Bottom depth 350 m. Lines indicate distance from bottom: 5 m, 10 m, 20 m
Table 7.16 Mean correction of swept-area densities by acoustic estimates of pelagic hake during towing and incidence of stations with corrections, 1991–93 by surveys and regions. Day-time observations only (%, incidence in brackets)
| Region | Orange River- St. Francis Bay 28°38' - 25°30' | St. Francis Bay- Ambrose Bay 25°30' - 21°00' | Ambrose Bay- Cunene River 21°00' - 17°15' | |||||
|---|---|---|---|---|---|---|---|---|
| Survey | ||||||||
| IV | 1/91 | Jan-Feb | 59 | (48) | 67 | (43) | 185 | (84) |
| V | 2/91 | Nov-Dec | 0 | 0 | 17 | (41) | ||
| VI | 1/92 | Apr-May | 4 | (12) | 2 | (9) | 9 | (28) |
| VII | 2/92 | Oct-Nov | 9 | (22) | 5 | (36) | 10 | (42) |
| VIII | 1/93 | Jan-Feb | 5 | (29) | 6 | (40) | 23 | (65) |
| IX | 2/93 | Apr-May | 10 | (15) | 6 | (19) | 30 | (42) |
Undoubtedly, it would be an advantage to have more comprehensive information on the mid-water occurrence of the hake in Namibia. There would seem to be no special difficulties in developing acoustic surveys for juvenile hake using night-time observations, but for adult Cape hake on the outer shelf and slope, effective acoustic density measurements covering the region would need adoption of a technique that could overcome the problem of the masking of hake echoes by the often dense scattering layers from other organisms.
The simple approach of adding mean acoustic density for each trawl haul to the trawl estimate undoubtedly improves the accuracy of the total estimate, but the few observations made may not be representative of the fish behaviour over larger areas and the masking problem may introduce a bias. If the fish remaining near the bottom would form a constant proportion of the total stock, the swept-area measure would be a valid index of stock changes, but the variation between surveys as shown in Table 7.16 indicates that this is not the case. It may, perhaps, be concluded that the present approach has made the best use of the available data pending further technical advances.
Distribution of the hakes
O-group Cape hake of about 10 cm could be detected in the surveys in the early part of the year. At this stage they did not have a wide continuous distribution, but were in daytime for the most part found in restricted locations along the coast in dense patches at depths of 120– 150 m mainly in mid-water. This group was not a target of the surveys.
Juvenile Cape hake of 1.5–2 years with a size of 20–25 cm was found over wide parts of the shelf in relatively shallow water, 130–200 m, sometimes at very high densities. The areas of high abundance of this group were especially extensive in the Central Region, from St. Francis Bay to Ambrose Bay, while near the Orange River it was found closer to the coast.
With increasing size the Cape hake was found at greater depth, with the 30–40 cm fish still mainly over the middle part of the shelf, and the larger fish near the shelf edge and the slope down to about 500 m.
Figure 7.9 Distribution of Cape hake from swept-area densities, survey 1/90
Figure 7.10 Distribution of Cape hake from swept-area densities, survey 1/92
Figure 7.11 Distribution of deep-water hake in the southern region, survey 1/92
Figure 7.9 shows the Cape hake distribution by regions as found in the first survey (1/90). The basis for this chart is formed by the swept-area estimates with post-stratification by arbitrary density levels. The areas with high densities were juvenile fish, 20–25 cm in the Central Region and somewhat larger fish, 25–30 cm in the Northern region.
Figure 7.10 shows the distribution of Cape hake found in survey 1/92. The general picture was similar to that from 1990, but in addition to areas of high density of juvenile fish in the shallow part of the Central Region, patches and larger areas of high density of large-sized fish were now found in all three regions.
As expected, the distribution of the deep-water hake was found to be very different from that of the Cape hake. Juveniles, of 20–30 cm were found on the outer shelf and upper slope, 200–300 m and the adults mainly from 300–600 m. Figure 7.11 shows post-stratified densities from survey 1/92 from the Southern Region when this species had the highest densities measured in all Namibian surveys. At its central depth of distribution, 400–500 m, deep-water hake was found all along the slope northward to Cunene.
The general characteristics of the distribution of the two hake species as shown in Figures 7.9, 7.10 and 7.11 were confirmed in each of the surveys, but with deviations. For the Cape hake deviations were caused by variations in recruitment which appeared as changes in the extent of the high density aggregations of small-sized fish inshore, especially in the Central Region. Recruitment variations are analysed separately below.
There was also a trend of increased density at greater depth for the Cape hake with time in all regions as shown by Table 7.17, most pronounced from 1990 to 1991, but which also continued from 1991 to 1992. There was also a difference in the depth distribution of the Cape hake by regions with increasing densities at greater depths northwards.
Table 7.17 Cape hake: Mean densities by depth range, survey and region (t/nmi2)
| Depth range | 100–250 m | 250–350 m | 350–450 m | 450–550 m |
|---|---|---|---|---|
| Southern region | ||||
| 1/90 | 21.9 | 4.4 | ||
| 1/91 | 11.3 | 8.8 | 0.9 | |
| 2/91 | 6.3 | 12.5 | 0.7 | 0.7 |
| 1/92 | 12.6 | 28.4 | 4.6 | |
| 2/92 | 11.6 | 12.2 | 1.1 | 0.2 |
| 1/93 | 14.2 | 25.7 | 7.2 | 0.3 |
| 2/93 | 11.0 | 18.2 | 4.7 | |
| Central region | ||||
| 1/90 | 27.1 | 7.4 | 0.4 | |
| 1/91 | 14.5 | 9.1 | 2.2 | |
| 2/91 | 34.2 | 19.0 | 7.2 | 1.0 |
| 1/92 | 36.5 | 14.6 | 8.5 | 1.7 |
| 2/92 | 53.6 | 20.1 | 10.5 | 0.8 |
| 1/93 | 34.1 | 9.5 | 8.9 | 0.3 |
| 2/93 | 34.4 | 23.8 | 4.6 | 0.6 |
| Northern region | ||||
| 1/90 | 41.3 | 20.9 | 1.0 | |
| 1/91 | 15.0 | 27.0 | 11.5 | |
| 2/91 | 13.6 | 23.5 | 24.3 | 4.3 |
| 1/92 | 25.4 | 26.1 | 15.5 | |
| 2/92 | 29.6 | 18.6 | 17.6 | |
| 1/93 | 13.7 | 23.2 | 14.7 | 2.8 |
| 2/93 | 9.3 | 16.5 | 12.8 | 2.3 |
Changes in the distribution of adult Cape hake among regions were also observed and these were interpreted as migrations. This is evident from an examination of the distribution charts, but can more easily be demonstrated by an analysis of the fishable biomass estimated for each region through the surveys. As shown in Table 7.18 the proportion of fishable biomass was as an average of all surveys 24%, 34% and 42% for the Southern, Central and Northern Regions respectively. But there were variations between the surveys. A seasonal shift from the Northern to the Central Region in the spring was observed, probably the effect of spawning migrations. There also appears to have been a decrease in the proportion in the Northern Region over the period. The distribution of the fishery in the period, predominantly in the northern half of the coast, must have affected that of the biomass.
Table 7.18 Cape hake: Distribution of fishable biomass by region, season and survey and total biomass
| Season | Survey | Southern region % | Central region % | Northern region % | Fishable biomass 1,000 t |
|---|---|---|---|---|---|
| Jan-Mar | 1/90 | 19 | 19 | 62 | 106 |
| 1/91 | 19 | 23 | 58 | 291 | |
| 1/93 | 28 | 40 | 32 | 331 | |
| Apr-Jun | 1/92 | 36 | 27 | 37 | 398 |
| 2/93 | 32 | 39 | 29 | 309 | |
| Oct-Nov | 2/91 | 15 | 44 | 41 | 331 |
| 2/92 | 18 | 47 | 35 | 382 | |
| Mean | All | 24 | 34 | 42 |
A very different picture is shown by the analysis of the distribution by regions of the nonfishable biomass, defined as fish below 36 cm length corresponding approximately to the 50% selection length of an 110 mm mesh (Table 7.19). This biomass will be dominated by the 1.5– 3 year old juvenile fish affected by recruitment variation, and the central region with a mean of about 58% clearly held the main nursery grounds, followed by the southern region with 27%. It can only be speculated whether or not the juvenile fish found inshore near the Orange River, such as in survey 1/90, would recruit to the Namibian stock of Cape hake or migrate south of the border. Generally the highest amount of juvenile fish was found in the central region, but in some surveys their distribution also extended into the northern region. In survey 1/91 and in 1993 the distribution was central and south. These changes may be related to environmental factors.
Table 7.19 Cape hake: Distribution of the non-fishable biomass by region, season and survey and total biomass
| Season | Survey | Southern region % | Central region % | Northern region % | Non-fishable biomass 1,000 t |
|---|---|---|---|---|---|
| Jan-Mar | 1/90 | 25 | 40 | 35 | 391 |
| 1/91 | 41 | 45 | 14 | 179 | |
| 1/93 | 40 | 47 | 13 | 323 | |
| Apr-Jun | 1/92 | 19 | 63 | 18 | 250 |
| 2/93 | 31 | 61 | 8 | 259 | |
| Oct-Nov | 2/91 | 17 | 80 | 3 | 202 |
| 2/92 | 18 | 69 | 13 | 510 | |
| Mean | All | 27 | 58 | 15 |
Depth distribution of juvenile Cape hake
The size-dependent depth distribution of Cape hake facilitates the use of fishery protection zones to assist in obtaining a suitable minimum fishing size in the trawl fishery. An analysis based on data from the four first hake surveys during 1990–91, was presented to the Namibian authorities in late 1991 (IMR, 1991d).
The distribution by density strata were used to estimate the total biomass inside and outside two selected isobaths, 200 m and 250 m in each region. Figure 7.12 shows, as an example, the chart for the Central Region in survey 2/91. The proportion of juvenile (< 35 cm) and of adult fish (> 34cm) was estimated from the size compositions by length converted to weight.
Figure 7.12 Cape hake: Distribution in the central region in survey 2/91
Table 7.20 shows the results of this analysis. The figures for adult fish (survey 3/90 in the Northern region) were put in brackets because an unknown quantity of hake observed, but not quantified in mid-water, could not be included.
In the first two surveys a relatively high proportion of the adult stock, 40 to 70% was found inside the 200 and 250 m isobaths in the northern and central regions. Because of depletion by the previous fishery there was little middle-sized hake and no large-sized hake in 1990. The proportion was much smaller in the last two surveys. In most surveys the larger part of the juvenile stock was found inside the 200 m line and about 70–90% inside 250 m.
Table 7.20 Cape hake: Estimates of proportions of adult and juvenile biomass inside the 200 m and 250 m depth lines* by regions and surveys (%)
| Depth range | Inside 200 m | Inside 250 m | ||
|---|---|---|---|---|
| Northern region | Adult | Juvenile | Adult | Juvenile |
| Survey 1/90 | 56 | 60 | 72 | 92 |
| Survey 3/90 | (16) | 55 | (51) | 89 |
| Survey 1/91 | 6 | 19 | 23 | 67 |
| Survey 2/91 | 2 | 67 | 16 | 83 |
| Central region | ||||
| Survey 1/90 | 43 | 80 | 43 | 95 |
| Survey 3/90 | 53 | 58 | 71 | 89 |
| Survey 1/91 | 14 | 52 | 22 | 74 |
| Survey 2/91 | 16 | 88 | 30 | 98 |
| Southern region | ||||
| Survey 1/90 | 9 | 71 | 22 | 87 |
| Survey 3/90 | 9 | 26 | 33 | 56 |
| Survey 1/91 | 8 | 36 | 23 | 85 |
| Survey 2/91 | 7 | 47 | 33 | 74 |
| * Inside 150 m south of Panther Head, 28°S | ||||
The mean proportions weighted by the corresponding biomass would give the most representative relationships. These were as follows:
| Inside 200 m | Inside 250 m | |||
| Adult | Juvenile | Adult | Juvenile | |
| Mean, all regions, all surveys | 15% | 62% | 33% | 87% |
| Mean, all regions, survey 2/91 | 9% | 80% | 25% | 93% |
It seems reasonable to conclude that over the period covered by these surveys, more than 60% of the juvenile stock was distributed inside 200 m of depth and nearly 90% inside 250 m. With the perhaps more normal composition of the stock components which existed in survey 2/91 these proportions were even higher, 80% and 93% respectively. Only small proportions of the adult stock, about one-third was found shallower than 250 m during the period and only a quarter in the last survey.
Biomass estimates of Cape hake
From the discussion of the methods of the swept-area surveys under 7.1.4 above it is concluded that estimates of biomass represent indices of the standing stock which may have been biased in various ways. The estimates are in the following referred to as biomass, but this reservation should be kept in mind.
Table 7.21 shows the estimates of biomass by regions and surveys and split into non-fishable and fishable parts at the defined minimum fishable size of 36 cm of total length. The estimate for the northern region in survey 3/90 was incomplete due to an unknown amount of hake in mid-water.
Table 7.21 Cape hake: Summary of adjusted estimated of biomass by surveys and regions (1,000 t)
| 1990 Feb-Mar | 1990 Sep-Oct | 1991 Jan-Feb | 1991 Oct-Nov | 1992 Apr-May | 1992 Oct-Nov | 1993 Jan-Feb | 1993 Apr-May | |
|---|---|---|---|---|---|---|---|---|
| Northern region | ||||||||
| Non-fishable | 137 | 54* | 25 | 6 | 45 | 66 | 41 | 21 |
| Fishable | 66 | 62* | 170 | 134 | 145 | 133 | 106 | 89 |
| Central region | ||||||||
| Non-Fishable | 156 | 126 | 80 | 162 | 157 | 350 | 152 | 158 |
| Fishable | 20 | 76 | 67 | 147 | 108 | 180 | 133 | 121 |
| Southern region | ||||||||
| Non-fishable | 98 | 98 | 74 | 34 | 48 | 94 | 130 | 80 |
| Fishable | 20 | 44 | 54 | 50 | 145 | 69 | 92 | 99 |
| Total | ||||||||
| Non-fishable | 391 | (278) | 179 | 202 | 250 | 510 | 323 | 259 |
| Fishable | 106 | (182) | 291 | 331 | 398 | 382 | 331 | 309 |
| Grand total | 497 | (460) | 470 | 533 | 648 | 892 | 654 | 568 |
* unadjusted underestimate due to fish off the bottom
Figure 7.13 Cape hake: Estimates of fishable biomass in 1990–93
Figure 7.14 Jakobever: Estimates of mean density in the central and northern regions 1990–92
For the two first surveys the stock size compositions for each region were originally estimated from the size samples by simple adding, (IMR, 1990a and c). For the surveys from 1991 onwards, the size samples were weighted by the catch rates. In a recent revised processing of all the data the length frequency samples were weighted by the estimated density of the hake at the respective fishing stations including acoustic observations above the headline. The biomass estimates in Table 7.21 are based on these revised data. Compared with the original estimates they show considerably lower biomasses of fishable hake and higher biomasses of non-fishable hake in the 1990-surveys. There are only minor changes for the later surveys.
The fishable biomass of hake was only about 100,000 t at the start of the surveys in 1990 but it increased to about 400,000 t in 1992. The non-fishable biomass varied between 180,000 t in survey 1/91 and 510,000 in survey 2/92. The mean total biomass for all surveys over the period (except 3/90) was 608,000 t, of which about 50% was fishable.
In Figure 7.13 the estimates of fishable biomass of the Cape hake are shown on a time scale. The stock increased by about four times over the first two years, but the expansion then stopped and there was some decline in 1993.
It is important to see to what extent this history of the Cape hake stock over the period 1990– 93 can be explained in terms of changes in rate of exploitation and in recruitment.
Changes in the rate of exploitation
With the new management regime adopted by independent Namibia from 1990 on, the high rate of exploitation of the hake stocks which existed towards the end of the ICSEAF period was sharply reduced. Total annual reported landings of both species declined from about 300,000 t in 1987–89 to about 130,000 t in 1990, about 60,000 t in 1991 and then increased to about 100,000 t in 1992–93. Although there may be uncertainty about the amount of hake by-catch in the continued trawl fishery for horse mackerel, it seems reasonable to assume that the fishing mortality of hake was reduced by 2–3 times by the new regime. This represents a unique experiment in the history of management of fisheries on heavily exploited demersal stocks.
The fishery-dependent monitoring of the stocks organized through ICSEAF ceased in 1989, while resource survey programmes planned in the ICSEAF period were incomplete and of limited use for comparison and reference. The data from the DR. FRIDTJOF NANSEN surveys started in 1990 allowing a monitoring of the changes in the composition and abundance of the stock. However, because of the high variability in the recruitment of the Cape hake only a long time-series of survey data can be expected to show the effect of changes in the fishery on the stock.
Such effects may, however be traced in species appearing as a common by-catch in the hake fishery. The Jacobever (Helicolenus dactylopterus) is a common demersal species distributed between about 200 and 400 m depth along the whole Namibian shelf, but with increasing density northwards. In the central and northern regions its distribution is similar to that of adult hake. Mean catch rates in the surveys were 30–90 kg/h in the depth range 250–550 m in the northern region and about half that in the central region. It grows to a maximum size of 30 cm and it may be assumed that in the relatively stable environment of the deep shelf, variations in recruitment to the stock are not very great and the density of the population would then largely depend on fishing and natural mortality.
Table 7.22 Mean density of Jacobever (Helicolenus dactylopterus) from swept-area hauls by regions and surveys, 250–550 m depth (t/nmi2)
| Survey | 1/90 Feb-Mar | 3/90 Sep-Oct | 1/91 Jan-Feb | 2/91 Oct-Nov | 1/92 Apr-May | 2/92 Oct-Nov | 1/93 Jan-Feb | 2/93 Apr-Mar |
|---|---|---|---|---|---|---|---|---|
| Region | ||||||||
| Northern | 1.10 | 1.50 | 0.95 | 2.73 | 2.54 | 1.79 | 2.21 | 1.85 |
| Central | 0.34 | 0.33 | 0.29 | 0.67 | 1.06 | 1.24 | 1.61 | 1.11 |
| Southern | 0.19 | 0.17 | 0.37 | 0.34 | 0.32 | 0.33 | 0.30 | 0.38 |
Table 7.22 shows the mean density of Jacobever by surveys and regions for the depth range of main distribution beyond 250 m depth. There is an increase of densities in all regions, in the central and northern regions from end 1991. In Figure 7.14 the mean densities weighted by the numbers of stations for the central and northern regions are plotted on a time-scale. The first three observations represented the stock density as determined by the intensive hake fishery towards the end of the ICSEAF period. The fishing effort was greatly reduced after Namibia's independence, thus also the fishing mortality of the Jacobever by-catch. After some time a new equilibrium stock density was established reflecting the rate of hake fishing as managed by Namibia. The observed level of density in this later period is 2.4 times higher than that of the first period. This confirms that the regulation of the fishery by Namibia resulted in a significant reduction of fishing effort and indicates that this lower level was maintained at least into 1992. If further studies confirm that the Jakobever is a stable stock with little recruitment variation its density may be used in the future as an indicator of changes in the fishing mortality of the adult Cape hake.
A changed fishing pattern with reduced fishing on small-sized hake under the Namibian regime may also have contributed to the rapid recovery of the Cape hake stock after 1990. An even more important circumstance was the composition of the stock at the time of the change in management: a very high absolute abundance of juveniles which formed a high proportion of the stock. Out of a total stock abundance of about 500,000 t, 80% were below 36 cm length. This group then benefited from the reduction in fishing and probably had in addition an especially high survival and growth rate due to the low abundance of the adult stock.
However, the rapid increase of the adult stock ceased in 1992 and there was some decline in 1993 although the exploitation was maintained at a low or moderate level. A possible explanation for the decline is the low abundance of juveniles observed in the 1991 surveys.
These relationships indicate the great importance of the recruitment and its variation in the dynamics of the Cape hake. This type of life history with great apparently stochastic variations in recruitment is also well known from many gadoid stocks at high latitudes.
Summary of Cape hake stock history 1990–93
Cape hake had been heavily fished under the last years of the ICSEAF regime at the end of the 1980s, and Namibia's management regime started with an adult stock of only 100,000 t in 1990. The fishing effort on hake was drastically reduced, probably by 2–3 times under the new Namibian regime. This is reflected in the hake commercial catches and in the effects of the hake fishery on the stock of the by-catch species of Jacobever. Thus a reduced fishing mortality allowed two year-classes of juvenile fish, the 1988 year-class of medium abundance and the 1987 yearclass of probably high abundance to recruit to the fishable stock which increased its biomass from 1990 on reaching about 400,000 t in 1992. This rapid growth ceased, however, in 1992 and there was some decline in 1993.
Figure 7.15 Cape hake: Estimated size composition by weight of the stock, 1990–93
Figure 7.15 shows the estimated size composition by weight of the total Cape hake stock in this period. The gradual build-up of the adult stock is clearly shown. In 1990 there was hardly any fish above 40 cm, while in the two 1991 surveys there appeared a group of 40–60 cm fish, which increased to 50–70 cm fish in 1992 and even somewhat larger size in 1993, while in this year the abundance of this group evidently declined.
There are few data available on the fishery and the part of the standing stock caught is hardly known. It seems, however, fairly safe to conclude that from 1992 to 1993 the growth of the adult stock did not balance the rate of fishing, even though it was kept moderate as compared with the late ICSEAF period.
This break in the planned recovery of the Cape hake stock must then first of all be ascribed to failing recruitment. A review of the history of recruitment since the start of the fishery showed that high recruitment variation is a typical feature in the life history of the stock. The strength of the yearclasses 1988–91 was at a low level with a mean of 1,600 million fish and a range of 500–2,500 million, while in previous periods, 1968–74 and 1981–85 the mean yea-class strength was 4,000 million or more and the most abundant cohorts had more than 6,000 million fish. The probability of high recruitment may increase with the size of the spawning stock. That the spawning potential of the Cape hake stock in 1991 was sufficient to produce an abundant year-class is demonstrated by the estimate of the 1991 year-class of 4,300 million in the autumn survey of 1992 prior to its exposure to an abnormal mass mortality.
Recruitment thus plays an essential role in the dynamics of the Cape hake stock and information on recruitment on a current basis must form part of the vital stock data needed for management considerations.
Biomass estimates of deep-water hake
Juvenile and young deep-water hake may have been misidentified in the first surveys. But the biomass estimates for the adult stock were, as shown in Table 7.23, at a very low level during the first years and the possibly missing juvenile component cannot have been large. The increase was slower than in the Cape hake and the stock reached a level of about 150,000 tonnes in 1992–93. In this period the proportion of juvenile biomass of the total deep-water hake stock was 22% compared with 48% in the Cape hake. This low proportion and the distribution being largely limited to the southern region and extending southward into the Republic of South Africa indicates that the deep-water hake of Namibia is probably a shared stock. For the Cape hake with its juveniles in relatively shallow water, the Lüderitz upwelling-cell may form a southern boundary as assumed for the pelagic stocks, whereas there are no similar environmental barriers for the depth ranges of the deep-water hake.
The depth range of young deep-water hake overlaps that of adult Cape hake and predation may be main obstacle to the northward penetration of deep-water hake into the dense Cape hake regions.
For deep-water hake the mean proportions of non-fishable biomass by regions over the survey period were 85%, 11% and 4% for the southern, central and northern regions respectively.
Table 7.23 Deep-water hake: Summary of estimates of biomass by surveys and regions (1,000 t)
| 1990 Feb-Mar | 1990 Sep-Oct | 1991 Jan-Feb | 1991 Oct-Nov | 1992 Apr-May | 1992 Oct-Nov | 1993 Jan-Feb | 1993 Apr-May | |
|---|---|---|---|---|---|---|---|---|
| Northern region | ||||||||
| Non-fishable | 0 | 0 | 0 | 0 | 0 | |||
| Fishable | 2 | 4 | 8 | 4 | 6 | |||
| Central region | ||||||||
| Non-Fishable | 0 | 0 | 0 | 9 | 2 | 5 | 3 | 0 |
| Fishable | 4 | 5 | 6 | 6 | 13 | 12 | 13 | 1 |
| Southern region | ||||||||
| Non-fishable | 5 | 10 | 20 | 41 | 32 | 45 | 27 | 20 |
| Fishable | 16 | 20 | 14 | 42 | 113 | 80 | 123 | 95 |
| Total | ||||||||
| Non-fishable | 5 | 10 | 20 | 50 | 34 | 50 | 30 | 20 |
| Fishable | 20 | 25 | 20 | 50 | 130 | 100 | 140 | 102 |
![]()
![]()
![]()