


This section of the report discusses some of the changes which might be expected in the future in the availability of forest resources and the way in which they are managed. It discusses the future potential availability for wood production of natural forest, plantations and trees outside of forests. It then discusses the likely impact of SFM on future wood supplies. It finishes by synthesising the main implications of these changes on forest products markets.
Deforestation is a major force affecting the future availability of forest resources for wood supply both directly, through the total amount of forest in existence, and through the pressure it puts on forestry policy makers to take greater areas of forest out of wood production. After discussing deforestation in general terms, two specific demands on forest-land are discussed below: the conversion of forest land to agricultural uses and the placement of forests into legally protected areas.
Table 17 summarises the regional changes in forest cover estimated by FAO in 1995 on the basis of the 1990 Forest Resource Assessment. There is considerable variation between regions: South America has the highest level of deforestation in terms of area loss, while Africa has the greatest annual percentage loss of forest. In contrast, forest cover is actually increasing in Europe and the countries of the former USSR. Given that the forest area change is negative in all of the regions except one, deforestation can be expected to remain a prominent issue in the public policy debate over forests.
Table 17: Annual change in forest area by region estimated in 1995
Region |
Forest area |
Annual change (1990-95) | |
1,000 ha |
1,000 ha |
% | |
Africa |
520,237 |
-3,748 |
-0.7 |
Asia |
503,001 |
-2,901 |
-0.6 |
Oceania |
90,695 |
-91 |
-0.1 |
Europe |
933,326 |
+519 |
+0.0 |
North and Central America |
536,529 |
-274 |
-0.1 |
South America |
870,594 |
-4,774 |
-0.5 |
World |
3,454,382 |
-11,269 |
-0.3 |
Source: FAO (1999c)
There is evidence that the rate of deforestation might be declining in some areas. For example, forest plantation programmes in a few countries (e.g. India and China) are slowing the overall rates of deforestation in some regions. Recent research by the Center for International Forestry Research (CIFOR) in Latin America has also suggested that the conversion of forest to agricultural land there may be declining as small-scale farmers switch their attentions to secondary forest (or other wooded land) for the expansion of their agricultural holdings.
The complexity of land-use changes which are currently taking place around the world was highlighted in the recent APFSOS, where it was shown that a range of land-use changes have been taking place in the Asia-Pacific region over the last few decades. Overall, deforestation in the region appears to have been slowing somewhat due to afforestation programmes in some of the largest countries in the region (e.g. China, India and Indonesia). Furthermore, other more complex patters of change were found to be at work within the region. For example, Australia and New Zealand are expanding forest area at the expense of agricultural land, while China is expanding both agricultural land and forest area by cultivating previously unused land. Only some of the countries of Southeast Asia were found to be following the typically expected model of conversion of forest land to agriculture.
Perhaps the most revealing insight of the analysis was the finding that the process of gradual forest degradation is making it increasingly difficult to talk simply about deforestation. For example, in terms of natural forest, deforestation in Asia is still very high. However, with high rates of plantation establishment, total forest loss each year is much less. Furthermore, if forest is broadened to include other wooded land, the annual loss of forest and other wooded land each year is only about 20% of the figure for forest alone. This is because much of the forest lost each year still contains some trees and therefore, enters the other wooded land category.
Due to the complexity of the mechanisms encouraging deforestation and afforestation and the current uncertainty about the way in which they operate, it would probably be premature to suggest that, at the global scale, the rate of deforestation is increasing or declining. Therefore, the supply and demand projections presented earlier were made on the basis of an assumption that deforestation would continue in the future at roughly the same rates as in the past.
Deforestation is driven by a range of factors including: deliberate conversion to other land uses; overgrazing; overharvesting of wood or non-timber forest products; wood fuel collection; fire; and outbreaks of pests and diseases. Most of the deliberate conversion of forest areas to other land uses is probably accounted for by the conversion of forest land to agricultural uses. This is sometimes planned by the government (e.g. as in some cases in Indonesia) but is more often the result of shifting agriculture or overgrazing. Conversion to other uses such as opencast mining and reservoirs is also important in a few locations (e.g. Malaysia; Papua New Guinea; Nauru and New Caledonia).
There is no clear consensus about the extent to which deforestation is caused, directly or indirectly, by forest harvesting. Certainly, the forestry literature cites many examples of poor harvesting and over harvesting leading to negative environmental impacts around the world. Also, in a number of countries, industrial harvesting is generally recognised as a major cause of forest degradation, but rarely does harvesting alone lead to total loss of tree cover. Probably more important in facilitating permanent deforestation is the provision of infrastructure (roads, supply lines and communication facilities) associated with forest harvesting operations, which assists with the process of settling previously undisturbed forest areas and expanding the agricultural frontier.
Given that conversion of forest-land to agricultural uses is probably still the largest determinant of forest loss in tropical regions, it is useful to examine the likely pressures that demands for agricultural land will place on the world's forest resources in the future.
The last global appraisal of the future demand for agricultural land was completed by FAO in 1995 (Alexandratos, 1995). This showed that, in developing countries, future needs (to 2010) for greater agricultural production would be satisfied by two changes:
_ increased cropping of existing agricultural areas, partly through an expansion of irrigation, which would bring into production an additional 120 million ha of land which is currently left fallow each year; and
_ conversion of other types of land into agricultural land (about 90 million ha).
It was also predicted that the main areas of agricultural land expansion would be in Sub-Saharan Africa, Latin America and the Caribbean, with maybe a little expansion in East Asia.
Analysis of past land-use changes from the 1990 Tropical Forest Resource Assessment (FRA 90) suggested that about 85 million ha of forest in tropical countries might be converted to agriculture over the 20 years 1990 to 2010. This would suggest that conversion of forest land to agriculture might account for about 64 million ha over the period 1995 to 2010 or 70% of the requirement indicated by Alexandratos. However, it is also worth noting that this figure implies that the conversion of forest to agricultural land accounts for deforestation of about 4.3 million ha, or roughly 0.12%, per annum. This is only about one-third of the estimated total rate of global deforestation of 11 million ha/year, or 0.3% per annum.
Based on these observations, it could be assumed that the conversion of forest land to formal agriculture may account for about one third of future forest area losses in developing countries, much the same as in the past. However, conversion or degradation due to informal agriculture (i.e. shifting cultivation) may exert a greater pressure on forest resources than is implied here.
It should be noted that the above projections only apply to developing countries. Forest areas in North America and Japan have not changed by very much in recent years and have been increasing in many European countries, Australia and New Zealand. Increased agricultural productivity and measures to enhance the environment are likely to continue to encourage the afforestation of agricultural and other types of land in many of these countries.
It should also be noted that conversion of forest to agriculture may not necessarily lead to great reductions in potential wood supply. In places where large areas of forest have been converted to agriculture, the reduced supply of timber for local needs often results in the planting of trees outside of forests in hedgerows, shelterbelts and small farm wood lots. This can increase potential wood supplies from these types of resource dramatically, particularly where population is high. These sorts of changes, plus the trend towards afforestation of agricultural land in developed countries, could have the impact of increasing potential future wood supplies, although probably not for several decades.
Increased interest in environmental issues in the 1980's and 1990's is a global phenomenon which has affected nearly all countries in the world. Greater concern for the environment has affected the way in which forests are managed in many countries and has started to affect the markets for forest products as well. One of the ways in which it has started to affect the availability of forest resources for wood supply is by placing greater pressure on policymakers to take natural forest areas out of production.
Figure 5: Growth in the global area of legally protected areas 1900 - 1994
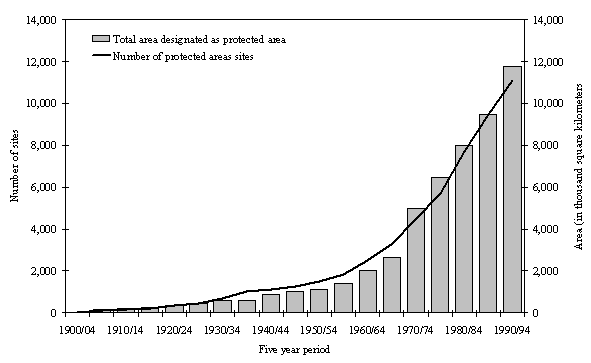
Source: WCMC
Figure 5 shows the growth in the number and total area of legally protected areas between 1900 and 1994.16 Historically, the number and area of protected areas has increased by around 8% each year. This has slowed down somewhat in recent years and annual growth in the area of legally protected areas is currently a little over 4% while growth in their number is about 3%. This amounts to an increase in the global area of legally protected areas of around 150 million ha to 200 million ha every year.
The area of forest within legally protected areas has recently been estimated by the World Conservation Monitoring Centre (WCMC) and CIFOR and is shown in Table 18. By comparing Figure 5 and Table 18, it can be seen that about one-quarter of the world's legally protected areas are forest areas. Furthermore, the total area of forest in legally protected areas is currently estimated to be just over 300 million ha or around 8% of the total forest area.
Table 18: Global area of forest17 and forest in protected area estimated in 1996
|
Region |
Forest area |
Forest in protected area |
|
|
1,000 ha |
1,000 ha |
% of total |
|
|
Africa |
568,313 |
49,693 |
8.7 |
|
Continental South and Southeast Asia |
170,768 |
19,246 |
11.3 |
|
Insular Southeast Asia |
146,836 |
24,750 |
16.9 |
|
Far East |
145,603 |
7,740 |
5.3 |
|
Middle East |
16,766 |
639 |
3.8 |
|
Australasia |
149,323 |
12,582 |
8.4 |
|
Europe |
181,400 |
14,483 |
8.0 |
|
Russian Federation |
825,716 |
15,064 |
1.8 |
|
North America |
845,399 |
69,996 |
8.3 |
|
Central America |
90,198 |
8,810 |
9.8 |
|
Caribbean |
5,385 |
790 |
14.7 |
|
South America |
842,946 |
87,492 |
10.4 |
|
World |
3,988,792 |
311,284 |
7.8 |
Source: WCMC/CIFOR (1998)
In addition to forests in formally protected area systems, many countries have also restricted or prohibited harvesting across parts or all of their forest estates (i.e. logging bans). Countries with complete bans on harvesting in their natural forests include: Thailand; Sri Lanka; Bangladesh; South Africa; El Salvador; and Uruguay; and China and Vietnam are believed to be considering implementing such a move.
The projections of supply and demand presented earlier were based on an assumption that the area of forest in legally protected areas or subject to other restrictions on harvesting would not change in the future. Clearly, this is almost certainly unlikely to be the case. However, in order to determine the effect that the future placement of forests into protected areas will have on the future availability of wood supplies, it is necessary to make an assumption about how much forest will be placed in legally protected areas in the future.
Past trends would suggest that maybe around 30 million ha to 50 million ha of forest might be put into protected areas globally every year, but this figure seems rather high (for example, by 2010, this would result in 20% of the world's forest area being placed in protected areas). Therefore, for the purpose of this analysis, it was assumed that an amount of forest would be put into protected areas such that 10% of forest area in every country would be in protected areas by the year 2010. This figure (10%), is a target which has been recommended by several environmental organisations working in this field.
The amount of forest which would have to be placed into protected areas to meet a 10% target is shown in Table 19. Globally, just under 110 million ha would have to be placed into protected areas to meet such a target. According to FAO statistics, the regions where most forest would have to be placed into protected areas to meet such a target would be: South America; North and Central America; and Africa. A considerable area of forest in Europe would also have to be put into protected areas, mostly in the Russian Federation.
Table 19: Forest area in protected areas in 1997 and amount required to meet a 10% target
|
Region |
Forest area (1,000 ha) |
Area in protected areas (1,000 ha) |
||
|
Available for wood supply |
Unavailable for wood supply |
Current |
Required to meet a 10% target |
|
|
Africa |
166,461 |
233,157 |
34,058 |
18,486 |
|
Asia |
223,207 |
175,077 |
75,659 |
4,682 |
|
Oceania |
26,274 |
61,593 |
13,850 |
2,271 |
|
Europe |
645,651 |
187,503 |
78,806 |
8,853 |
|
North and Central America |
332,168 |
288,700 |
33,637 |
31,629 |
|
South America |
155,492 |
707,062 |
51,200 |
42,042 |
|
World |
1,549,253 |
1,653,092 |
287,210 |
107,962 |
Source: FAO (1999a)
Forest plantations18 presently constitute only a very small proportion of the world's total forest area. The global area of forest plantations is currently estimated to be just over 120 million ha, or approximately 3.5% of total forest area (see Table 20). Forest plantations represent, however, an extreme of management intensity, usually focussing on wood-fibre production. Consequently, the importance of forest plantations in terms of both their actual and their potential contribution to meeting global demands for wood fibre is far greater than their share of total forest area would imply.
Table 20: The estimated global distribution of forest plantation resources in 1995
|
Country or region |
Industrial forest plantation area (million ha) |
Non-industrial forest plantation area (million ha) |
Total forest plantation area (million ha) |
|
Africa |
3.6 |
2.2 |
5.7 |
|
Asia |
41.8 |
15.1 |
56.9 |
|
China |
17.5 |
3.9 |
21.4 |
|
India |
4.1 |
8.3 |
12.4 |
|
Japan |
10.7 |
0 |
10.7 |
|
Oceania |
2.7 |
<0.1 |
2.7 |
|
Europe |
8.7 |
0 |
8.7 |
|
Former-USSR |
22.2 |
0 |
22.2 |
|
Russian Federation |
17.1 |
0 |
17.1 |
|
North and Central America |
18.9 |
0.3 |
19.2 |
|
United States |
18.4 |
0 |
18.4 |
|
South America |
5.4 |
2.8 |
8.2 |
|
World |
103.3 |
20.4 |
123.7 |
Sources: FAO, UNECE, Pandey (1997).
There is considerable variation in the global distribution of forest plantations. The largest proportion of the world's forest plantations can be found in Asia (just under 50%). However, as Table 20 shows, the five countries with the largest plantation areas collectively account for two-thirds of the global plantation resource.
Many countries around the world support forest plantation establishment in one way or another and the level of incentives available to establish forest plantations partly accounts for why some countries have much greater forest plantation resources than others. Other factors that can partly explain differences between countries include: agricultural subsidy regimes and the availability and price of land; expected growth rates; and local market conditions for roundwood (see Brown (1999) for a further discussion of some of these issues).
Information about the source of roundwood production is not currently collected at the global level. Therefore, it has been necessary to estimate the level and proportion of current production which might come from forest plantations, based on the area and age-structure of existing plantation resources, potential yields and harvesting losses and the availability of other sources of supply in individual countries. The utilisation of plantation-grown wood has also been split according to the type of plantation, with an assumption that industrial forest plantations are used for industrial roundwood supply, while non-industrial forest plantations are primarily used for wood fuel supply19.
Based on this information, the forest plantation supply model suggests that industrial forest plantations account for a relatively high proportion of industrial roundwood production (around 331 million m3 per year, which is equal to about 22% of global industrial roundwood production), but only a modest share of wood fuel production (around 86 million m3 per year or about 4% of global production). This is not surprising, given that trees outside of forests, such as woodlots and individual trees on agricultural land are often more convenient sources of wood fuel (see Section: 3.5.2 Sources of wood fuel supply for further information). The "bottom-line" is that current forest plantation production could be supplying around 12% of the world's total roundwood harvest.
It should also be noted that this varies considerably between geographical regions. Figure 6, for example, shows the estimated current industrial and non-industrial forest plantation harvests as a percentage of the total harvest of natural forest and plantation-grown industrial roundwood, wood fuel and total roundwood, in different regions. Plantation production for industrial roundwood is particularly important in the Oceania region, where 80 percent of industrial roundwood is plantation-grown. Africa (35 percent), South America (27 percent) and Asia (23 percent) also have above average proportions of industrial roundwood production in plantations. Production from plantations in a handful of countries in each of these regions - Australia, New Zealand, Chile, China, Japan and South Africa - is sufficiently large to put these regions ahead of the global average.
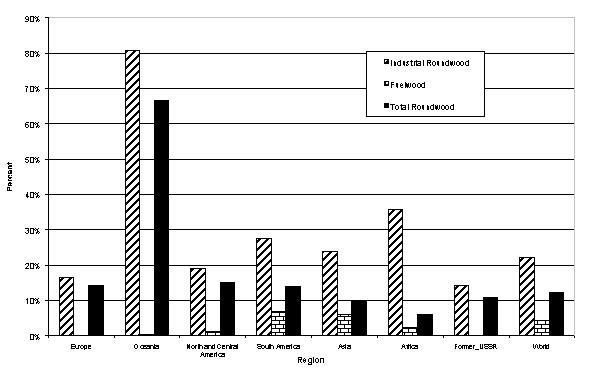 Figure
6: Estimated production of wood from forest plantations as a percentage of total
wood production in 1995
Figure
6: Estimated production of wood from forest plantations as a percentage of total
wood production in 1995
Source: Brown (1999)
16 Legally protected areas for the purpose of this analysis have been defined as areas within national protected designations corresponding to IUCN Categories I-VI.
17 Due to differences in definitions, the area figures presented here differ slightly from those presented from FAO sources.
18 The UN-ECE/FAO Temperate and Boreal Forest Resources Assessment 2000 defines plantation(s) as: "Forest stands established by planting or/and seeding in the process of afforestation or reforestation. They are either: forests of introduced species (all planted stands), or intensively managed stands of indigenous species which meet all the following criteria: one or two species at plantation; even age class; and regular spacing". This is the definition that has been used for this analysis.
19 Plantations for wood fuel production are a major component of the non-industrial forest plantation area.
