


2. Evaluation of the data collected and the methodology
The methodology for data collection, processing and dissemination as described in the previous sections looks good on paper. In practice however, the system has completely broken down resulting into many information gaps regarding forest products statistics in Uganda. As shall be further discussed below, a lot remains to be improved on the reliability of the data, including the methodology, monitoring and control.
Forest Department staffs, both in the field and District headquarters, do not regularly submit the relevant forms and reports to FD headquarters. Moreover, even the few reports, which reach the headquarters, have serious gaps in relevant section, which are crucial for assessing the reliability of the data. For instance, some of them could report that so much revenue has been collected during the reporting period without giving details on the quantity of the product sold or in other cases do not report at all. The end result is that currently the FD is faced with not only gaps in the data it disseminates, but also the quality of the available data are wanting.
So, under such a situation and perhaps under the pretext of doing one’s duty, the officer especially under pressure to produce production figures on forest products, simply looks at the previous estimates and makes an ‘expert guess’ of how the production has increased in the reporting year. This practice has been going since 80s. Therefore, over the years, the users of FD’s figures on forest products statistics in Uganda has been what can be correctly described as guesstimates.
2.2. Strengths and Weaknesses in the existing system
2.2.1. Strengths:
The strength of data collection, processing and analysis lies in the Forest Department’s establishment of professional foresters who are charged with the management and implementation of the forest resource. The Departmental Standing Orders with its clear instructions of what should be done, how and when, together with the appropriate forms is yet another point of strength in the system.
2.2.2. Weakness:
The weaknesses identified in the existing system are among others: breakdown of reporting and feed back, lack of logistical support, tools and equipment, lack of monitoring and control, corruption and negligence of duty.
Most DFOs are notoriously known for not submitting their quarterly or annual reports. Even for the few, who do so, the quality of the report leaves a lot to be desired. For instance, the data on quantities of forest products sold and revenue collected is more often than not left out making it impossible to crosscheck production figures with the actual volumes of timber or charcoal sold.
Logistical supports such as transport preferably a four-wheeled vehicle, motor cycle or at the very least, bicycles for the forester in charge of field operations are hardly available. To compound it all, operational funds for labour, vehicle running costs and basic office running such as stationery, are also hardly available.
2.3.1. Essential tools/equipment:
Essential tools like callipers, diameter tapes, hypsometers, weighing scales, and volume tables for the collection of the primary data such as round wood volume, weights of charcoal produced etc are hardly available. For example in many parts of the country, this has led to the use of crude methods such as visual estimation or use of ordinary distance tapes for measurement of log volumes. With such crude methods being applied in the field, the quality of the data collected is doubtful.
2.3.2. Monitoring and control
Supervision of field operations by DFOs or even Head quarters staff is not adequate or hardly in place. The result is that DFOs choose whether to submit a report or not. If he chooses to submit one, then more often than not, he decides what information should be passed to head office, aware that HQ will probably not find out or take such a long time that he would have probably also left his station. Lack of monitoring and control therefore, has led to widespread malpractice such as illegal activities and outright corruption, putting a big question mark on quality of data and methodology on forest products in Uganda.
2.3.3. Corruption:
Presently the revenue collections on forest products in the country are very low due to rampant corruption and embezzlement of collected funds. For example the National Biomass Study (1996) estimated that if revenue collection efficiency can only be improved to about 10 -15 % on monetary forest products, it should yield between 20 to 30 billion shillings per year as compared to the current collections of less than 1 billion shillings per year. Therefore, for obvious reasons, it would not be wrong to conclude that the actual true quantities of forest products sold or removed from the forest is deliberately concealed by the officers involved in the malpractice, rendering the data/information supplied to FD HQ as inadequate and unreliable.
2.3.4. Methodology
There are about two weaknesses sighted in the present methodology for the collection of data on major forest products. One of them is related to the development of the timber volume table and the other on the forms. According to Huber’s formula, which the FD uses, the volume of a log is estimated by calculating the cross sectional area of the mid diameter multiplied by the length of the log
[V = p /4d2 l]
Where V = Volume
p = PI (3.14)
d = Diameter in centimetres or metres
l =Log length
However, a closer check of the log volume tables (both hardwoods and softwoods) as provided in the DSO and used across the country revealed that there are gross errors in the tables. For example, in the log-volume table for hardwoods, under a mid diameter of 30 cm and log length of 1.4 m, the volume given in the table is 0.144 cubic metres, whereas based on the above formula, it should be 0.099 cubic metres. Comparisons with other sets of mid diameters and log length were similarly calculated and proved that the entire log volume table, which the FD uses in the field, is wrong. In the above example, the difference of 0.045 on single logs might be negligible but when extended over for instance, 100 such logs this can translate into 4.5 cubic metres. At national level, this difference can be so alarming when spread out for all the forest reserve.
The second weakness sighted in the methodology is the use of indirect measurement of firewood and charcoal by counting head bundles or number of bags in the field. With no standard conversion tables especially in the field, the forester who collects the raw data is subjected to erroneous estimates.
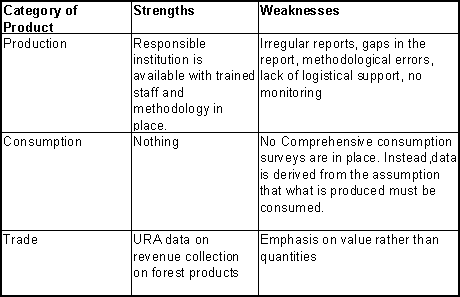 Table -1: Summary
2.4. Data dissemination and Users
The data and information on forest products statistics are disseminated to the Forest Department, other government institutions, the public and international organisations.
The main user of forest product statistics in Uganda is the Forest Department itself. It enables it to plan for the future supply, consumption and trade in these products. FD also uses this information, in its awareness campaigns about the forestry sector.
Other Government agencies which make use of these data/information is Ministry of Planning and Economic Development, especially when preparing budgets and allocation of annual funds to the forestry sector as part of the overall national planning and budgeting. The Department of Statistics formerly under this Ministry and now a body corporate (Uganda Bureau of Statistics) also uses this information for the preparation of annual statistical abstracts for the country.
At International level organisations such as the Food and Agriculture Organisation, World Bank and its affiliates are all provided with such information, usually on request. For instance, FAO uses it for the global assessment of the forestry sector and production of Annual yearbook of Forest products statistics.
