
5. FAO’s Year Book of forest Products
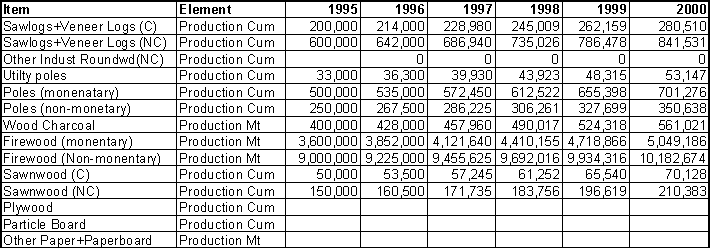
 The table below is a summary of FAO data on forest product statistics
Table -1: FAO Data on forest products in Uganda
According to the FAO web site, table 1-1 shows that industrial round wood from NC has the greatest share.
5.2. Comments on the accuracy of the data
Generally, the FAO data is far below the current estimates. As discussed above on the reliability of the data, since the early 80s most of the data supplied to FAO is based on guessed estimates. For instance, the production of saw logs in 1995 for Non-Coniferous trees is estimated at 100,000 CUM, whereas the corresponding sawnwood is estimated at 76,500 CUM. This, in reality implies a recovery efficiency rate of 76.5 %, which is not possible in Uganda. The actual recovery percentage of sawn wood timber to roundwood produced is around 25%. This is a direct result of inefficient ways of conversion of logs into sawn timber. Consequently current estimates for 1995 is put at 200,000 sawn timber, which translates into about 800,000 cum of roundwood.
Similarly, FAO’s estimate of charcoal production of 150,000 tons in 1995 is also far below the current estimates. It is not clear as to whether this figure has been converted into its round wood equivalent under ‘other industrial round wood’ estimated at 1.899 million CUM. According to a study by ESD, the charcoal production and consumption in the country is around 400,000 tons. This translates to about 1.32 million tons of round wood equivalent at a conversion efficiency of around 30%.
Therefore, the conclusion is that the FAO data similar to the current FD statistics on forest products is unreliable.
5.3. Validation and updating of the information
Below is therefore an updated data on forest product statistics for Uganda based on the estimates from ESD report for 1995. Since the available data is unreliable, the subsequent years up to the current year have been projected based on assumptions of growth rates for various products developed by the National Biomass Study (See table 6-2 below). These assumptions have been based on a combination of economic growth, population growth (both for rural and urban), rates for the country as given by Ministry of Finance and Economic Planning.
Table -2: Assumptions of growth rates in production and consumption of forest products in Uganda (NBS, 1996)
|
Product |
Growth Rate % p.a. (%) |
|
Charcoal |
7 |
|
Firewood (monetary) |
7 |
|
Firewood (non-monetary) |
2.5 |
|
Sawn timber |
7 |
|
Electricity poles |
10 |
|
Telephone poles |
10 |
|
Poles monetary |
7 |
|
Other products |
5 |
The results of the updated statistics are as shown in table 6-3 below: It is clear that there are major differences when the two data are compared with each other. These differences are expected as explained above under the weaknesses of the existing data/information in the country.
 Table -3: Updated Forest product statistics
Forest Department, Biomass Derived Energy Survey, (1995). A report by Energy for Sustainable Development, ESD (UK).
National Biomass Study (1996), Project Document 1996-2000.
FAO Yearbook of Forest Products 1993-1997.