![]()
![]()
![]()
by
Joo Yeoul Lim
National Fisheries Research and Development Agency
Busan, Republic of Korea
1. INTRODUCTION
The Korean trawl fishery in the Eastern Central Atlantic Ocean exists since 1966, and is based at Las Palmas.
In the first year of operation, the total catch of 9 vessels was 1,379 t. Catches gradually increased and reached a peak in 1976 of 90,757 t. by 100 vessels, and then declined continuously to 62,823 t by 92 vessels in 1978 and about 65,000 m.t. by 97 vessels in 1979. Only 81 vessels are operating in 1980, the decline being due to the declaration of the 200 nautical miles economic zones and the restrictions imposed on the fisheries in these areas.
All member countries have been requested to submit their catch statistics and biological data to CECAF for stock assessment purposes and for cooperative research.
In order to adapt to this new circumstance, a scientist from Korea was sent to the area and carried out investigations on board a trawler for a month in the period June-July 1980.
This report summarizes the results of this work.
2. SUMMARY
Catch statistics of the 52 Korean trawlers operating in the Eastern Central Atlantic ocean from October 1979 to June 1980.
Catches were highest in subdivision 1.3 with 21,096 m.t. The most abundant species in all subdivisions was cuttlefish.
Most of the catch was taken by vessels in the 349 G.T. group : 21,886 t, of which cuttlefish was the most abundant species.
CPUE was highest in subdivision 1.2 with 287.38 kg/h (only 42 hours fished), followed by 235.50 kg/h in 3.1, 226.80 kg/h in 1.3 and 210.65 kg/h in 3.3.
CPUE was highest in the 824 G T group with 277.52 kg/h , followed by the 942 G T group with 261.30 kg/h.
The size composition of the major species was as follows:
Octopus, ranging in weight from 0.3 to 4.5 kg, with a peak at 1.2–1.5 kg.
Cuttlefish, ranging from 0,4 to 8 kg, with a peak at 0.4–0.8 kg.
Squid, ranging in mantle length from 10 to 35 cm, with a peak at 11–15 cm.
Shrimp, ranging in weight from 20 to 120 g, with a peak of 40–60 g.
Porgy, ranging from 12 to 34 cm, forklength, with a peak at 18–21 cm.
The results of the growth and age study of the progy, Pagrus (*) ehrenbergii collected in the Eastern Central Atlantic Ocean in June 1980 were as follows:
The age-length relationship was estimated by the Von Bertalanffy equation
Lt = 34.46 (1 - e- 0.1623 (t + 1.0436))
(Lt = fork length in cm, t : age)
The length-weight relationship was as follows :
W = 18.8 × 10⁻³ L3.05
(L = fork length in cm, W = body weight in g.)
According to Fischer et al., the correct scientific name of this species is Sparus caeruleostictus
The age-weight relationship, derived from the length-weight relationship and the Von Bertalanffy equation is :
Wt = 917.5 (1 - e-0.1623 (t + 1.0436))3.05
3. RESEARCH RESULTS
Catch statistics of the Korean trawl fishery in the Eastern Central Atlantic
In the period October 1979 to June 1980, 52 Korean trawlers operated in the Eastern Central Atlantic Ocean, their tonnages ranging from 295 to 942 G T. Their total catch for that period was 26 848 t.
Catch by subdivision and species
The catch by subdivision and species of the 52 Korean trawlers is shown in Table 1. Main fishing grounds were the CECAF subdivisions 1.3, 3.1, 3.3 with respectively 21,096 ; 4,684 and 1,053 m.t. Cuttlefish was the most abundant species in all subdivisions, i.e. 4,046 m.t. in 1.3 ; 1,875 m.t. in 3.1 and 488 m.t. in 3.3. Next in abundance in 1.3 was octopus, in 3.1 and 3.3 goatfish (Pseudupeneus prayensis).
Catch by vessel tonnage and species
Table 2 summarizes catches by vessel tonnage and by species. Most of the catch was taken by the 349 G.T. group : 21,886 m.t., followed by the 295 G.T. group with 1,780 m.t.
Cuttlefish was the most abundant species in the catches of the 295, 349, 582 and 942 G.T. groups, while Octopus was the most abundant species in the 676 and 824 G.T. groups.
CPUE by subdivision and species
CPUE by subdivision and species are shown in Table 1. CPUE were highest in 1.2 with 287.38 kg/hour (only 42 hours), followed by 3.1 with 232.50 kg/hour, 1.3 with 226.80 kg/hour and 3.3 with 210.65 kg/hour.
CPUE by vessel tonnage and species
From Table 2 it appears that CPUE were highest in the 824 G.T. group with 277.52 kg/hour, followed by 942 G.T. with 261.30 kg/hour, 767 G.T. with 256.97 kg/hour, 582 G.T. with 253.83 kg/hour, 349 G.T. with 224.96 kg/hour and 295 G.T. with 199.01 kg/hour.
Biological studies
Size composition of the major species caught by Korean trawlers in the Eastern Central Atlantic ocean
Octopus (Octopus vulgaris CUVIER)
The weight composition of the octopuses caught in this area in April-May 1980 is shown in Figure 1. Weights ranged from 300–4,500 g., with a peak of 1,200–1,500 g.
Cuttlefish (Sepia officinalis LINNE)
The cuttlefish caught in April-June ranged in weight from 400 to 8,000 g., with a peak at 600–1,200 g (Figure 2).
Squid (Illex illecebrosus LESUEUR)
Squid caught by Korean trawlers in April-May 1980 ranged in mantle length from 10 to 35 cm, peaking at 16–25 cm (Figure 3).
Shrimp (Penaeus duorarum notialis PEREZ FARFANTE)
In CECAF subdivision 34.3.3, in June, shrimp ranged in body weight from 40 to 100 g. with a peak at 40–60 g (Figure 4).
Porgy (Pagrus ehrenbergi VALENCIENNES)
Porgy in Korean trawl catches in subdivision 34.3.3 in June 1980 ranged in fork length between 12 and 34 cm, peaking at 18–21 cm (Figure 5).
Studies on the age and growth of the Porgy, Pagrus ehrenbergi VAL. in the Eastern Central Atlantic Ocean
Introduction
About twenty species of seabream are known to occur in the CECAF area (Far Seas Fisheries Research Laboratory, 1972). Most of these species were caught by trawlers, accounting for 13,946 m.t. in 1977. Porgy, Pagrus ehrenbergi Valenciennes one of the most abundant demersal species, are fished in large numbers by many countries, hence the need for effective management of the stock. Recognizing the necessity of the joint resources management and the research cooperation, the Korean Government dispatched a scientist to the CECAF area in June 1980 to obtain biological data.
This paper reports on the study of the age and growth of the porgy, and provides some of the basic parameters necessary for stock assessment.
Materials and methods
Age and growth of this species were studied on 540 specimens collected from a Korean trawler (350 G.T., 1 700 HP), which was operating in the Eastern Central Atlantic during the period June-July 1980. Figure 6 shows the area sampled in this study, i.e. FAO Statistical subdivision 34.3.3. After measurement of the fork length and total length as well as the body weight of each specimen and sex determination, about ten scales were removed from the middle of the area between the origin of the pectoral fin and the lateral line. After soaking in a 5% KOH solution for about 24 hours and washing in clear water, eight scales were then mounted between two slide glasses and were measured with a profile projector at a magnification of 20 times. Age determination by scale reading was conducted four times by two readers in order to check the readings (Figure 7).
Results
Growth in length
The growth pattern of most fish species can be described by the Von Bertalanffy growth equation. In this study, fork lengths at each age were plotted against the length one year later (Walford plot, Figure 8). This yielded the following equation :
Lt+1 = 0.8494 Lt + 5.189,
from which the two growth parameters L∞ and K were estimated :
L∞ = 34.46 cm and K = 0.1623 year-1
Then to was estimated as to = - 1.0436
(See Table 3).
The growth equation obtained was as follows (Figure 9) :
Lt = 34.46 (1 - e-0.1623 (t + 1.0436))
where Lt = fork length in cm at time t (year)
Growth in weight
The exponential relationship between fork length and body weight determined from the regression of log W on log L was found to be :
W = 18.8×10⁻³ L3.050
The growth curve in weight at each age was determined from the parameters of the growth equation for length and the length-weight relationship (Figure 10).
Wt = 917.5 (1 - e-0,1623 (t + 1.0436))3.05
where Wt = body weight at time t in g, and
t = time in years
(See Table 4 and Figure 11).
4. REFERENCES
FAO, Fishery Committee for the Eastern Central Atlantic. CECAF Statistical 1979 Bulletin, No. 2. Nominal catches, 1967–1977. CECAF Stat.Bull., (2) : 163 p.
Far Seas fisheries Research Laboratory (Ed.). Tokyo, Japan, 29–56. Colored 1972 illustrations of bottom fishes collected by Japanese Trawlers.
Gulland, J.A., FAO.Man.Fish.Sci. 4 : 34–43. Manual of methods for fish stock 1969 assessment.
5. ADDENDUM, BY F.C. ROEST, CECAF PROJECT
The present report deals with Pagrus ehrenbergi from statistical subarea 34.3.3, the Sherbro division, where no earlier study of this species has been made. Giret (1974) studied P. ehrenbergi from the North of Senegal and indicated that there might be two separate populations of this species, one north of the Cap Vert peninsula and one further South in the Gambia-Bissagos area.
The growth parameters found in these two studies differ widely and furter comparative research is necessary to determine if these differences are real or due to the research methods used.
Giret (1974), studying 363 P. ehrenbergi from the artisanal fishery in the north of Senegal (Cayar, St. Louis), found that age determination from otoliths and scales was impossible. He based his growth analysis on almost two years of modal length progressions, and found : (length-weight relationship) log W = 2.9487 log FL - 4.4912, and (Von Bertalaffy)
lt = 702.77 (1 - e-0.014824 (t + 6.3098), based on fish of 17–45 cm forklength.
In May-June, when the fish concentrate for spawning in the northern coastal waters of Senegal, males make up 46.4% of the population. The smallest mature size is 22 cm for both sexes, and almost all males over 25 cm and females over 24 cm are mature.
Recruitment to the artisanal fishery takes place during the third year of life, and is determined by seasonal north-South migrations and spawning aggregations.
Giret, M., CRODT, Dakar, Doc.Scientifique No. 57, 29p., Biologie et 1974 pêche de Pagrus ehrenbergi sur les côtes du Sénégal.
Table 1. Catch (M/T) and mean CPUE (kg/h) by subdivision and species by 52 Korean trawiers in the eastern central Atlantic from October 1979 to June 1980.
| Species Subdivision | Total | Sea bream | Goatfish | Tongue fish | Shrimp | Octopus | Cuttlefish | Squid | Others |
|---|---|---|---|---|---|---|---|---|---|
| 34. 1.2 | 12.07 | 1.6 | - | 0.27 | - | 0.27 | 0.55 | 0.49 | 8.89 |
| (287.38) | (38.10) | (6.43) | (6.59) | (13.10) | (11.67) | (211.67) | |||
| 34. 1.3 | 21,096.35 | 2,144.47 | 6.09 | 2,092.45 | 0.82 | 3,589.46 | 4,046.86 | 991.36 | 8,224.84 |
| (226.80) | (23.05) | (0.07) | (22.49) | (0.00) | (38.59) | (43.51) | (10.66) | (88.42) | |
| 34. 3.1 | 4,686.08 | 366.05 | 396.80 | 176.12 | 29.87 | 196.02 | 1,875.67 | 10.93 | 1,634.62 |
| (232.50) | (18.16) | (19.69) | (8.74) | (1.48) | (9.73) | (93.06) | (0.54) | (81.10) | |
| 34. 3.3 | 1,053.44 | 42.35 | 238.82 | 25.50 | 25.59 | 0.56 | 488.50 | 0.04 | 232.08 |
| (210.65) | (8.49) | (74.75) | (5.10) | (5.12) | (0.11) | (97.68) | (0.00) | (46.41) |
( ) ; CPUE
Table 2. Catch (M/T) and mean CPUE (kg/h) by tonnage group and species by 52 Korean trawlers in the eastern central Atlantic from October 1979 to June 1980.
| Species Tonnage | Total | Sea bream | Goatfish | Tongue fish | Shrimp | Octopus | Cuttlefish | Squid | Others |
|---|---|---|---|---|---|---|---|---|---|
| 295 | 1,780.72 | 202.42 | 82.01 | 132.73 | 5.63 | 294.99 | 496.72 | 46.39 | 519.83 |
| (199.01) | (22.63) | (9.17) | (14.48) | (0.63) | (32.98) | (55.54) | (5.19) | (58.12) | |
| 340 | 21,886.19 | 2,092.23 | 524.16 | 1,880.55 | 49.94 | 2,957.22 | 5,271.42 | 854.17 | 8,256.50 |
| (224.96) | (21.51) | (5.39) | (19.33) | (0.51) | (30.40) | (54.18) | (8.78) | (84.87) | |
| 582 | 326.43 | 25.68 | - | 22.28 | 0.71 | 11.24 | 141.28 | 1.53 | 123.71 |
| (253.83) | (19.97) | (17.33) | (0.55) | (8.74) | (109.86) | (1.19) | (96.20) | ||
| 676 | 940.51 | 105.34 | 4.02 | 101.88 | - | 189.41 | 139.89 | 35.96 | 364.01 |
| (256.97) | (28.78) | (1.10) | (27.84) | (51.75) | (38.22) | (9.83) | (99.46) | ||
| 824 | 1,284.10 | 99.75 | 2.80 | 129.24 | - | 251.87 | 186.77 | 48.59 | 565.08 |
| (277.52) | (21.56) | (0.61) | (27.93) | (54.43) | (40.37) | (10.50) | (122.13) | ||
| 942 | 629.99 | 29.05 | 28.72 | 27.66 | - | 81.58 | 175.50 | 16.18 | 271.30 |
| (261.30) | (12.05) | (11.91) | (11.47) | (33.84) | (72.79) | (6.71) | (112.53) |
( ) ; CPUE
 | P1 | Over 4.5 Kg |
| P2 | 3.0 – 4.5 | |
| P3 | 2.0 – 3.0 | |
| P4 | 1.5 – 2.0 | |
| P5 | 1.2 – 1.5 | |
| P6 | 0.8 – 1.2 | |
| P7 | 0.5 – 0.8 | |
| P8 | 0.3 – 0.5 |
Figure 1. Weight composition of Octopus octopus vulgaris CUVIER in the eastern central Atlantix ocean during April to May, 1980.
 | M1 | Over 8.0 Kg |
| M2 | 5.0 – 7.9 | |
| M3 | 3.0 – 4.9 | |
| M4 | 2.0 – 2.9 | |
| M5 | 1.3 – 1.9 | |
| M6 | 0.0 – 1.2 | |
| M7 | 0.6 – 0.8 | |
| M8 | 0.4 – 0.5 |
Figure 2. Weight composition of cuttlefish Sepia officinalis LINNE in the eastern central Atlantic Ocean during April to June, 1980.
 | GG | Over 35 Cm |
| G | 31 – 34 | |
| M | 26 – 30 | |
| P | 21 – 25 | |
| 2P | 16 – 20 | |
| 3P | 11 – 15 | |
| 4P | 10 |
Figure 3. Size (mentle-length) composition of squid Illex illecebrosus LESUEUR in the eastern central Atlantic Ocean during April to May, 1980.
Figure 4 : Weight composition of shrimp Penaeus duorarum notialis in the Eastern Central Atlantix Ocean during 1980
Figure 5 : Size (fork length) composition of porgy Pagrus ehrenbergi in the Eastern Central Atlantic Ocean during June, 1980
Figure 6 : Map showing the sampling area for this study
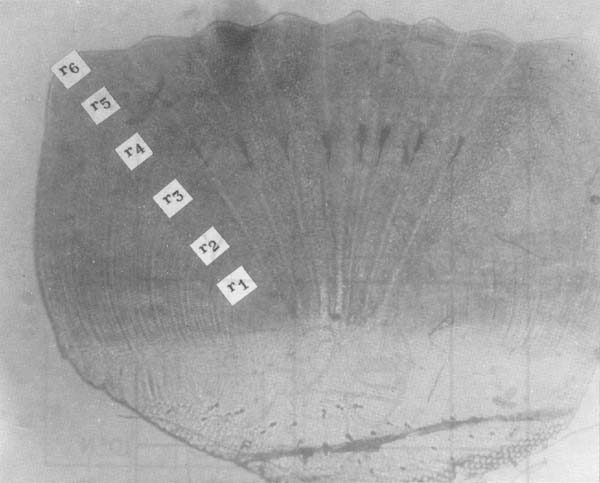
Figure 7 : Photography of the scale of porgy Pagrus ehrenbergi VALENCIENNES showing notation for measurement of each age (r1 - r6)
Figure 8 : Walford's plot pf growth for calculated length of porgy taken during the 1980 survey in the Eastern Central Atlantic Ocean
Table 3 : Observed length and calculated length of porgy based on the von Bertalanffy's formula.
| (Unit : Cm) | ||||||||||||
|---|---|---|---|---|---|---|---|---|---|---|---|---|
| Length in each age | L1 | L2 | L3 | L4 | L5 | L6 | L7 | L8 | L9 | L10 | L11 | L12 |
| Observed Length | 13.52 | 17.01 | 19.34 | 21.60 | 23.72 | 24.55 | 26.30 | 27.58 | 28.71 | 29.60 | 30.49 | |
| Calculated length | 9.73 | 13.43 | 16.58 | 19.26 | 21.54 | 23.47 | 25.12 | 26.52 | 27.71 | 28.72 | 29.58 | 30.31 |
Figure 9 : Von Bertalanffy growth curve for porgy taken during the 1980 trawl survey in the Eastern Central Atlantic Ocean
Figure 10 : Length - weight observations from porgy taken during the 1980 trawl survey in the Eastern Central Atlantic Ocean
Table 4 : Calculated body weight for porgy based on the von Bertalanffy's formula.
| (Unit : g) | ||||||||||||
|---|---|---|---|---|---|---|---|---|---|---|---|---|
| Weight in each age | W1 | W2 | W3 | W4 | W5 | W6 | W7 | W8 | W9 | W10 | W11 | W12 |
| Calculated weight | 259.0 | 357.6 | 441.5 | 512.8 | 573.4 | 625.0 | 668.8 | 706.1 | 737.8 | 764.7 | 787.6 | 807.0 |
Figure 11 : Von Bertalanffy growth curve for Porgy taken during the 1980 trawl survey in the Eastern Central Atlantic Ocean
![]()
![]()
![]()