![]()
![]()
![]()
Example 5.6 Fraser River salmon analysed by the regression framework
Table 5.5 contains the estimated parameters and the SSQ's for four different selection models assuming Poisson distributed errors. As the models use the same data the SSQ may be used directly as a relative measure of goodness-of-fit. The lowest SSQ is found for the two-sided model. Figure 5.9 shows the four selection curves.
Table 5.5 Parameter estimates and sums of squared residuals for Fraser River sockeye salmon.
| Selection curve | Parameters | Sum of squares (SSQ) |
| Normal | k;s = 4.09; 0.304 | 177.8 |
| Log-normal | k;s = 1.41; 0.076 | 162.7 |
| Gamma | α;β= 175; 0.023 | 166.7 |
| Two-sided | k;s1;s2 = 3.99; 0.24; 0.40 | 153.0 |
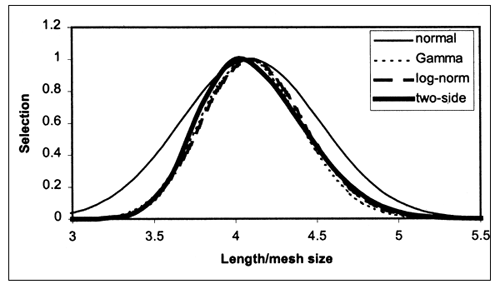
Figure 5.9 Selection curves for Peterson's (1954) data using four different models and assuming Poisson distributed errors.
In the ML estimation, use of different error models requires derivation of specific estimation equations for each form of the error (cf. Examples 5.4, 5.5 and Appendix 1). It is much simpler to account for different error structures in the regression framework, which is done through the choice of the parameter β used in the power transformation of the catch data. Figure 5.10 compares the estimated selection curves from the regression framework when using different assumptions on the error structure - i.e. a) low contagion (β>0.5), b) Poisson distributed errors (β=0.5, catches random distributed) and c) high contagion (β<0.5). The three selection curves differ mainly with respect to their width, which increases with the degree of contagion. Again, the difference in the selection curves may be interpreted as an uncertainty caused by not knowing the true error structure.
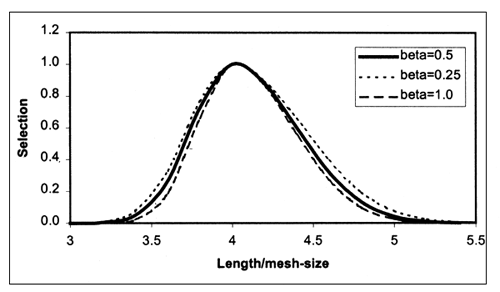
Figure 5.10 Selection curves for Peterson's (1954) data using the two-sided selection curve model with three different error structures a) no contagion (β=1, constant variance), Poisson (β=0.5, variance proportional to the mean) and high contagion (β=0.25, variance increases faster than the mean).
Example 5.7 analyses Lake Whitefish data provided by Regier and Robson (1966). The selection is described with the two-sided model, which is used in two versions-one obeying and one not obeying the principle of geometric similarity.
Example 5.7 Lake Whitefish data analysed when not assuming the principle of geometric similarity
The principle of geometrical similarity implies that all mode and width measures of the selection curves are proportional to fish length (i.e. measure = a * length). A less restrictive assumption is that the various measures are related linearly to length (i.e. measure = b + a * length). This formulation is used for gillnets by Helser et al. (1991) and Hansen et al. (1997) and for hooks by Punt et al. (1996).
Regier and Robson (1966) analysed gillnet catches (Table 5.6) of lake whitefish concluding that selection could be described by a right-skewed curve. They suggested the skew normal selection curve model derived by the truncated Gram-Chalier series. As this formulation has serious deficiencies (section 3.3), the analysis presented here uses the two-sided model. The selection model was formulated in two versions a) in accordance with the principle of geometric similarities and b) with the parameters being related linearly to fish length.
Table 5.6 Gillnet catches provided by Regier and Robson (1966).
Mesh size
| Length (cm) | 1 | 1.5 | 1.75 | 2 | 2.25 | 2.5 | 2.75 | 3 | 3.5 | 4 | 4.5 | 5 | Total Catch |
| 4 | 33 | 0 | 0 | 0 | 0 | 0 | 0 | 0 | 0 | 0 | 0 | 0 | 33 |
| 5 | 15 | 6 | 0 | 0 | 0 | 0 | 0 | 0 | 0 | 0 | 0 | 0 | 15 |
| 6 | 3 | 39 | 6 | 1 | 0 | 0 | 0 | 0 | 0 | 0 | 0 | 0 | 39 |
| 7 | 0 | 99 | 327 | 27 | 1 | 2 | 0 | 0 | 0 | 0 | 0 | 0 | 327 |
| 8 | 0 | 60 | 250 | 175 | 21 | 1 | 0 | 0 | 0 | 0 | 0 | 0 | 250 |
| 9 | 0 | 3 | 78 | 343 | 425 | 132 | 14 | 2 | 0 | 0 | 0 | 0 | 425 |
| 10 | 0 | 6 | 24 | 155 | 327 | 349 | 94 | 14 | 0 | 0 | 0 | 0 | 349 |
| 11 | 0 | 0 | 5 | 30 | 135 | 351 | 286 | 171 | 3 | 0 | 0 | 0 | 351 |
| 12 | 0 | 0 | 0 | 5 | 37 | 154 | 207 | 268 | 32 | 1 | 0 | 0 | 268 |
| 13 | 0 | 0 | 0 | 2 | 10 | 31 | 101 | 172 | 99 | 9 | 1 | 0 | 172 |
| 14 | 0 | 0 | 0 | 0 | 4 | 8 | 31 | 66 | 184 | 59 | 5 | 1 | 184 |
| 15 | 0 | 0 | 0 | 0 | 1 | 2 | 10 | 24 | 128 | 148 | 36 | 5 | 148 |
| 16 | 0 | 0 | 0 | 0 | 1 | 0 | 2 | 4 | 55 | 125 | 70 | 10 | 125 |
| 17 | 0 | 1 | 0 | 0 | 0 | 0 | 1 | 1 | 17 | 61 | 83 | 22 | 83 |
| 18 | 0 | 0 | 0 | 1 | 0 | 0 | 0 | 1 | 5 | 29 | 54 | 39 | 54 |
| 19 | 0 | 0 | 0 | 0 | 0 | 0 | 2 | 0 | 2 | 17 | 29 | 27 | 29 |
| 20 | 0 | 1 | 0 | 0 | 0 | 0 | 0 | 0 | 0 | 3 | 2 | 4 | 4 |
| 23 | 0 | 0 | 0 | 0 | 0 | 0 | 0 | 0 | 0 | 0 | 0 | 1 | 1 |
| 24 | 0 | 0 | 0 | 0 | 0 | 0 | 0 | 0 | 0 | 0 | 1 | 0 | 1 |
| Total | 51 | 215 | 690 | 739 | 962 | 1030 | 748 | 723 | 525 | 452 | 281 | 109 | 2858 |
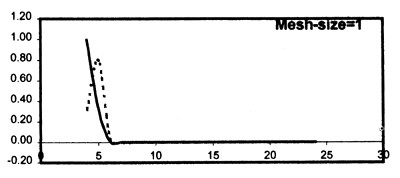
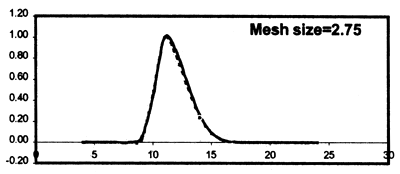
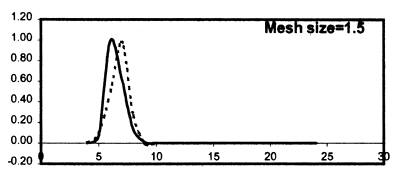
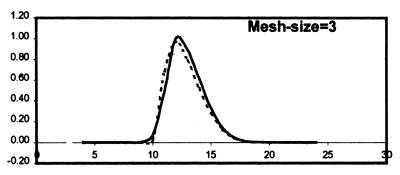
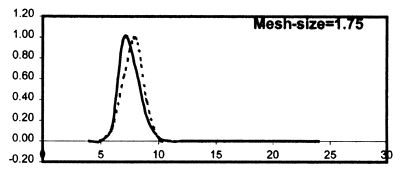
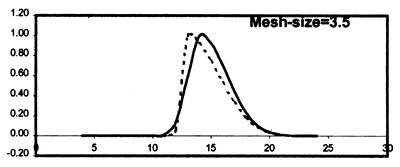
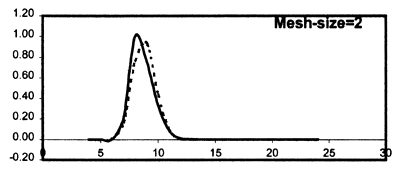
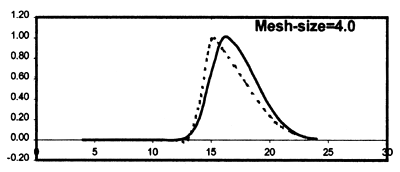
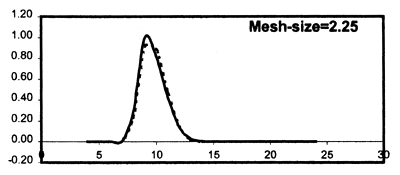
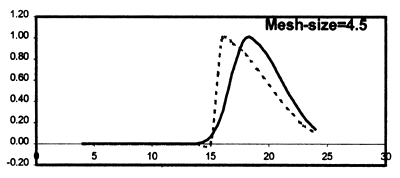
The estimated parameters and the SSQ statistic for the two model formulations are provided in Table 5.7. The non-Baranov formulation provides the best fit. However, when plotting the values of k, s1 and s2 against mesh-size for the two model formulation the difference is found to be small (Figure 5.11). Comparing the predicted selection curves for each of the 12 mesh-sizes show that the most pronounced differences are observed for the two largest mesh sizes (Fig. 5.12).
Table 5.7 The estimated parameters and the SSQ statistic's for the two selection models for lake whitefish.
| Parameter | Baranov (Proportional) | non-Baranov (Linear) |
| Slope-Mode | 4.03 | 3.89 |
| Slope-s1 | 0.30 | 0.37 |
| Slope-s2 | 0.66 | 0.51 |
| Intercept-Mode | 0.00 | 0.32 |
| Intercept-s1 | 0.00 | -0.26 |
| Intercept-s2 | 0.00 | 0.30 |
| SSQ | 158.17 | 111.41 |
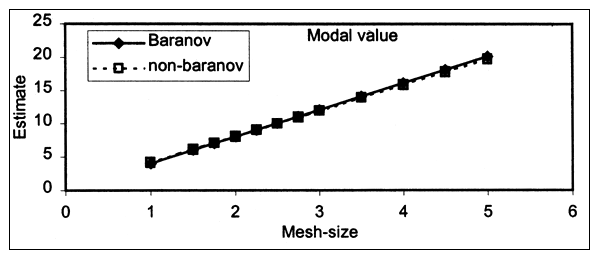
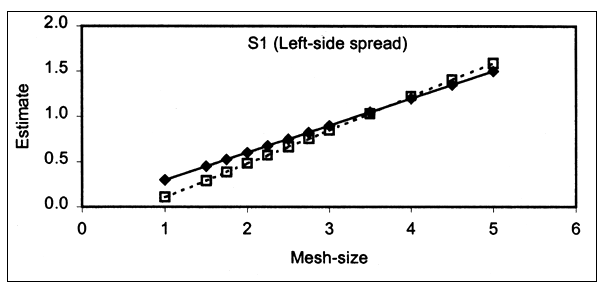
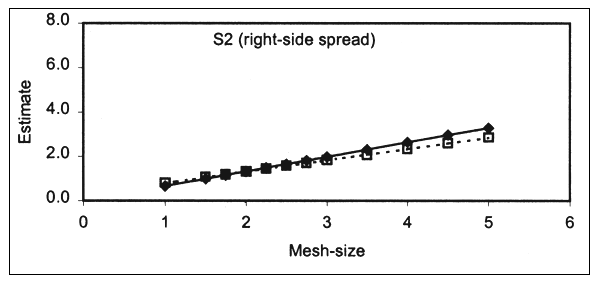
Figure 5.11 Estimated values of k, s1 and s2 for the two formulations of the two-sided model describing lake whitefish selection. The individual mesh-sizes are shown as dots.
 |  |
 |  |
 |  |
 |  |
 |  |
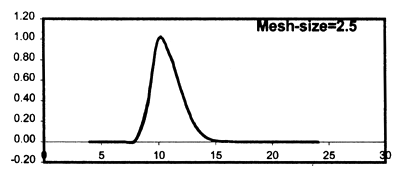 | 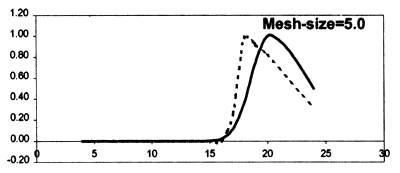 |
Figure 5.12 The estimated selection curves for the 12 mesh-sizes used in the lake whitefish experiment. The continuous lines represent the Baranov formulation (the selection parameters proportional to mesh-size), while the broken lines show the non-Baranov formulation (parameters linearly related to mesh-size).
In most work on gillnet selection, it is assumed that the fishing power of different nets is identical. However, physical attributes of nets may have considerable effects on the net's catching efficiency (see Section 7). For the Peterson data (Figure 5.13), the 15.9 mm mesh-size under-performs relative to its neighbouring mesh-sizes, suggesting that the fishing power of this mesh-size may be below average.
Catch by mesh size for length groups
Figure 5.13 Catch as a function of mesh size for two length classes, Data from Peterson (1954), see Table 5.1.
Baranov (1948) noticed that catches are higher when nets are made by thinner materials and suggested that fishing power is proportional to the ratio between mesh-size and twine diameter. Later work (see Section 7) has confirmed the importance of the dimensions of netting material on fishing power. Hovgård et al. (1999) suggest modelling fishing power as:
To achieve a unique solution it is necessary to assign a certain fishing power to one mesh size and express the fishing powers of the other mesh sizes relative to this standard. The fishing power expression is easily introduced in the regression framework. An example of the estimation is given below.
Example 5.8 Estimating fishing power for net used in the Greenland cod survey
In a study on gillnet selection in Greenland's inshore areas Hovgård (1996b) found that the catches of 4 different species differed considerably in magnitude between nets and that this difference could be associated with the ratio mesh-size/twine diameter. Table 5.8 provides information on mesh-sizes and related twine diameters. Table 5.9 presents the catch data for cod (Gadus morhua), omitting 26 individuals larger than 60 cm.
Table 5.8 Twine diameters for the different mesh sizes used in the inshore gillnet fisheries in Greenland. The relative ratio relates the ratio mesh-size/twine diameter for the different mesh-sizes to the ratio of the largest mesh size.
| Mesh size (A) | 3.3 | 3.7 | 4.8 | 5.6 | 6.8 |
| Twine diameter (B) | 0.24 | 0.2 | 0.38 | 0.28 | 0.33 |
| Ratio (A/B) | 13.75 | 18.50 | 12.63 | 20.00 | 20.61 |
| Relative ratio | 0.67 | 0.90 | 0.61 | 0.97 | 1.00 |
The catch data show a clear bimodal pattern. For the present analysis, data were fitted by a bi-normal selection model suggested by Hovgård et al. (1999):
where
t designates the transformed length (l/m).
the constant ψ is used for scaling the maximal selection to a value of 1.0 (ψ=1+b exp((k1-k2)2 / 2s22)+c).
the term ‘c’ accounts for random entangling (i.e. catches that are not mesh-size dependent).
The analyses were carried out using the regression framework setting β=0.5, assuming Poisson distributed errors. Analyses were made both including the fishing power effect and ignoring it by setting all fishing powers at 1.0. The results (Table 5.10) show that the model that takes differences in fishing power into account fits the data considerably better than that where the differences are ignored.
Table 5.9 Gillnet catches of cod taken in inshore areas of West Greenland, 1987–1993 (from Hovgård, 1996a).
| Length | Mesh size (cm) | ||||
| 3.3 | 3.7 | 4.8 | 5.6 | 6.8 | |
| 13 | 3 | 0 | 0 | 0 | 0 |
| 14 | 10 | 4 | 0 | 0 | 0 |
| 15 | 33 | 20 | 0 | 3 | 0 |
| 16 | 80 | 111 | 1 | 4 | 1 |
| 17 | 43 | 215 | 6 | 8 | 4 |
| 18 | 25 | 217 | 6 | 6 | 2 |
| 19 | 15 | 108 | 3 | 4 | 2 |
| 20 | 14 | 51 | 21 | 0 | 4 |
| 21 | 24 | 45 | 109 | 11 | 1 |
| 22 | 45 | 58 | 265 | 14 | 9 |
| 23 | 43 | 71 | 289 | 69 | 7 |
| 24 | 42 | 130 | 171 | 214 | 10 |
| 25 | 23 | 140 | 78 | 376 | 14 |
| 26 | 15 | 121 | 34 | 567 | 24 |
| 27 | 14 | 108 | 33 | 547 | 43 |
| 28 | 8 | 69 | 25 | 358 | 88 |
| 29 | 7 | 49 | 14 | 209 | 168 |
| 30 | 7 | 28 | 24 | 126 | 265 |
| 31 | 7 | 25 | 29 | 53 | 347 |
| 32 | 8 | 24 | 59 | 59 | 432 |
| 33 | 3 | 29 | 46 | 44 | 387 |
| 34 | 2 | 25 | 59 | 45 | 363 |
| 35 | 8 | 14 | 47 | 66 | 276 |
| 36 | 10 | 19 | 28 | 72 | 161 |
| 37 | 3 | 20 | 24 | 96 | 150 |
| 38 | 5 | 19 | 12 | 112 | 86 |
| 39 | 2 | 23 | 13 | 133 | 81 |
| 40 | 2 | 21 | 7 | 147 | 76 |
| 41 | 5 | 15 | 5 | 142 | 84 |
| 42 | 3 | 22 | 4 | 118 | 64 |
| 43 | 5 | 8 | 0 | 88 | 64 |
| 44 | 2 | 11 | 6 | 65 | 52 |
| 45 | 4 | 13 | 5 | 41 | 69 |
| 46 | 2 | 7 | 2 | 26 | 57 |
| 47 | 4 | 9 | 3 | 21 | 61 |
| 48 | 2 | 8 | 1 | 24 | 46 |
| 49 | 3 | 12 | 6 | 9 | 46 |
| 50 | 0 | 8 | 1 | 8 | 54 |
| 51 | 2 | 2 | 3 | 5 | 40 |
| 52 | 2 | 4 | 2 | 12 | 34 |
| 53 | 2 | 2 | 1 | 4 | 27 |
| 54 | 1 | 4 | 0 | 9 | 15 |
| 55 | 0 | 2 | 0 | 4 | 20 |
| 56 | 0 | 0 | 1 | 2 | 7 |
| 57 | 0 | 2 | 0 | 4 | 4 |
| 58 | 1 | 1 | 0 | 0 | 11 |
| 59 | 0 | 1 | 0 | 3 | 4 |
| 60 | 0 | 3 | 0 | 1 | 7 |
Table 5.10 Parameter estimates and sum-of-squares statistics for the two models used for analysing the Greenland cod data. Alpha is the exponent used for assigning relative fishing povers to the different nets.
| Parameters | Model 1 Power differed | Model 2 Power equal |
| k1 | 4.764 | 4.713 |
| k2 | 6.948 | 6.786 |
| s1 | 0.332 | 0.340 |
| s2 | 0.865 | 0.789 |
| b | 0.189 | 0.151 |
| c | 0.021 | 0.012 |
| α | 2.084 | 1.000 |
| Sum Sq. | 175.366 | 399.669 |
Including the fishing power term implies that the efficiencies of the five gillnets are estimated to range between 0.36 (the 4.8 cm mesh-size) and 1.0 (the 6.8 cm mesh-size). When including the fishing power terms, the selection curves differ with respect to the ‘height’, which represents the difference found in the catching efficiency (Figure 5.14).
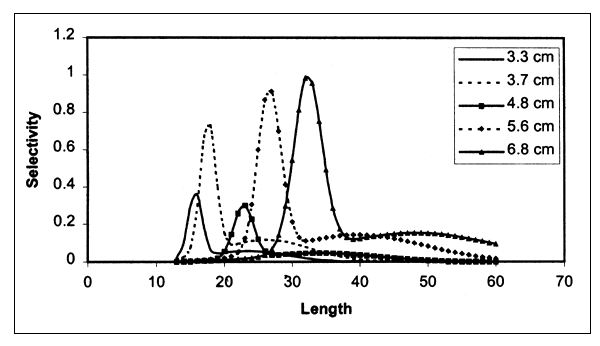
Figure 5.14 Estimated gillnet selection curves for the mesh sizes used in the Greenland inshore cod fisheries.
The number of works published on size selectivity of hooks is limited and about equally divided between studies on hand-lines and on longlines. For both gear types the contrast seen in the catch length frequencies taken at different hook sizes fished simultaneously is generally found to be small (e.g. Ralston 1982, Bertrand 1988, Punt et al. 1996, for hand-lines and Koike et al. 1968, Otway and Craig 1993, Erzini et al. 1996, for longlines). A pronounced size difference of the catches of yellowfin tuna (Thunus albacares) caught by different hook-sizes reported by Cortes-Zaragoza et al. (1989) appears to be based on port samplings where it cannot be ascertained that the different hook-sizes have in fact been fishing the same populations.
Løkkeborg and Bjordal (1992) reviewed hook selectivity and noted that bait size may be more important than hook size for determining the size of fish caught. Evidence for this view is found in Johannesen (1983) who studied the effect of hook and bait size on the size distribution in Norwegian catches of cod and haddock. The experiments showed that the differences in the catch size frequencies were more influenced by bait than hook size. Again, however, the effect of bait size, which varied between 10 and 40 g in the experiments, was relatively small.
For practical selection estimations, Erzini et al. (1996) note that the size structure of the population fished may delimit the possibilities for a full recognition of the selection effects. This may be illustrated by the work of Millar (1995) who performed formal statistical analysis of two hook experiments. Millar observed a considerable ambiguity regarding the shape of the, selection curve, as the observations could be equally well described by fundamentally different selectivity curves (e.g. by dome-shaped or sigmoid curves). The selection ranges (the size intervals over which selection differs) were in all models estimated to be very considerable, and it appears that the different selection curves were basically similar within the size intervals where the catch data were good. This indicates that the size distribution of the fish available was not sufficiently broad to allow a thorough evaluation of the shape of the entire selectivity curve.
A number of hook selectivity studies have been presented comparing two hook sizes. For this case Ralston (1992) provides a simple graphical approach for a first hand screening on which selectivity model should be chosen. This approach was discussed in Kenchington (1993). Millar (1995) notes that the screening procedure may be superfluous when adequate statistical approaches are available. For the two hook cases this may be done by his SELECT approach (Millar 1992). In general, the procedures used for gillnet selectivity estimations may all be used for analysing hook selectivity data. In Example 5.9, the estimation is done using the regression framework described in Section 5.4.2.
Example 5.9 Estimation of longline selection curves for cod
Longline catch data provided by by McCracken (1963) and corrected by Millar (1995) are given in Table 5.11. The hook-sizes, measured as gape width in centimetres are taken from Takeuchi and Koike (1969), who discussed McCracken's findings.
Three selection models are examined: Logistic, Log-normal and Two-sided model (see Table 3.1). Millar (1995) examines a number of other selection models. The three models provide fits of about equal quality, as measured by the SSQs with the two-sided model giving the best fit at the cost of an extra parameter (Figure 5.15).
Table 5.11 Catch information and selection curve estimation for the cod longline data provided by McCracken (1963). Model expressions are found in Table 3.1.
| McCracken's catch data | Parameter estimates and statistics | ||||
| Hook-size | 1.7 | 3.3 | Logistic | Model | |
| Length | |||||
| 31 | 2 | 0 | α | -11.02 | |
| 34 | 7 | 0 | β | 0.58 | |
| 37 | 16 | 0 | SSQ | 10.81 | |
| 40 | 14 | 1 | |||
| 43 | 30 | 0 | |||
| 46 | 28 | 3 | |||
| 49 | 28 | 2 | Log-normal | Model | |
| 52 | 36 | 4 | |||
| 55 | 32 | 10 | k | 3.62 | |
| 58 | 41 | 9 | s | 0.37 | |
| 61 | 26 | 17 | SSQ | 10.50 | |
| 64 | 23 | 9 | |||
| 67 | 27 | 14 | |||
| 70 | 22 | 13 | |||
| 73 | 16 | 12 | Two-sided | Model | |
| 76 | 16 | 11 | |||
| 79 | 6 | 10 | k | 25.56 | |
| 82 | 9 | 10 | s1 | 4.80 | |
| 85 | 3 | 8 | s2 | 30.45 | |
| 88 | 4 | 4 | SSQ | 9.94 | |
| 91 | 4 | 4 | |||
| 94 | 2 | 5 | |||
| 97 | 5 | 6 | |||
| 100 | 0 | 5 | |||
| 103 | 1 | 2 | |||
| 106 | 0 | 2 | |||
| 109 | 0 | 2 | |||
| 112 | 1 | 1 | |||
| 115 | 1 | 0 | |||
| 124 | 1 | 0 | |||
| 136 | 1 | 0 | |||
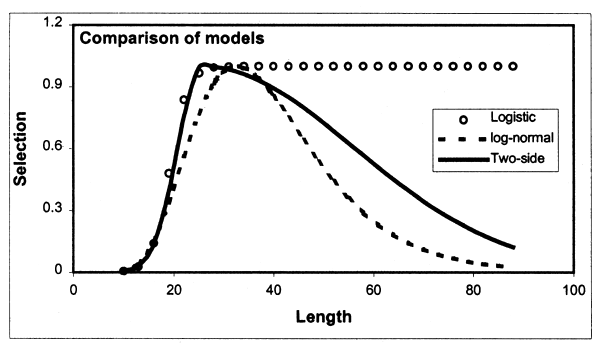
Figure 5.15 Three selection curves fitting the data, from Table 5.11.
Although the three estimated selection curves fit the data equally well, they differ considerable with respect to the selection of the larger fish. As noted by Millar (1995) we are left with the fundemental ambiguity as to whether the selection follows a bell-shaped or a sigmoid-shaped curve. Scrutinising the catch information suggests that an answer to this question would require high catches of fish above 80 cm. As these large fish were not abundant in McCracken's experiment, supplementary research would be needed. This could be in the form of an enlargement of the experiment providing more data in general. A more cost effective approach would be to select fishing grounds where the larger fish were more abundant or to choose hooks of smaller size in the area were the original experiments took place.
![]()
![]()
![]()