![]()
![]()
![]()
A fisheries sector profile may be considered an extended “frame survey”, where it has been attempted to describe all elements of the fisheries sector of an administrative division (a province) or the entire country, depending on the size of country.
A fisheries sector profile contains:
Summary of the detailed catch and effort data in the fisheries database managed by the directorate of fisheries (the database of this manual).
Additional data, relevant to management and development of the fisheries sector, which is not in the catch effort database.
The additional data can often be found in other databases. They are not data collected by the programme described in this manual, but a recompilation of existing data.
The fisheries sector profiles are used by several groups of fisheries workers:
Fisheries managers for an overall update of their background knowledge of the sector.
Decision makers in fisheries (politicians and governments) for general background knowledge.
Designers of data collection programme for stratification purposes.
The fishing industry.
The public in general.
Below follows a tentative checklist of additional data, which may or may not be included in the fisheries sector profiles, dependent on the local situation. The list may be supplemented and/or be reduced, to meet local needs.
| CHECK-LIST OF FISHERIES PROFILE INFORMATION | ||
| CATEGORY | SUB-CATEGORY | DETAILS |
| Map of province and provincial waters | Part of map covering land | Capital and major cities |
| Districts, with major city | ||
| Major rivers | ||
| All major ports | ||
| All major landing places | ||
| Larger fishing villages | ||
| Major roads | ||
| Location of major fish processing industries | ||
| Location of other major industries of relevance to fishing sector | ||
| Part of map covering sea | Borders of provincial waters | |
| Depth contours, bottom types | ||
| Fishing grounds | ||
| Abundance of fish species of major commercial interest. | ||
| Fisheries regulation boxes (e.g. areas closed for all fishing, trawling etc.) | ||
| Key figures of province (state or country): | Population | Total population |
| Population by district (Table) | ||
| Population of fishers and families by district (Table) | ||
| Population of fisheries support personnel by district (Table) | ||
| Sociological parameters | Demographic data (age distribution, family size,…) | |
| Religion | ||
| Ethnic groups | ||
| Education | ||
| Women's position in society | ||
| Sanitary, housing and health situation | ||
| Fishers standard of living in general | ||
| Income per capita | ||
| Fishers alternative occupations | ||
| Geography | Area of provincial waters | |
| List of coastal districts (Table) | ||
| Length of coastline, total and by district (Table) | ||
| Road system | ||
| Main industries | List of main industries in province (summary employment and value of production) | |
| Political system | Structure of local governments, councils, committees, decision makers in general | |
| Relationship between local and central administration. | ||
| Sources of income to local administration | ||
| Local legislation contra central legislation | ||
| Representation of central administration | ||
| Administrative structure | Province/government institutions | |
| Administration | ||
| Departments, authorities etc. | ||
| Local fisheries administration | Structure of fisheries administration | Structure of provincial fisheries administration |
| Structure of district fisheries administration | ||
| Collaboration with central directorate of fisheries | ||
| Registration | Registration of vessels at central, province and district level. | |
| Registration of fishers at central, province and district level. | ||
| Local data collection | Local fisheries data collection (coverage, data sources, etc) | |
| Collection of landings statistics | ||
| Collection of effort statistics | ||
| Tax, fee, duties and subsidies to fisheries | Taxation in general and for fisheries sector in particular | |
| Fees/duties related to fisheries | ||
| Fisheries licence system | ||
| Safety | Inspection of fishing vessels for safety reasons | |
| Fisheries management | Management of fisheries | |
| Fisheries regulation | ||
| Enforcement of fisheries regulation | ||
| Compliance with fisheries regulation | ||
| Development | Development of fisheries (local initiatives and central initiatives) | |
| Decommission of fishing vessels and other fisheries investments | ||
| Education/training of fishers | ||
| Fisheries extension service (subsidies/support given to fisheries) | ||
| Inspection of sea products | Quality control of landings | |
| Post harvest regulation | ||
| Inspection of processing plants | ||
| Weather forecasts | Meteorological information service | |
| Literature | List of literature on fisheries sector of province | |
| Other regulation, control or inspection | Coast guard/Harbour police | Authority and responsibility |
| Legal power of authority | ||
| Personnel | ||
| Equipment (vessels etc.) | ||
| Stations and sub-stations | ||
| Number of inspectors | ||
| Registrations | ||
| Security | ||
| Surveillance | ||
| Collaboration with directorate of fisheries (local and central) | ||
| Harvesting sector | Overall structure | List of fleets and number of units in each fleet |
| Artisanal Fleets | Specify for each major artisanal and industrial fleet and other fishing devices: | |
| Industrial fleets | ||
| Other fishing devices (fixed gears etc.) | ||
| Fleet structure (number of vessels by fleet) | ||
| Type of construction (material of hull) | ||
| Gear(s). (primary gear and secondary gear(s)) | ||
| Average dimension of vessels (length, depth, width) | ||
| Average engine power (HP) | ||
| Average crew size | ||
| Hold capacity | ||
| Means of preservation of catch | ||
| Ownership | ||
| Navigation equipment | ||
| Fish finding equipment | ||
| Communication equipment | ||
| Fishing techniques (light attraction, bait, FAD etc.) | ||
| Group fishing (e.g. pair trawling) | ||
| Processing of catch onboard (e.g. drying, cooking) | ||
| Description of fishing trips | ||
| Description of catching techniques | ||
| Description of landing procedure | ||
| Description of sale of landings | ||
| Description of discarding | ||
| Target species (groups) and bycatch species (groups) | ||
| Sharing of profit | ||
| Average income of fishers | ||
| Seasonality of fishing | ||
| Fishing grounds by season (migration of vessels) | ||
| Base port(s) by season | ||
| Investments in an average vessel of fleet | ||
| Credit schemes (for investments in fleet) | ||
| Routinely maintained records (notebooks, logbooks, sale-slips, accounting, etc.) | ||
| Fishers organisations | Organisation | Number of members (percent of total) |
| Legal status | ||
| Activities of organisation | ||
| Power relative to government and industry | ||
| Fee for membership | ||
| Landing places | Landing place | Name of landing places |
| Landings by fleet and commercial group | ||
| Roads to landing places (Table) | ||
| Facilities on landing place | ||
| Population in landings place | ||
| Fish markets | ||
| Transport system | ||
| Storage of sea products | ||
| Export | ||
| Relative importance of fishery | ||
| Distribution of sea products on domestic market | ||
| Mari culture | Summary description | Location and type of mariculture |
| Products | List of species and processing (if any) | |
| Annual production | Annual production in value and weight and as percentage of compatible capture production | |
| Inland fisheries | Summary description | Main species and production |
| Processing sector | Processing plant | Production (quantity and quality) |
| Employment | ||
| Ownership | ||
| Relationship to harvesting sector | ||
| Relationship to merchants | ||
| Import/Export | ||
| Fisheries support industry sector | Ship yards | Type of ship yard |
| Annual production of fishing vessels(number of vessels and tonnage) | ||
| Employment | ||
| Ownership | ||
| Repair shops | Annual production and employment | |
| Ice plants | Annual production and employment | |
| Gear manufacturing | Annual production and employment | |
| Merchants structure | Merchant or group of merchants | Relationship to fishers |
| Hierarchy of merchants | ||
| Merchant's ownership of vessels | ||
| Type of sea products purchased | ||
| Relationship to processing sector | ||
| Involvement in export and/or sale on domestic market | ||
| Loans to fishers | ||
| Fishing companies | Fishing company | Name and location of fishing company |
| Ownership | ||
| Number and types of vessels | ||
| Employment (land and sea based) | ||
| Annual production in weight and value | ||
| Relationship to processing sector | ||
| Co-operatives | Co-operative | Type of co-operative |
| Number of vessels | ||
| Number of fishers | ||
| Activities | ||
| Members contribution (fee, investment, share of profit) | ||
| Annual production in value and weight | ||
| Joint ventures | Joint venture | Type of joint venture |
| Number of vessels | ||
| Number of fishers | ||
| Activities | ||
| Contribution (fee, investment, share of profit) | ||
| Annual production in value and weight | ||
| Local History of fishery | Time series of number of vessels. | |
| Time series of production, effort and CPUE | ||
| Historical assessments of fisheries sector and resources | ||
| Other historical statistic of fisheries | ||
| Future of local fishery | Development plans | |
| Literature on provincial fisheries sector not included elsewhere | ||
The “FDDB” (Fisheries Demonstration DataBase) was constructed as a tool for teaching the theory and practice of fisheries databases. It was used by the author in the implementation of a fisheries database for Viet Nam's commercial marine capture fishery, the “VIETFISHBase”. FDDB is a simplified and reduced version of VIETFISHBase. However, FDDB contains all the essential features of the commercial fishery part of the database, except for spatial information, such as landing places and fishing grounds by statistical rectangles and divisions of rectangles. Nor does FDDB contain information about landing places or gears. Only “provinces” and “fleets” are considered.
This Section is presented as an example and it aims only at introducing the basic principles of fisheries databases to those who have not got experience in fisheries databases. By working through the example, you should be in better position to understand a full-scale fisheries database, which is a complex system.
FDDB is implemented in ACCESS (the database module of Microsoft Office, see Section 6.2). The database application contained a full set of data and the forms of FDDB. The FDDB was created exclusively using “wizards”. Wizards are utilities for easy generation of simple applications.
FDDB comprises 10 Tables, of which 5 are look-up tables (see Figure 6.10.1). The names assigned to tables and fields of tables (columns) are assumed to be self-explanatory (It is recommended always to use more or less self-explanatory names of fields and tables).
The look-up tables all start their name with “L_”. Except for the vessel register, the only purpose of the look-up tables is to translate a code into a name in the English language. The vessel register contains another type of information, namely the definition of fleets, as it assigns each vessel to a fleet.
The field “"LgtUnit” indicates the length measurement unit, such as “MM” or “CM”, and could also have had a look-up table associated with it. However, as this is a small static list of values, it will appear as a “List-box”, which is fixed and cannot be changed easily.
All field names starting with “ID_” are keys. Whenever they appear as the first field in a table, they are unique keys for that table. All the relations are “one-to-many-relations”, between the key-fields. The other fields are “data”, such as landings and effort. Tables 6.10.2–6 present a complete example of the tables with data.
Note the hierarchy of data tables
1st Level in hierarchy: Table: “Interview”, key “ID_Interview”
2nd Level in hierarchy: Table: “Commer_Gr_Weigth”, key: “ID_CommGr_Wgt”
3rd Level in hierarchy: Table: “Species_Composition”, key: “ID_Spec_Comp”
4th Level in hierarchy: Table: “LgtFrq”, key: “ID_LgtFrq.”
Each relationship is “one-to-many” downwards in the hierarchy. The links are from the first (unique) key in the higher level to the second field in the lower hierarchical level.
Figure 6.10.1 Tables and relations of FDDB.
 | Figure 6.10.2 shows the main menu of the FDDB. There are two options for entry of data, namely “Interview data” and “Frame survey data”. Then there is one option for reports, which in turn leads to a new menu with many options. The FDDB menu for reports contains only the administrative reports, as the exercise behind the present annex is to create the reports, using the SQL language. “About FDDB” is a short description of the software. |
| Figure 6.10.3 shows a list of the controls of the FDDB forms, that is “buttons” you can “click” on with the mouse, to instruct the FDDB. These controls are the standard Windows controls. It is tacitly assumed that the reader is already (more or less) familiar with these controls from other software packages. | |
| Figure 6.10.2 The main menu of FDDB |
 | Close form. Go back to the foregoing form. |
 | Delete record (row in a table). |
 | Display/print table (report control, see Fig. 6.10.7) |
 | Change from interview form to length frequency form |
 | Show Look-Up table. Select item from the list, to enter in a field of a row. |
 | Scroll bar. Navigate between rows in a table. Navigate on the screen. |
 | Go to next record |
 | Go to last record |
 | Add new record |
 Record selector Record selector | |
 | Record (row) pointer Pointer to new record (row) |
Figure 6.10.3 Controls of the forms.
Figure 6.10.4 shows the form for entry of interview data, which actually contains three forms, “INTERVIEW”, “WEIGHT OF COMMERCIAL GROUP” and “SPECIES COMPOSITION” organised in a hierarchy, as illustrated in Figure 6.10.5. “Hierarchy” means here that you cannot fill in a form before all forms “higher up in the hierarchy” have been filled in. The “SPECIES COMPOSITION” form contains a control “LgtFrq” (Length Frequency). By clicking on “LgtFrq” you enter the “LENGTH FREQUENCY” form, which is the form on the fourth level in the hierarchy. Thus, the interview forms contain the structured hierarchically:
1st level in Hierarchy: “INTERVIEW”
2nd level in Hierarchy: “WEIGHT OF COMMERCIAL GROUP”
3rd level in Hierarchy: “SPECIES COMPOSITION”
4th level in Hierarchy: “LENGTH FREQUENCY”
Level 1 always has to be filled in to create a record in the database, but then you may fill in from zero to any number of level 2 forms. For each level 2 you may fill in from zero to any number of “species composition forms”, and for each of them any number of “length frequency forms”. Each form corresponds to one record. The length frequency form (Figure 6.10.6) is actually a list of forms, as each line corresponds to a record.
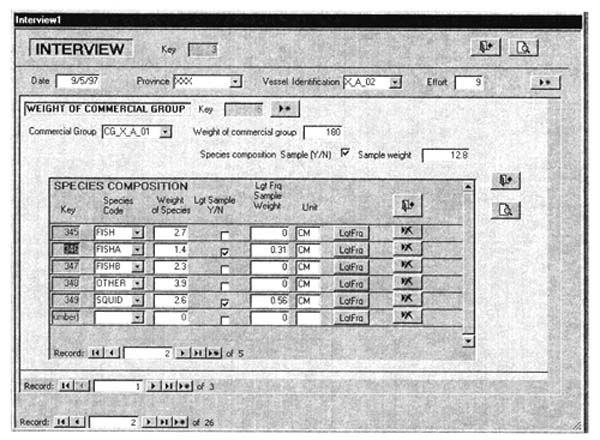
Figure 6.10.4 Interview form
Figure 6.10.5 The hierarchical structure of interview sub-forms
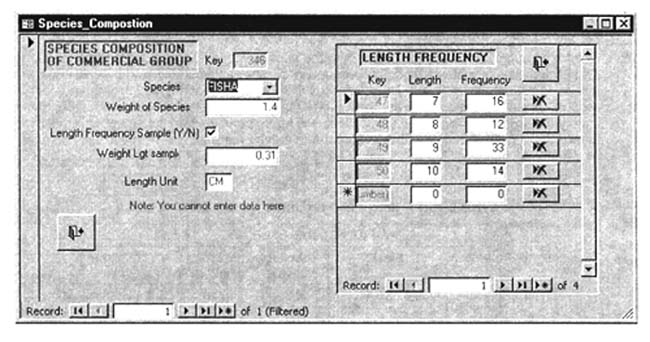
Figure 6.10.6 Length frequency form.
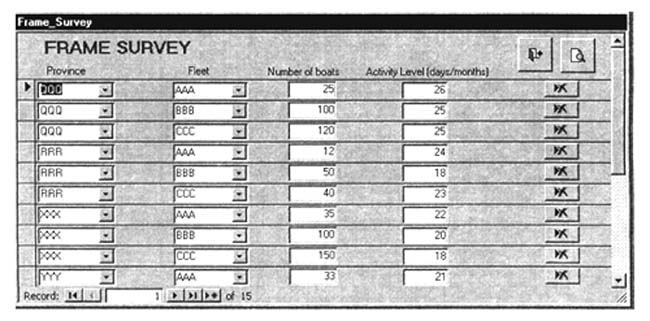
Figure 6.10.7 Frame survey form
 | The effect of the “report” control is shown in Figure 6.10.7, which shows the complete set of input data to the frame survey. The table also shows the subtotal and the estimated total number of boat days per month (= (number of boats) * (Fishing days/month)). |
The forms show the key (in the actual implementation of FDDB as red characters on blue background, whereas other characters are in black and white). Normally, keys are used for the internal bookkeeping of the database, and are of no immediate interest to the user. Keys, which are (arbitrary) numbers, will normally not be shown on the forms. When they are shown on the screen forms of FDDB, it is to demonstrate the structure of the database. Keys, which are also codes, (for example the vessel code) can be of interest to the user, and they will usually be shown on the screen.
The frame survey is executed in parallel to the interviews (see Table 6.10.1), thus it is not a part of the hierarchy of landings data. As appears from Tables 6.10.1 and 6.10.2, there are five provinces and three fleets. This generates 5*3 = 15 combinations, which is the number of records (rows) in the frame survey table (see Table 6.10.2). In this simplified example, there is only one frame survey. In a realistic case, the frame survey would be repeated regularly, if infrequently. With 15 records, the present frame survey represents a complete enumeration. The interview samples, however, are sampled only from three of the five provinces, as can be seen from Table 6.10.3.
Table 6.10.1 Frame survey report showing the input data
| INPUT TO FRAMESURVEY | ||||
|---|---|---|---|---|
| ID_Province | Fleet | Number of boats | Fishing days/month | Total fishing days |
| QQQ | AAA | 25 | 26 | 650 |
| BBB | 100 | 25 | 2500 | |
| CCC | 120 | 25 | 3000 | |
| Total Province | 245 | 6150 | ||
| RRR | AAA | 12 | 24 | 288 |
| BBB | 50 | 18 | 900 | |
| CCC | 40 | 23 | 920 | |
| Total Province | 102 | 2108 | ||
| XXX | AAA | 35 | 22 | 770 |
| BBB | 100 | 20 | 2000 | |
| CCC | 150 | 18 | 2700 | |
| Total Province | 285 | 5470 | ||
| YYY | AAA | 33 | 21 | 693 |
| BBB | 70 | 17 | 1190 | |
| CCC | 21 | 19 | 399 | |
| Total Province | 124 | 2282 | ||
| ZZZ | AAA | 63 | 25 | 1575 |
| BBB | 47 | 28 | 1316 | |
| CCC | 59 | 27 | 1593 | |
| Total Province | 169 | 4484 | ||
| ALL PROVINCES | GRAND TOTAL | 925 | 20494 | |
Table 6.10.2 Example of tables with data of FDDB
Look-Up: Fleet-Names
| ID_Fleet | Fleet Name |
|---|---|
| BBB | Fleet 1 |
| CCC | Fleet 2 |
| AAA | Fleet 3 |
Look-Up: Species Names
| ID_Species | Name of species |
|---|---|
| FISH | A fishy fish |
| FISHA | Another fishy fish |
| FISHB | Flatfish |
| FISHC | Roundfish |
| OTHER | Whitefish |
| SQUID | Octopus |
Look-Up: Commercial groups
| ID_CommGroup | Comm Gr Name |
|---|---|
| CG_X_A_01 | Comm. Gr. 1 |
| CG_X_A_02 | Comm. Gr. 2 |
| CG_X_A_03 | Comm. Gr. 3 |
| CG_X_B_01 | Comm. Gr. 4 |
| CG_X_B_02 | Comm. Gr. 5 |
| CG_X_C_01 | Comm. Gr. 6 |
| CG_X_C_02 | Comm. Gr. 7 |
| CG_Y_A_01 | Comm. Gr. 8 |
| CG_Y_A_02 | Comm. Gr. 9 |
| CG_Y_A_03 | Comm. Gr. 10 |
| CG_Y_B_01 | Comm. Gr. 11 |
| CG_Y_B_02 | Comm. Gr. 12 |
| CG_Y_C_01 | Comm. Gr. 13 |
| CG_Y_C_02 | Comm. Gr. 14 |
| CG_Z_A_01 | Comm. Gr. 15 |
| CG_Z_A_02 | Comm. Gr. 16 |
| CG_Z_A_03 | Comm. Gr. 17 |
| CG_Z_B_01 | Comm. Gr. 18 |
| CG_Z_B_02 | Comm. Gr. 19 |
| CG_Z_C_01 | Comm. Gr. 20 |
| CG_Z_C_02 | Comm. Gr. 21 |
(Note: Commercial groups are fleet and province specific)
Look-Up: Province Names
| ID_Province | Province Name |
|---|---|
| XXX | Province 1 |
| YYY | Province 2 |
| ZZZ | Province 3 |
| QQQ | Province 4 |
| RRR | Province 5 |
(There are 5 provinces in the country)
| (Not complete) | VESSEL REGISTER |
| ID_Vessel | Fleet |
| X_A_01 | AAA |
| X_A_02 | AAA |
| X_A_03 | AAA |
| X_B_01 | BBB |
| X_B_02 | BBB |
| X_B_03 | BBB |
| X_C_01 | CCC |
| X_C_02 | CCC |
| Y_A_01 | AAA |
| Y_A_02 | AAA |
| Y_A_03 | AAA |
| Y_B_01 | BBB |
| Y_B_02 | BBB |
| Y_B_03 | BBB |
| Y_C_01 | CCC |
| Y_C_02 | CCC |
| Z_A_01 | AAA |
| Z_A_02 | AAA |
| Z_A_03 | AAA |
| Z_B_01 | BBB |
| Z_B_02 | BBB |
| Z_B_03 | BBB |
| Z_C_01 | CCC |
| Z_C_02 | CCC |
(First letter indicates province)
FRAME SURVEY
| Province | Fleet | Number of boats | Activity Level | Interview samples |
| XXX | BBB | 100 | 20 | |
| XXX | CCC | 150 | 18 | |
| XXX | AAA | 35 | 22 | |
| YYY | BBB | 70 | 17 | |
| YYY | CCC | 21 | 19 | |
| YYY | AAA | 33 | 21 | |
| ZZZ | BBB | 47 | 28 | |
| ZZZ | CCC | 59 | 27 | |
| ZZZ | AAA | 63 | 25 | |
| QQQ | BBB | 100 | 25 | No interviews sampled |
| QQQ | CCC | 120 | 25 | |
| QQQ | AAA | 25 | 26 | |
| RRR | BBB | 50 | 18 | |
| RRR | CCC | 40 | 23 | |
| RRR | AAA | 12 | 24 |
![]()
![]()
![]()