0046-B1
A. Ismariah[1], E. Zivot and J. Perez-Garcia
The loss of tropical forests, home of the majority of the world's terrestrial and fresh-water biodiversity is a concern to the international community because of large-scale clearing and net land-use flux of carbon from the terrestrial ecosystem. Commercial logging in virgin tropical rainforests has generated nearly as much concern as has deforestation. Among the issues is how much compensation should be offered to a developing country not to log its virgin rainforests. The study incorporates ecological data on carbon storage in virgin and second-growth forests and uses a model to analyze logging and greenhouse gas emissions tradeoffs. The study analyzes the impacts of alternative scenarios of logging and forest conversion upon forest product output, employment, and social surplus in domestic wood processing industries and upon net carbon emissions. The model for Malaysia, a key player in the international tropical timber market, is useful as a prototype for other tropical timber producers.
Claims that harvests rates in tropical timber-producing countries far exceed the sustainable rates generate nearly as much concern as has deforestation. Moreover harvests in tropical timber exporting countries have followed a boom-and-bust pattern (Vincent 1992). It could be in the tropical timber-producing country's best interest to reduce harvests to longer-term sustainable levels. Reductions might be possible if the reduced harvest generated significant global benefits related to lower CO2 emissions or other public goods at least as large as compensation costs paid to the tropical timber-producing countries.
The paper addresses one aspect of forestland use in tropical rainforests: the impact of a harvest policy on the forest-sector economy and on CO2 emissions. The analysis estimates the greenhouse gas emission trade-off in logging for Peninsular Malaysia (PM), a key player in the international tropical timber trade. We also estimate the cost of the harvest restriction policy in terms of the losses to government revenue; foreign exchange earnings, and employment in domestic timber processing industry; and the net change in producer’s and consumer’s surpluses in the domestic and export markets for forest products.
We construct a model that allows us to impose a reduced harvest policy and compare results with a current harvest policy. The forest sector model comprises two sub-models: the forest and the industry sub-models. The forest sub-model is the physical stock account of timber inventory and annual log flow. The industry sub-model comprises three major timber products: (i) logs, (ii) sawnwood and (iii) plywood, manufactured from tropical hardwood timber. The model solves for the economic equilibrium using timber as an input to the manufacturing sectors. The detail account of the model component, assumptions, estimation and simulation procedures, are found in Ismariah (2001). The reduced harvest policy is achieved by reducing the level of forest inventory available for harvest. In the Malaysian context, it is analogous to regulating the annual allowable cut to reflect a lower cutting rate.
The timber physical accounts keep track of areas of forest and stock of timber. It calculates the net change in timber stock disaggregated by virgin (primary or unlogged) and logged forest (secondary or logged-over forests). The construction of the timber account follows the method and accounting procedure found in Economic Planning Unit Malaysia (1994) and Vincent et.al. (1997). Timber inventory in period t + 1 is defined as:
I t+1 = It + G t + H t - D t - R t
Where, I t+1 is the closing inventory, It is the opening inventory, G t is timber growth, H t is timber harvest, D t is the stock destroyed in deforestation, and R t is other stock reductions such as damages during logging and fires, or forest degradation. The accounts are generated for the period 1970-1996.
We convert timber into carbon using conversion factors for timber stocks to biomass drawn from the Economic Planning Unit (1994) report, which utilizes Brown, Lugo, and Iverson (1994). The conversion factors are specific to the data in the National Forest Inventories 1 and 11 (NFI1 & NFI2) for Peninsular Malaysia. The factors are 3.39 and 3.60 tons/m3 in primary forests in 1972 and 1981, and 4.17 and 5.03 tons/m3 in secondary forests in the same two years. We continue to apply the conversion factor for 1981 for both forest types to calculate carbon content for the rest of the period. To convert from biomass to carbon, we divide the biomass weight by two, since 50% of the biomass is made up of carbon (Brown, Lugo & Iverson 1994).
To value a ton of carbon emission, we utilize expected values from US$5 to US$20 per ton for the next decade and from US$7 and US$27 per ton in three decades (see Chapter 6 of the IPCC WGIII report (IPCC 1996), Social Costs of Climate Change). Since the values represent the price in 2000, they are discounted to estimate the prices in specific years during 1970-1996. The US dollars is converted to Malaysian ringgit using the 1970 exchange rate, and then deflated using the CPI (1980=1). We generate a stream of prices for 1970-1996 and accordingly convert them to M$.
An upper level emission refers to a net release of carbon from the entire amount of a negative net change in the timber stock. The lower level emission estimate is generated from a negative net change and adjusted to account for timber products -sawnwood and plywood, converted from timber harvest, which store carbon thus delay the carbon emission.
The industry sub-model comprised of a system of demand and supply equations for logs sawnwood and plywood in five market sectors.
Our demand equations are estimated assuming cost minimization and a Cobb-Douglas functional form with constant returns to scale (Cardellichio and Kirjasniemi 1987). This leads to the following log-log generalized demand equation for each final product:
|
|
1.1 |
where Qit is the quantity of product i (i =1,..., N) consumed during period t (t=1,...,T); Pit is the real price (1980 =100) of product i in Malaysian ringgit during period t; yit is the end-use indicator of product i (for example for sawnwood is construction activity) during period t; mit is the error term; bi and qi are parameters.
For the domestic market, available data limits the end-use to construction activities and to the manufacturing of furniture and molding. For sawnwood and plywood export demand, a wider range of end-use activities depending on the importing region, is available.
Similar theoretical background was applied to the product supply equations. In addition, the model assumed the product supply specification as in Cardellichio et.al. (1989). The specification takes the following form:
|
P-C = F(U) |
(1.2) |
|
P=C+a* Ub |
(1.3) |
|
U = Q/K-1 |
(1.4) |
where P is the product price; C is the production cost; U is capacity utilization; Q is the product output; K -1 is the production capacity at the end of the previous year. The generalized supply equation derived for each product is then:
|
|
(1.5) |
where, Pit is the real price (1980 =100) of product
i (i =1,..., N) in Malaysian ringgit during period t(t=1,...,T); Qit
is the quantity of product i (i =1,..., N) produced during period t
(t=1,...,T); is the real
price (1980 =100) of variable inputs used in the production of product i (i
=1,..., N) during period t (t=1,...,T); mit is the error term;
is the real
price (1980 =100) of variable inputs used in the production of product i (i
=1,..., N) during period t (t=1,...,T); mit is the error term;
 ,
,
 and
and
 are parameters.
The industry sub-model comprised of 11 equations and 11 endogenous variables: log supply, the supply and demand for sawnwood and plywood in the domestic and export markets. We estimate the equations using two-stage least squares (2SLS) and annual data for the period 1970-96 using Eviews software. The model is first validated for quality of fit, economic reasonableness, and stability.
Logging activities and deforestation will affect the inventory of timber stock. Reducing the forest inventory available for harvests influences the economics of timber supply and impact the production, consumption, prices, and trade of forest products. The impacts are then simulated by linking the changes in the timber inventory in the forest sub-model with the sub-model of the forest industry.
The base case is the historical values for the exogenous variables. It provides a base line for which to compare other simulations. The policy variable is the timber inventory. All other variables are held at their historical values except for the values of timber inventory and the corresponding ratio of cut (harvest) over inventory in timber supply equation.
Based on a study of timber supply by International Tropical Timber Organization (ITTO) (ITTO 1993), the estimated levels of sustainable harvests from PM’s natural forest during 1995 and 1996 were about six million and four million m3 respectively (Ismariah 2001). The forest sector is simulated until we achieved the sustainable harvests targets in respective years. We found that a 45 % and 55% total inventory rundown between 1990 and 1996 leads to a total harvest of about 6.0 million m3 in 1995 and 4.0 million in 1996 respectively.
The estimates of the model are presented in Ismariah (2001). The model meet a priori expectations and all of the estimated coefficients in the supply and demand equations have the expected signs.
In the base case, production of logs, sawnwood and plywood in 1995 was 9.5, 5.2, and 1.1 million m3. Out of the total log production about 7.9 million m3 is consumed in the sawmills and the remainder in plywood mills. Table 1 presents the results of the simulations on the quantities and prices of log, sawnwood, and plywood. With a 45% reduced inventory simulations, log harvests in 1995 declined by 37% from the base case to 6 million m3. This production level is the equivalent of the sustainable harvest level for Peninsular Malaysia in 1995. As fewer logs were available, sawnwood and plywood production in 1995 declined by 29% and 42% from the base case respectively. The results further indicate that the decline in timber harvests led to a decline of about 20% in domestic sawnwood consumption. Correspondingly, log, sawnwood and plywood domestic prices increased by 80%, 95%, and 37% respectively due to the relatively inelastic demand curves. In all cases there are consistent declines in production, consumption and export volumes and corresponding increases in log, sawnwood and plywood prices in all market sectors following the 55% reduction in the inventory.
TABLE 1: Change in Quantity and Prices from Reduced Harvest Policy (1995)
|
Quantities |
|
Difference from Base Case (%) |
||||
|
Inventory reduction |
|
45% |
55% |
|
|
|
|
|
L |
SW |
PLY |
L |
SW |
PLY |
|
Production |
-37 |
-29 |
-42 |
-48 |
-37 |
-50 |
|
Consumption |
-37 |
-19 |
-33 |
-48 |
-26 |
-44 |
|
Exports |
|
-54 |
-22 |
|
-66 |
-29 |
|
Prices |
|
Difference from Base Case (%) |
||||
|
Inventory reduction |
|
45% |
55% |
|
|
|
|
|
L |
SW |
PLY |
L |
SW |
PLY |
|
Domestic |
80 |
95 |
37 |
129 |
157 |
57 |
|
Export |
|
44 |
23 |
|
68 |
34 |
Note: L =saw log; SW= sawnwood; PLY= Plywood.
We calculate the change in timber royalty and total revenue from royalty, premium and silvicultural cess together. The impact on government revenue is approximated by an average timber royalty rate (MR/m3) for all species in the peninsula times the change in harvest level. The same method is used to calculate the impact on total revenue from the premium, and silvicultural cess. In turn, the impact of the policy on sawnwood and plywood export earnings are derived by multiplying the change in the export prices with the change in quantities.
A reduction of 45 % in timber inventory reduces timber royalty collected by the forest sector by M$ 78 million in real term or by 49% from the base case (Table 2). Reducing the inventory level by 55% causes a decline in timber royalty by 58%. In terms of total revenue, a 45% inventory restriction reduced the revenue by M$ 362 million or by 64% from the base case. The corresponding change in total revenue following a 55% inventory restriction was 70% respectively.
Total export revenue in 1995 is estimated at M$ 2.7 billion in which 70% is from sawnwood export. A 45% inventory reduction led to a decline in the combined export earning in 1995 by 25% to M$. 2.0 billion. The decline in sawnwood export was 33% while for plywood was only 4%. The decline in sawnwood export revenue is greater due to considerable decline in export quantity and a moderate increase in export prices.
TABLE 2: Change in Government Revenue and Export Earnings
|
Revenue |
Million M$ |
Difference from Base case (%) |
|||
|
Inventory Reduction |
45% |
55% |
|
45% |
55% |
|
Timber Royalty |
-78 |
-92 |
|
-49 |
-58 |
|
Total Revenue |
-362 |
-397 |
|
-64 |
-70 |
|
Export Earning |
Billion M$ |
Difference from Base Case (%) |
|||
|
Inventory Reduction |
BC |
45% |
55% |
45% |
55% |
|
Sawnwood |
1.9 |
1.3 |
1.1 |
-33 |
-43 |
|
Plywood |
0.8 |
0.75 |
0.74 |
-4 |
-5 |
|
Total |
2.7 |
2.0 |
1.8 |
-25 |
-32 |
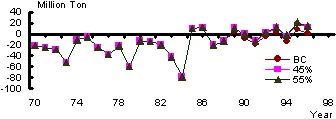
Peninsula’s forest biomass during 1970-1996 period declined by 43%. Accordingly, the stock of carbon found in timber in PM’s forest during the same period declined by almost the same percentage from 1.7 billion tons in 1970 to 0.9 billion tons in 1996. In turn, the amount of carbon released to the atmosphere is shown by the net change in carbon stock. The negative values of net change translate to the amount of carbon released to the atmosphere while the positive values are the amount of carbon sequestered by the forest. The trend indicates emission during the 1970’s and early 1980’s. The situation reversed after the recession in 1985. Deforestation and logging during the earlier period released carbon into the atmosphere.
With a 45% reduction in harvestable inventory, the amount of carbon stock increases from the base case by 1.2% during 1990-1996 (Figure 1). During the 1990-1996 period there is a decline in the amount of CO2 released to the atmosphere. Carbon emission to the atmosphere in the base case averaged around -4.37 million ton per year, trending upward however. In summary during 1990-1996 period total net emission was -31, 27, and 38 million ton, in the base case, at 45%, and 55% reduced inventory levels, respectively. The results indicate that Malaysian forests became a sink of carbon.
FIGURE 1: Change in CO2 emissions
We calculate the value of net carbon emission according to US$5 and US$20 per ton carbon. The simulations indicate that by reducing timber harvests, Peninsular Malaysia’s forest is providing the carbon storage service to the world. On average, at 45% inventory reduction, the value of carbon storage during 1990-1996 periods according to $5 case was M$0.11 billion per year, and $20 case, M$0.4 billion per year. Moreover, the trends indicate that the highest value of carbon storage according to all simulations was in 1995. Carbon storage in 1995 according to the base case and the two valuations was worth between M$ 0.2 and M$0.7 billion. With a 45% inventory reduction the value increased between M$0.5 and M$1.8 billion, at 55% carbon storage was worth between M$ 0.6 and M$2.1billion.
Conversely, there is a cost for the carbon storage that is calculated as forgone revenues for the forest sector. At 45% inventory reduction the estimated total loss to the forest sector was M$ 2.1 billion and at 55%, was M$ 2.8 billion.
The estimates of the value of carbon storage provide Malaysia’s policymaker with estimates of the amount of compensation that the nation could expect to receive from the rest of the world in return for the forest carbon sink service. Table 3 summarizes Malaysia’s gain and loss associated with the policy of reducing timber harvest to a sustainable level as recommended by the ITTO.
TABLE 3: Malaysia’s Loss and Gain From Reduced Harvest policy.
|
Inventory Reduction |
45% |
|
55% |
|
|
|
Forest Sector Forgone Benefit (1995) (Billion M$) |
2.05 |
|
2.79 |
|
|
|
|
45% |
|
55% |
|
|
|
Carbon Storage Value (Billion M$) |
$5 |
$20 |
$5 |
$20 |
|
|
1995 |
.50 |
1.83 |
0.56 |
2.06 |
|
|
1990-96 |
Mean |
0.10 |
0.38 |
0.14 |
0.52 |
|
1990-96 |
Total |
0.73 |
2.65 |
1.00 |
3.64 |
The table indicates that in both simulations of reduced timber inventory and in terms of monetary value, the total loss to peninsula’s forest sector economy is larger than the gain in carbon storage under the $5 scenario. Under the $20 scenario the value of carbon surpasses the revenues foregone from timber production.
As timber is withdrawn from the market, timber and product prices rise, with substantial increase in the case of sawnwood in the local and export sectors. The sustainable harvest policy tends to generate a moderate increase in forest biomass and carbon storage in Peninsular Malaysia’s forest. The valuation of carbon sink in this study indicates carbon values in excess of $5 per ton are needed to compensate for reduction in timber availability. Higher values are required if further processing costs and non-wood substitution is accounted for. From a policy perspective, our results provide a benchmark against which other imputations of monetary value of net CO2 emissions from tropical forests may be gauged.
Adams, D.M. and R.W. Haynes 1987. Interregional modeling. In M.Kallio, D.P.Dykstra, and C.S.Binkley (Editors), The Global Forest Sector: An Analytical Perspective, John Wiley & Sons, New York. Pp.391-413 (Chapter16).
Brown, S., L. Iverson, and A. Lugo. 1994. Land -use biomass changes of forests in Peninsular Malaysia during 1972-1982: use of GIS analysis. In Effects in Land -use Change on Atmospheric CO2 Concentrations: Southeast Asia as Case Study, ed. V.Dale. Springer-Verlag.
Cardellichio, P.A., Kirjasniemi, M. 1987. Modeling production behavior in Forest Sector Models. In M.Kallio, D.P.Dykstra, and C.S.Binkley (Editors), The Global Forest Sector: An Analytical Perspectives, John Wiley & Sons, New York. Pp.139-168 (Chapter 6).
Cardellichio, P.A., Y.C. Youn, D. Adams, R.W. Joo and J. Chmelik. 1989. A preliminary analysis of timber and timber products production, consumption, trade and prices in the Pacific Rim until 2000. CINTRAFOR Working Paper 22, University of Washington, College of Forest Resources, Seattle.
Economic Planning Unit Malaysia (EPU). 1994. Malaysian National Conservation Strategy. Vol. 4: Natural Resource Accounting, EPU, Kuala Lumpur.
Ismariah, A. 2001. Economics of carbon emission and sequestration in the Malaysian forest sector. Unpublished PhD thesis, University of Washington, Seattle.
IPCC (Intergovernmental panel on Climate Change). 1996. Climate Change 1995. Economic and Social Dimensions of Climate Change and the Contribution of Working Group III to the Second Assessment Report of the IPCC. Edited by J.P.Bruce, H.Lee,and E.F.Haites, Cambridge: Cambridge University Press.
ITTO (International Tropical Timber Organization). 1993. Draft Report: Analysis of Macroeconomic Trends In the Supply and Demand for Sustainably Produced Tropical Timber from the Asia-Pacific Region. Simons Reid Collins. 1993.
Vincent. J.R 1992. The tropical timber trade and sustainable development. Science. 256:1651-1655
Vincent J.R. Razali and Associates 1997. Environment and development in a resource -rich economy: Malaysia under the New Economic Policy. Harvard Institute for International Development. Harvard University Press. 1997.
|
[1] Forest Research Institute
Malaysia, Kepong 52109, Kuala Lumpur, Malaysia. Tel: 03-62797544; Email: [email protected] |