

0107-A2
Asghedom Ghebremichael and David M. Nanang 1
Timber harvesting is a complex subsystem of the forest sector's system of operations. It involves several sequences of operations that include environmental quality considerations (assessment), planning, road construction, felling, yarding, measuring, bucking, loading, transporting and unloading. That is, the forest sector's system of economic activities includes timber harvesting, manufacturing a multitude of products, distributing, selling and much more. Thus, productivity in harvesting timber has a wide range of strategic policy implications on the forest sector's economic performance. Enhanced productivity is one of the key factors that ensure long-term adequacy of timber supply and the forest sector's competitiveness in the global marketplace. Policy makers and forest managers view effectiveness and efficiency in timber harvesting as necessary conditions for sustainable forest management.
We applied a multilateral index procedure to analyse productivity in four of Canada's regional timber-harvesting industries: British Columbia, Ontario, Quebec and the rest of Canada. Preliminary analyses of trends in and cycles of input shares in total cost revealed that materials and supplies accounted for an annual average of more than 59% of the total cost in all four regional industries. The cost shares of labour, capital and energy were roughly 31%, 6%, and 4%, respectively. On the output side, the shares of sawlogs, pulpwood, and firewood in total revenues were approximately 56%, 32% and 12% in all regions. Average annual rates of growth in partial factor productivity revealed that labour and capital were more productive than energy and materials over all regions, indicating that labour- and capital-saving production processes might have been used. The results suggest that materials and energy should be targeted for cost effectiveness and productivity improvement. The industries of Quebec and Ontario registered total factor productivity growth rates of 1.49% and 0.74%, respectively, while those of B.C. and the rest of Canada experienced declines of 0.51% and 0.70%.
The forest sector plays very important role in the Canadian economy. Accounting for 10% of the world's forestland and 20% of the global trade in forest products, in 1999 the sector contributed $35.4 billion to Canada's trade balance and offered full-time, direct employment for 352,000 Canadians (Canadian Forest Service 2000). However, the sector continues to face a variety of challenges that include- among many others- (a) new sources of timber supply coming from low cost, fast growing plantations in the Southern Hemisphere; (b) higher productivity levels achieved by traditional competitors; and (c) globalization of the marketplace. This study aims at critical analysis of productivity performance of four regional timber harvesting industries of British Columbia, Ontario, Quebec and the rest of Canada, covering a 35-year period (1961-95).
The timber harvesting industry has unique features that make it different from any other production enterprise. Accordingly, specification of its production function requires special attention. For example, stumpage (the timber crop) is an input (raw material) for the harvesting industry. Its outputs - the various types and grades of logs (e.g., sawlogs and pulpwood) - are inputs to the forest products manufacturing sector. This direct-forward linkage reveals the critical role the timber harvesting industry plays in the competitive position of the Canadian forest industry. Equation (1) presents the commonly used specification:
Yjt is an aggregate of the three categories of outputs: (a) sawlogs, (b) pulpwood, and (c) firewood. K, L, E, M, and T stand, respectively, for capital, labor, energy, materials, and a time variable, which is expected to capture technological change over time. The subscripts j and t depict a regional harvesting industry and a specific year, respectively.
Analysis of partial factor productivity (PFP) and total factor productivity (TFP) are based on the technological relationship specified in Equation (1):
where xijt is quantity of an input i in regional industry j during year t.
A caveat is in order on the meaning and use of PFP. It has very limited meaning and use. For example, many analysts typically emphasize use of labor productivity. This is misleading, because total productivity cannot be attributed to a single input. If a high PFP of labor is observed, for instance, it can either be due to intensive use of capital or any other input. In short, PFP is a function of all the inputs that constitute the production technology:
where Xjt is an aggregate quantity of the four major inputs specified in Equation (1). If the production technology exhibits constant returns to scale, TFP is considered only as a function of technological change over time:
If economies/diseconomies are present, however, PFP and TFP measures will reflect effects of scale and technological change. This is because PFP and TFP do not distinguish between pure productivity gains (i.e., shifts in the underlying production or cost function) and efficiency gains resulting from increases in the scale of operation, which depends on changes in the underlying cost or production relations. Thus, if technology is homothetic, but does not exhibit constant returns to scale, then TFP is a function of output and technological change:
If technology is nonhomothetic, however, it should be a function of all inputs and technological change:
The difficulty with the measurement of productivity has been in the proper aggregation of multiple inputs and outputs of a given enterprise. For example, in the case of inputs, one cannot obtain a meaningful measure of all inputs by simply adding person hours paid, quantities or dollar values of fuels, materials, etc. In short, we cannot add oranges and apples. To eliminate this difficulty, economists have devised methods of aggregating the disparate values into meaningful input and output indexes. Trueblood and Ruttan (1995), in a review of fourteen studies of multifactor productivity measurements in the agricultural sector, classify the commonly used methods into three: (i) index number, (ii) production function, and (iii) non-parametric, such as data envelopment. The authors note that many economists prefer the Divisia index, which is theoretically consistent with flexible production functions and avoids the problems associated with estimating those production functions.
The aggregating procedures have been refined recently to permit regional and international productivity comparisons. Such indexes are referred to as multilateral. A widely used multilateral index procedure is the one pioneered by Christen and Jorgensen (1969), which is the Tornqvist discrete time approximation to the Divisia index procedure. Caves et al. (1982a) refined the procedure to that in Equation (8):
where
![]() = aggregate quantity of outputs, i = 1, 2, 3
= aggregate quantity of outputs, i = 1, 2, 3
![]() = aggregate quantity of inputs, j = 1, 2, 3, 4
= aggregate quantity of inputs, j = 1, 2, 3, 4
![]() = share of output i in total revenue
= share of output i in total revenue
![]() = share of input j in total cost
= share of input j in total cost
![]() = an arithmetic mean of the share of output i in total revenue
= an arithmetic mean of the share of output i in total revenue
![]() = an arithmetic mean of the share of input j in total cost
= an arithmetic mean of the share of input j in total cost
![]() = geometric (natural logarithm) mean of output i
= geometric (natural logarithm) mean of output i
![]() = geometric (natural logarithm) mean of input j
= geometric (natural logarithm) mean of input j
The subscripts b and t depict the observations of the base and the current year, respectively.
Equation (8) constructs a reference point, the mean data, and compares every observation point to this mean. The averages are taken over the combination of the four regions, the three outputs (sawlogs, pulpwood, and firewood), the four inputs (capital, labor, energy, and materials), and the 35-year time period. Note that to obtain the weighted-aggregate of absolute numbers of quantities of the inputs and outputs, we need to generate the exponential values of the right hand side of Equation (8).
Several advantages of the model in Equation (8) over an econometric model have been identified. They include: (i) multi-regional and international comparisons; (ii) measurement of growth rates and levels of productivity; (iii) ease to understand; (iv) avoidance of the problems associated with estimation of econometric models; and (v) ability to reveal anomalies in the data, enabling the researcher to take remedial measures before the start of empirical analyses.
The study used a very comprehensive database, covering several quantities and prices of inputs and outputs as well as various tax and bond-yield rates. Describing all the sources and the variables and discussing the techniques of deriving several variables (e.g., capital service price), led to the need for a separate technical note on the whole database.
The initial step in the measurement of PFP and TFP involves computation of aggregate quantities of inputs and outputs and their respective prices. In addition, an input share in total cost and an output share in total revenue must be computed. This section presents an analysis of the cycles and trends in the key variables. Such preliminary analysis, which is often overlooked by researchers, reveals anomalies in the data; enhances the credibility and scope of the findings; and provides useful insights into the dynamics of PFP and TFP.
Total cost refers to the long-term cost of all inputs. It includes expenditures on capital in addition to expenditures on the variable inputs, labor, materials and supplies, and energy. A share of an input in total cost is the ratio of the annual expenditure on a given input to the annual total cost. Input cost shares are good indicators of efficiency in using a given input. They give a crude indication as to which inputs should be targeted for cost effectiveness, productivity improvement, and competitiveness.
Figures 1 to 4 illustrate the four regional industries' cost structures. Across the four regional industries, materials and supplies accounted for the largest share in total cost, ranging from 57% to 65%, followed by 27% to 36% for labor; but only 3% to 10% and 3% to 4% for capital and energy, respectively.
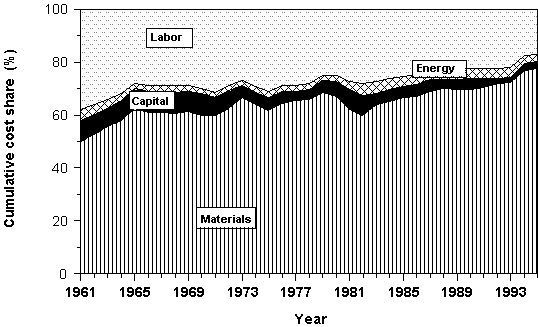
Figure 1. Input shares in total cost for B. C. timber harvesting industry, 1961-95.
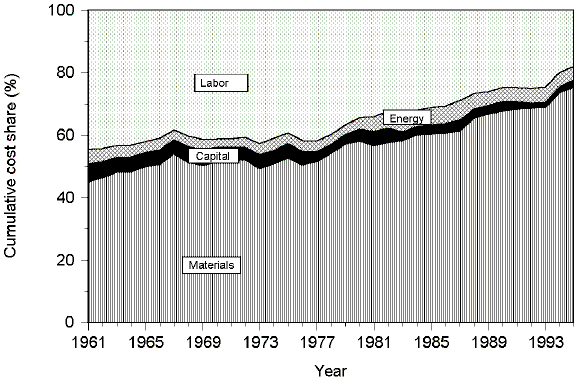
Figure 2. Input shares in total cost for Ontario timber harvesting industry, 1961-95.
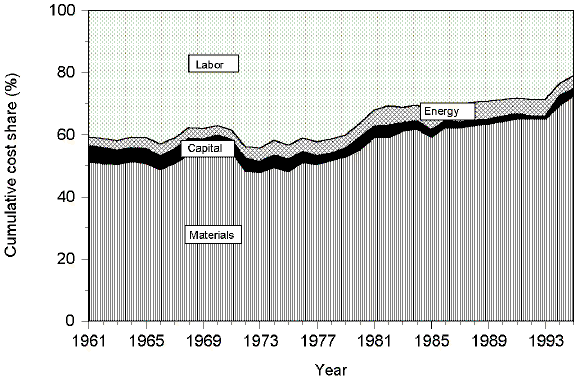
Figure 3. Input shares in total cost for Quebec timber harvesting industry, 1961-95.
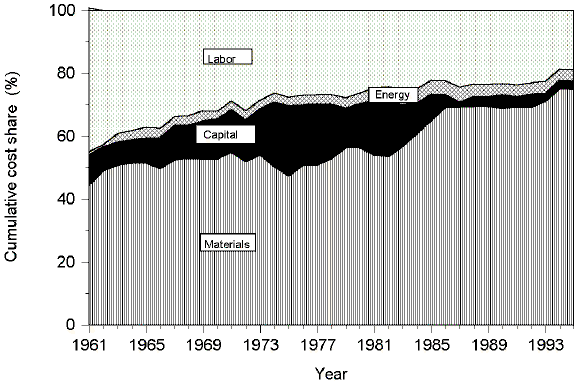
Figure 4. Input shares in total cost for the rest of Canada timber harvesting industry,1961-95.
It should be noted that movement in an input's cost share is a combination of changes in both prices and quantities of all inputs. Even if there is no change in the price/quantity of a given input, a change in its cost share can occur as a result of changes in the prices and quantities of other inputs. It is important to think of changes in cost shares as comprised of two components: one that depends on the given input's own price and/or quantity and the other component that depends on the prices and quantities of all other inputs (Freeman et al. 1987).
Harvesting timber for sawlogs is predominantly more important in B. C. than in Ontario, Quebec, and the rest of Canada (Fig. 5). In B.C, sawlogs account for more than 94% of the gross revenue, while their shares in the rest of Canada, Quebec, and Ontario are 52%, 43%, and 36% (Figs. 5 to 8).
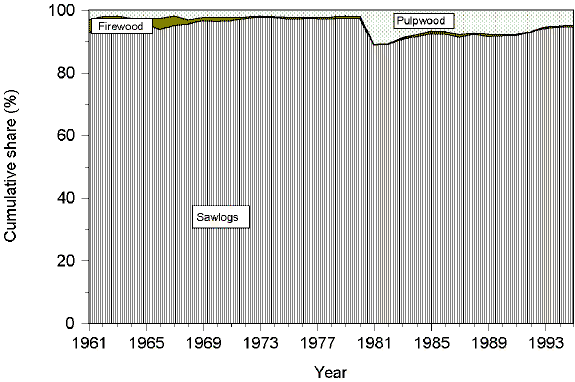
Figure 5. Output shares in total revenue for B. C. timber harvesting industry, 1961-95.
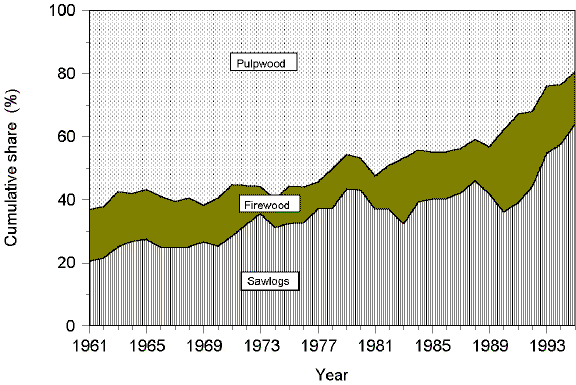
Figure 6. Output shares in total revenue for Ontario timber harvesting industry, 1961-95.
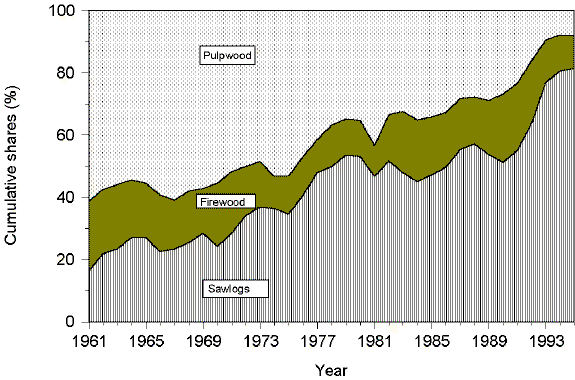
Figure 7. Output shares in total revenue for Quebec timber harvesting industry, 1961-95.
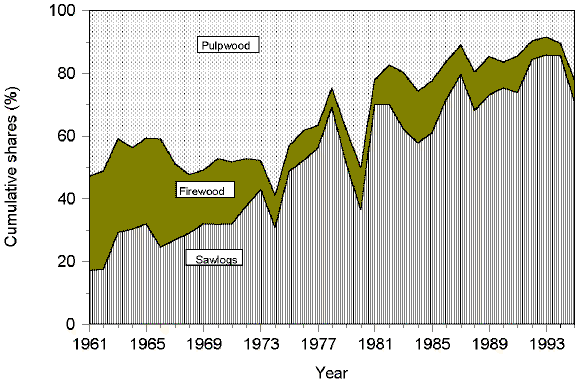
Figure 8. Output shares in total revenue for the rest of Canada timber harvesting industry, 1961-95.
With the caveat given previously under Equation (2) in mind, PFP findings are highlighted here. Taking 1961 results of B.C. as base, PFP of one input is linked to and compared with those of other inputs. Figures 9 to 12 illustrate the inter-regional comparative measures. Labor and energy appear to have been more productive in the B. C. timber harvesting industry (Figs. 9 and 12), while capital and materials were more productive in the Quebec industry (Figs. 10 and 12).
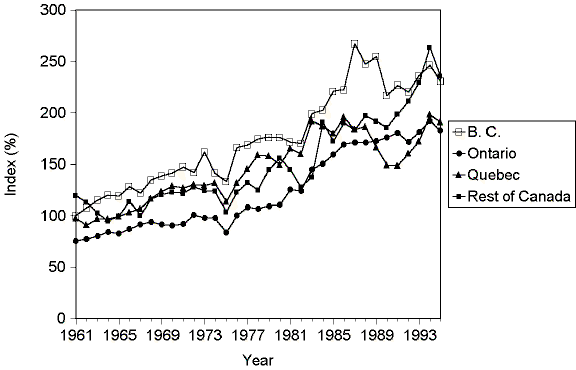
Figure 9. PFP of labor by regional timber-harvesting industry, 1961-95 (B. C. 1961=100).
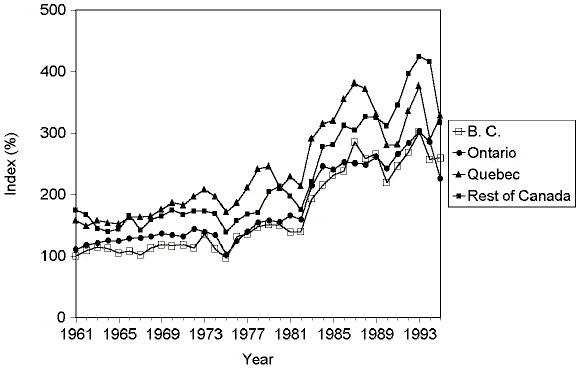
Figure 10. PFP of capital by regional timber-harvesting industry, 1961-95 (B. C.1961=100).
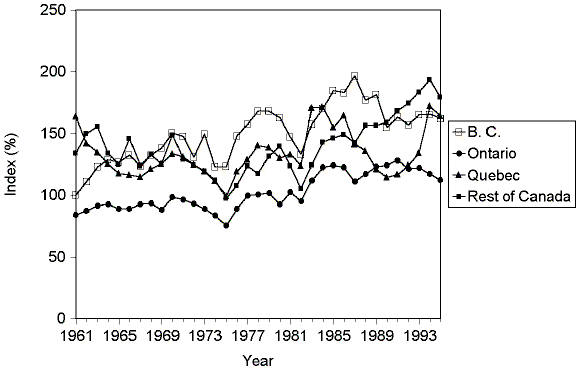
Figure 11. PFP of energy by regional timber-harvesting industry, 1961-95 (B. C. 1961=100).
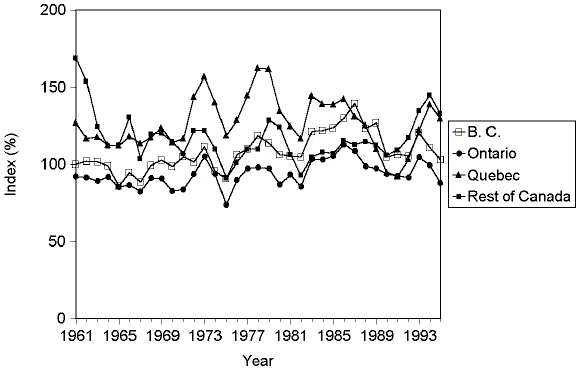
Figure 12. PFP of material by regional timber-harvesting industry, 1961-95 (B. C.1961=100).
TFP can be interpreted as (a) the average product of an aggregate input, (b) a measure of the rate of technical change, and (c) an index of an input's effectiveness in producing output before and after technical change, i.e., if technical change makes the aggregate input more effective, less effective, or does not change the input's effectiveness, TFP index is greater than, less than, or equal to 1, respectively (Chambers 1988). Figures 13 and 14 illustrate the regional and interregional trends in TFP. When independently examined (without linking them), the regional results show modest growth in TFP more in the Quebec industry than in the other regional industries (Fig. 13). By contrast, the B. C. and rest of Canada industries experienced declining trends (Fig. 14). The average annual rates of change in TFP varied by region as 0.51% decline in B.C., 0.74% growth in Ontario, 1.4% growth in Quebec, and 0.70% decline in the rest of Canada.
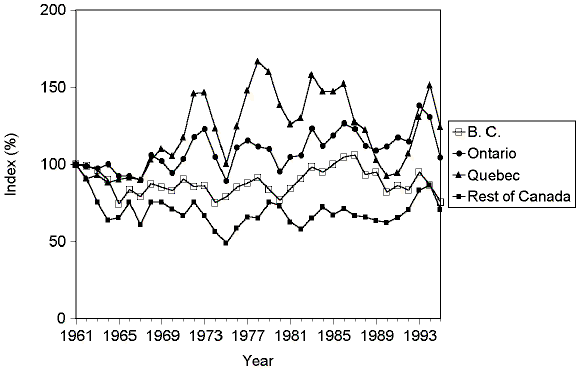
Figure 13. Trends in TFP by regional timber harvesting industry, 1961-95 (1961=100).
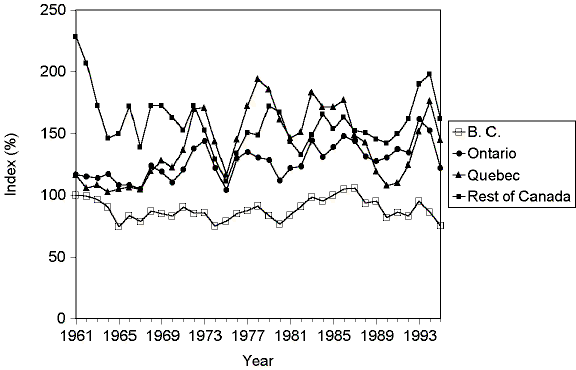
Figure 14. Inter-regional comparative trends in TFP, 1961-95 (B. C. 1961=100).
Timber harvesting is a complex sub-system of the forest sector's system of operations. It involves several sequences of operations that include environmental quality considerations (assessment), planning, road construction, felling, yarding, measuring, bucking, loading, transporting, and unloading. That is, the forest sector's system of economic activities includes timber harvesting, manufacturing a multitude of products, distributing, selling, and much more. Thus, productivity in harvesting timber has a wide range policy implications on the forest sector's economic performance. Enhanced productivity is one of the key factors that ensure long-term adequacy of timber supply and the forest sector's competitiveness in the global marketplace. Policy makers and forest managers view effectiveness and efficiency in timber harvesting as key necessary conditions for sustainable forest management.
This paper focuses on the policy imperatives of productivity. Supplemented with detailed preliminary analyses of trends in and cycles of input and output quantities and their prices as well as an input share in total cost and an output share in total revenue, levels and growth rates PFP and TFP are critically analyzed . We applied a multilateral index procedure to analyze productivity in four Canada's regional timber-harvesting industries: British Columbia, Ontario, Quebec and the rest of Canada over a 35-year period (1961-1995). The trends in and cycles of input shares in total cost revealed that materials and supplies accounted for average-annual of more than 59% of total cost in all four regional industries. The cost shares of labor, capital, and energy were roughly 31%, 6%, and 4%, respectively. On the output side, the shares of sawlogs, pulpwood, and firewood in total revenue were approximately 56%, 32% and 12% in all regions. Average-annual rates of growth in PFP revealed that labor and capital were more productive than energy and materials over all regions, indicating that labor and capital saving production processes might have been used. The industries of Quebec and Ontario registered TFP growth of 1.49% and 0.74%, respectively, while those of B.C. and rest of Canada experienced declines of 0.51% and 0.70%. Scale economies in the industries of Quebec and the rest of Canada indicated existence of opportunities for increasing productivity by increasing output and/or reducing costs. This has industrial policy implications. Market forces could compel high-cost industries out of the market, leading to market/industrial concentration.
Many helped us along the way. Especially, we express our indebtedness to Dr. Chunyan Yu, Dr. Tae Oum, and Dr. Erwin W. Diewert (University of British Columbia); Dr. Jianmin Tang and Dr. Acharya (Industry Canada); and Dr. Shashi Kant (University of Toronto). We acknowledge contributions of Karolina Klimpotyuk, who assisted in building the database. We thank Ms. Flo Magmanlac (Statistics Canada), Steve Fletcher (British Columbia Ministry of Forests), Michel Tremblay (Forestry Quebec), and Mike Naslovar (Ontario Ministry of Natural Resources) for their help in gathering the data from extensively disparate sources. Last, but not least, Dr. Bill White's strong support of the study and encouragements are gratefully appreciated.
Canadian Forest Service. 2000. The state of Canada's forests 1999 - 2000: forests in the new
millennium. Natural Resources Canada, Canadian Forest Service, Ottawa, Ontario. 120 p.
Caves, D.; Christensen, L. R.; Diewert, D. E. 1982. Multilateral comparisons of output, input and productivity using superlative index numbers. The Economic Journal: 92: 73-86.
Caves, D.; Christensen, L. R.; Tretheway; M. W. 1981. U. S. trunk air carriers, 1972-1977: A Multilateral comparison of total factor productivity . In: T. G. Cowing and R. E. Stevenson (eds.) Productivity measurement in regulated industries, Academic Press. Pp 47-76.
Chambers, R. G. 1988. Applied production analysis, a dual approach. Cambridge University Press, New York. 331 p.
Christensen, L.R.; Jorgenson, D. W. 1969. The measurement of U.S. real capital Input, 1929-1967. Review of Income and Wealth (December): 293-320.
Freeman, K.D; Oum, T. H.; Tretheway, M. W.; Waters II, W. G. 1987. The growth and performance of the Canadian transcontinental railways, 1956-1981. Centre for Transportation Studies, University of B.C., Vancouver, B.C. 345 p.
Trueblood, M. A, Ruttan, V. W. 1995. A comparison of multifactor productivity calculations of the U. S. agricultural sector. J. Productivity Analysis. 6: 321-331.
1 Natural Resources Canada, Canadian Forest Service, Northern Forestry Centre, 5320-122 St, Edmonton, Alberta, Canada, T6H 3S5. [email protected]