0109-B4
Soekotjo 2
Tropical rain forest of Indonesia is widely acknowledged as the most complex terrestrial ecosystem with the highest species richness in the world. Indonesia is extending 5,000 km along equator and spanning two major bio-geographical realms, Indo-Malaya and Australasia. There are seven major bio-geographic regions in Indonesia, centered on the major island and groups and their surrounding seas, such as Sumatra and Borneo.
The Indo-Malaya realm mostly is dominated by family of Dipterocarpaceae. The island of Borneo shows the greatest dipterocarps diversity, 267 species recorded, with 59 % of endemicity, against 156 species in Malaya Peninsula (Ashton, 1982). Currently the dipterocarps predominate the international tropical timber market, and therefore play an important role in the economy of many of the Southeast Asian countries.
Due to the economic value, logging has been done in Indonesia, since 1967. Tractor and truck logging be used. Roads were constructed to facilitate year-round logging operation. Logging is being done using method called TPI. TPI consists of removal of veteran and mature trees with diameter above 50 cm before they begin to stagnate and deteriorate. Approximately 25 young and healthy over-story trees are left per hectare. These trees should be well distributed spatially and of adequate economic value. After logging, stands are inventoried 100 % for exportable trees 20 cm diameter and up to determine the amount of damage. Regeneration inventory is done by linear sampling. If the results of inventory less than 40 % of the plot contain seedlings belong to exportable species, enrichment planting should be done. Enrichment planting is also suggested on skid roads and log yards of logged over areas. Tending to free regeneration from competition should be done as needed.
To date there are few data concerning the effects of logging on criteria of sustainable forest management. One criterion on sustainable forest management is bio-diversity. The global interest in bio-diversity of tropical rain forests is in part stimulated by the recognition that it is a treasure house of potentially useful species, whether biologically active compounds, as a gene pool of domesticated species, as a source of commercial timber or other minor products. In this regards, understanding and concern of biodiversity is of prime important.
Tree species diversity is a reflection of environmental conditions, primarily moisture gradients and biotic factors (Daubenmire, 1968) that affect tree species and their capability to survive and establish communities. It is also sensitive to human induced stress (Burgess 1973; Hadi and Supanto 1977) and also to forestry practice (Childers et al, 1986). Thus the collective response of vegetation may be used as early warning system of stress and help identify effect of natural and human induce stress. Therefore, tree species diversity is of important as indicator for environmental impact assessment (Stapanian et al 1994). This indicator can be measured, depending upon the focus and scale of assessment (Noss 1983).
The biological diversity of World's Tropical Rain Forests is under the greatest threat due to the relatively high extent of habitat loss, over exploitation, illegal cutting and forest fire (Myers, 1988; Oldfield, 1988; Salleh and Manokaran, 1995; Siswanto, et al 1977; Whitmore and Sayer, 1992; and Wilson; 1992).
Aware of biological diversity being significantly reduced by certain human activities (logging), specific actions have to be taken. In this regard, the Southeast Asian Ministry of Education, Center of Tropical Biology (SEAMEO BIOTROP) conducts FHM to monitor sustainability of tropical rain forests. This monitoring be supported by ITTO (ITTO Project PD 16/95 Rev.2(F)). One of the objectives of this project plans is to track the status, changes and trends of tree species diversity in logging operations at the forests companies. The status (base line) condition of tree species diversity was reported by Soekotjo and Sutisna (1997). This paper describes changes of tree species three years after status condition.
The study areas are located on three forest types, two forest types are located at South Kalimantan, and one forest type is located in Jambi, Sumatra. The South Kalimantan forest type belongs to State Owned Forest Company (PT INHUTANI II at Pulau Laut) and Jambi forest type belongs to Private Company. The Pulau Laut's forest types consists of tropical rain forest dominated by Shorea polyandra, located at Stagen, and tropical rain forest dominated by Shorea johoriensis, Shorea ovalis, Shorea parvifolia, and Dipterocarpus caudiferus located at Mekarpura. The Jambi Forest Type dominated by Shorea ovalis, Shorea bracteolata, and species of the family Lauraceae & Burseraceae.
During the FHM Demo-Plot establishment, 2 clusters were established at Stagen Forest Areas, 3 clusters were established at Mekarpura, all of these clusters are in South Kalimantan, and 2 clusters were located at Jambi (Table 1).
| Table 1: Clusters, location and condition of forests |
Cluster Plot # |
Location |
Forest Function |
Remark |
1. |
Stagen, Pulau Laut |
Production forest |
Logged in 1968 |
4. |
Mekarpura, Pulau Laut |
Production Forest |
|
5. |
Mekarpura, Pulau Laut |
Production Forest |
|
6. |
Mekarpura, Pulau Laut |
Production Forest |
|
7. |
Stagen, Pulau Laut |
Production Forest |
Logged in 1968 |
1. |
Jambi, Sumatra |
Production Forest |
|
2. |
Jambi, Sumatra |
Production Forest |
Cluster design is described at length by Alexander and Bernard (1997). The cluster design is shown in Figure 1. Each cluster contains a fix four sub-plots and four annular plots. The radius of sub-plot is 7.32 m, and the radius of annular plot is 17.95 m. A cluster design was chosen because it has proven to be cost effective for extensive surveys (Scott, 1993)
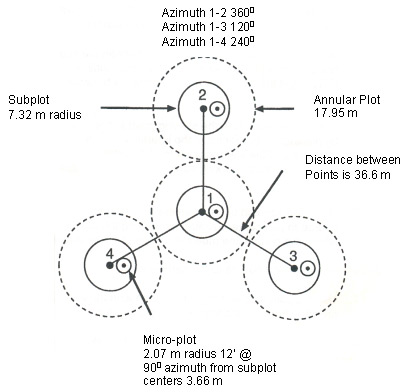
Figure 1: FHM Cluster Design
The center of sub-plot/annular plot 1 is also considered as the center point of overall plot. The center of sub-plot/annular plot 2 is located 360 0 from the center of sub-plot/annular plot 1 and 36.6 m distance. The center of sub-plot/annular plot 3 is located 120 0 from the center point of sub-plot/annular plot 1 and 36.6 m distance. The center of sub-plot/ annular plot 4 is located 240 0 from the center point of sub-plot/annular plot 1 and 36.6 m distance.
All species of poles in each sub-plot were recorded and identified to the lowest taxonomic level, and all tree species in each sub-plot and annular plot were also recorded and identified to the lowest taxonomic level. Based on these data, the number of tree species found on each sub-plot and annular plot, and also the number of individuals of each species were calculated.
Species Richness is the number of species sampled in a given area or in a sample of cluster (such as in 0.40 ha), was calculated based on Margalef's formula, R = (S-1)/ ln(N). Where R = Species Richness, S = number of species, and N= total number of individuals.
Species Evenness is the distribution of abundance among species in a community, was calculated based on Pielou's Evenness index J = H/ln S. Where J = Evenness Index, H = diversity index (see below), and S number of species. J will be minimum (=0) if all individuals are of one species, and maximum (= 1) if the number of species equals the number of individuals.
Diversity index is the synthetic measures and incorporate both species richness and evenness into a single value. This measure is sensitive to both richness and evenness. Related to the uncertainty of identity of an individual randomly selected in an area. Uncertainty increases with richness and evenness. In this paper diversity index be calculated based on Shannon formulas, as follows:
Where i is the number of individuals belonging to the ith of S species in the cluster and n is the total number of individuals in the cluster. The Shannon equation index above is the most frequent diversity index used in ecological literature.
The measurement of change was conducted three years after status condition. The Mekarpura's clusters has been consistently and seriously under pressers of illegal cutting since 1999.
Status and changes of tree species diversity in three forest types observed is shown in Table 2. The status condition of tree species diversity is based on data collected in Year 1996, while changes of tree species diversity is based on data collected in Year 1999.
| Table 2: Status and changes condition of tree species diversity in three forest types. |
No |
Vegetation indicator |
Status Condition |
Change Condition |
1. |
Species Richness, Cluster 1, Stagen |
0.850 |
0.707 |
2. |
Species Evenness, Cluster 1, Stagen |
0.398 |
0.408 |
3. |
Species Diversity, Cluster 1, Stagen |
0.590 |
0.408 |
4. |
Species Richness, Cluster 7, Stagen |
1.007 |
0.899 |
5 |
Species Evenness, Cluster 7, Stagen |
0.729 |
0.721 |
6 |
Species Diversity, Cluster 7, Stagen |
1.185 |
1.072 |
7 |
Species Richness, Cluster 4,Mekarpura |
3.235 |
1.177 |
8 |
Species Evenness, Cluster 4, Mekarpura |
0.885 |
0.750 |
9 |
Species Diversity, Cluster 4, Mekarpura |
2.303 |
0.621 |
10. |
Species Richness, Cluster 5, Mekarpura |
3.545 |
0.341 |
11. |
Species Evenness, Cluster 5, Mekarpura |
0.845 |
0.237 |
12. |
Species Diversity, Cluster 5, Mekarpura |
2.103 |
0.260 |
13. |
Species Richness, Cluster 6, Mekarpura |
4.560 |
0.853 |
14. |
Species Evenness, Cluster 6, Mekarpura |
0.893 |
0.493 |
15. |
Species Diversity, Cluster 6, Mekarpura |
2.438 |
0.616 |
16. |
Species Richness, Cluster 1, Jambi |
5.750 |
5.154 |
17. |
Species Evenness, Cluster 1, Jambi |
0.973 |
0.971 |
18. |
Species Diversity, Cluster 1, Jambi |
2.875 |
2.723 |
19. |
Species Richness,Cluster 2, Jambi |
5.628 |
5.455 |
20. |
Species Evenness, Cluster 2, Jambi |
1.015 |
0.977 |
21. |
Species Diversity, Cluster 2, Jambi |
2.935 |
2.999 |
At the status condition, Table 2 shows that Stagen's forest type is the poorest in species among three forest types; and Jambi's forest type is the richest in species. Both of Cluster 1 and 7 of Stagen's forest type are dominated by single species that is Shorea polyandra. In this regard, as Margalef (1968) stated that species richness is a measure of diversity and expression of possibilities of constructing feed back systems. Higher species richness, then, means longer food chains and greater possibilities for negative feed back control, which reduces oscillation and hence, increase stability. Variation in the number of species may be caused by historical of geography (Ricklegs, 1979) that has placed area in ideal situation for the generation of new species on for receiving immigrants.
At the status condition, Table 2 also informs the evenness index, the distribution of individuals among the species. When all species in the cluster are equally abundant, an evenness index should be maximum. In this regard, Cluster 2 of Jambi's forest type shows the highest value. It means that the individuals in this cluster were distributed among the species in relatively equal abundant.
Table 2 also presents diversity index. At the status condition, Jambi's forest type shows the highest diversity index, and Stagen's forest types show the lowest diversity index. In this regard, Shannon's theory assumes that the higher the value of diversity index, the greater the degree of uncertainty that the next later bit of information will be the same as the previous one. The lower the value, the less the uncertainty. Thus for the Stagen's forest type (Cluster 1, H = 0.590, and Cluster 7, H = 1.185), the chances are greater in sampling trees that the next tree picked at random will be Shorea polyandra. In Cluster 2 of Jambi's forest type with the diversity index of 2.935 the chances that the next tree picked at random will be a Shorea bracteolata is considerably less.
However, this index is biased because the total number of species in the community (S) will most likely be greater than the number of species observed in the samples (So). Fortunately, if n is large, this bias will be small. The maximum possible value of the Shannon's index is dependent on sample size. In the real world, the range of the Shannon's value (Richardson, 1979) is less than 1 represents very low diversity, such as in Cluster 1 of Stagen's forest type (H= 0.590), and above 3 represents relatively higher diversity. Table 2, the highest diversity index of tree is in Cluster 2 of Jambi's forest type (H = 2.935).
Changes in species richness as illustrated in Table 2 indicates that Mekarpura's forest type is the highest. This condition is due to illegal cutting happen in these areas. However, tree species richness in residual stands at Cluster 4 of Mekarpura `s forest type still higher than in Stagen's forest type. The lowest changes of species richness is in Cluster 7 of Stagen's forest type.
The highest changes in diversity index occur in Cluster 6 of Mekarpura's forest type, and the lowest is in Cluster 7 of Stagen's forest type. Table 2 also presents the evenness index, the distribution of individuals among species. The Lower changes in evenness index occur in Cluster 1 of Jambi's forest type, and the highest changes in evenness index occur in Cluster 5 of Mekarpura's forest type.
FHM cluster design is suitable to assess sustainability, in this case assessment of bio-diversity is convenience. Community may be characterized by species diversity. Species diversity involves two components: species richness and species equitability. In this regards, results showed that Jambi's forest type at the status condition is the highest diversity and species richness. Changes in species richness and diversity index happen in Mekarpura's forest type.
Since tree species diversity is a reflection of environmental conditions, therefore, tree species diversity is of important as indicator for environmental assessment. The results of changes in species richness and diversity may be used as early warning in managing forest in a sustainable way.
The author thanks to ITTO, Ministry of Forestry (GOI), SEAMEO BIOTROP, PT. INHUTANI II and Asia Log Concession Holder for their supports. Appreciation goes to Project Steering Committee Members of ITTO Project PD 16/95 Rev. 2 (F) for their suggestions.
Alexander, S.A. and J.E. Bernard 1997. Forest Health Monitoring: Field methods guide. USDA Forest Service, Research Triangle Park, N.C. USA
Ashton, P.S. 1982. Dipterocarpaceae. Flora Malesiana: 237-552. Ser. 1. Vol. 9.2.
Burgess, P.F. 1973. The impact of commercial forestry on the hill forest of Malay Peninsula. Bio-Indonesia I:17-23
Childers, E.L., T.L. Sharik, and C.S. Adkinsson, 1986 Effect of loblolly pine plantations on song-bird dynamics in the Virginia Piedmont. Journal of Wildlife Management 50:406-413
Daubenmire, R.F. 1968 Plant Communities: a text book of plant synecology. Harper & Row. New York.
Hadi, S. and R. Suparto (eds) 1977. Proceedings of symposium on the long term effects of logging in Southeast Asia. BIOTROP Speciesl Pub. No. 3, Bogor, Indonesia
Margalef, R. 1958. Information theory in ecology. General Systematic 3: 36-71
Myers, N. 1988 Tropical forest and their species: going, going. In Wilson (ed.) Biodiversity. A Cad. Press. Washington, D.C.
Noss, R.F. 1990. Indicator for monitoring biodiversity: A hierarchical approach, Conservation Biology 4: 355-364.
Oldfield, S. 1988. Rare tropical timber, IUCN Gland, Switzerland and Cambridge, U.K.
Richardson, J.L. 1979. Dimensions of ecology. Oxford Univ. Press. Oxford
Ricklefs, R.E. 1979. Ecology. Dhiron Press. New York.
Salleh, M.N. and N. Manokaran 1995. Monitoring of forest biodiversity, policy and research issues. In: Boyle, T.J.B and Boontawee (eds): Measuring and monitoring biodiversity in tropical and temperature forest. CIFOR, Bogor, Indonesia.
Siswanto, W., Hardiyono and E. Sukrismanto 1997. Forest and fire in Indonesia. Voluntary paper. XI st World For. Congress Antalya, Turkey
Soekotjo and U. Sutisna 1997. Vegetation Structure Indicator: Present status of free species diversity. Technical Report No. 4. ITTO Project PD 16/95 Rev. 2 (F) SEAMEO BIOTROP, Bogor, Indonesia.
Stapanian, M.A., S.P. Cline and D.L. Cassel 1994. Vegetation Structure Indicator. In: Lewis, T.E. and B.L. Conkling. Forest Health Monitoring Southeast Loblolly/Short leaf pine Demonstration Interim Report, USEA, Washington. D.C.
Whitmore, T.C. and Sayer 1992. Tropical deforestation and species extinction. Chapman and Hill, N.Y.
Wilson, E.O. 1992. The diversity of life. Harvard Univ. Press. Massachusetts.
1 Voluntary paper XII World Forestry Congress, Canada 2003
2 Faculty of Forestry, Gadjah Mada University, Yogyakarta 55281, Indonesia.
Ph/Fax 62-274-545639, E-mail: [email protected]