0411-A1
Mehmet Pak[1] and Mustafa Fehmi Türker
Forest resources supply many benefits to society as wood and non-wood goods and services. While some of these can be valued in monetary terms, it is not possible to say this for some products and services, such as recreational use of forests. In other words, it is impossible to express the recreational use value of forest resources directly. On the other hand, some methods have been developed to put value on the non-market goods and services. Travel Cost and Contingent Valuation Methods have been widely used to determine the recreational use value of forests all over the world.
In this paper, firstly general information about the recreational use of forests in Turkey will be given briefly, and then an attempt is made to estimate the recreational use value for Sazalan Forest Recreation Site located in Trabzon by using Travel Cost and Contingent Valuation Methods.
The main objective of forestry is to provide the possible potential benefits in the forest resources to the society. These benefits can be classified into two main groups as national and global benefits (Topak, 1999). The main benefit at the national level is wood based utilization. In Turkey, maybe all developing countries, such a utilization type from the forest resources is primary objective. Whereas, forest resources have other functions, which should be considered in the coverage of national benefits, such as non-wood forest products, hunting and wildlife, watershed protection services and recreational use.
The value of wood based products and some non-wood products supplied by forest resources can be stated as monetary term in Turkey, but the economic values of other forest goods and services cannot be properly calculated. Consequently, although forests cover about more than ¼ of the land area, the share of forestry sector in the GDP is just 0,5% (Türker, 1999).
Some methods have been developed to put value on the non-market forest goods and services such as recreational use. Although Travel Cost Method (TCM) and Contingent Valuation Method (CVM) from these methods are most widely used to determine the recreational use value of forests in the USA and some European countries, this kind of research is limited in Turkey. In another word, such studies is very new and important for Turkish forestry.
In this study, after giving some general information about the recreational use of forest in Turkey, the recreational use value of forests will be determined by using the TCM and CVM with the case study of Sazalan Forest Recreation Site (FRS) managed by Trabzon National Park and Hunting - Wildlife Head Office. Then, the results will be evaluated from the Turkish forest management point of view.
Travel Cost Method (TCM) is the oldest approaches to environmental valuation. The method has been widely used in both the USA and the UK for valuing the non-market benefits of outdoor recreation, especially recreation associated with national parks and public forests (Hanley et al., 1997).
In essence the TCM evaluates the recreational use value for a specific recreation site by relating demand for that site (measured as site visits) to its price (measured as the costs of a visit). A simple TCM model can be defined by a trip-generation function as follow (Bateman, 1993).
V = f(C, X) [1]
where;
V: number of visits to a recreation site,
C: visit costs,
X: other socio-economic variables, which significantly explain V.
The method is applied in two ways according to the definition of the dependent variable V. These are the individual travel cost method (ITCM) and the zonal travel cost method (ZTCM). The ITCM simply defines the dependent variable as the number of site visits made by each visitor over a specific period, for example one year. On the other hand, the ZCM portions the entire areas from which visitors originate into a set of visitor zones and then defines the dependent variable as the visitor rate (Bateman, 1993). In this study, the ITCM was applied to put value on the recreational use of the forest site allocated for the recreational purposes.
Contingent Valuation Method (CVM) which was firstly used by Davis in 1963 seeks to place a figure on the benefits people derive from consuming a public good by directly questioning a sample of consumers in order to obtain their maximum willingness to pay (WTP) to have the good, or minimum compensation sum to go without it; their willingness to accept (WTA). WTP and WTA may also be estimated for any welfare decreasing action (Hanley, 1989). The CVM requires that individuals express their preferences for some environmental resources, or change in resource status, by answering questions about hypothetical choices (Bateman and Turner, 1993). According to Hanley (1989) in order to investigate the determinants of, for example, WTP, a bid curve may be estimated, where for individual i:
WTPi = F(Qi, Yi, Ti, Si) [2]
where;
Qi: the quantity or quality of environmental good,
Yi: income,
Ti: preferences,
Si: other socio-economic variables thought relevant.
In this study, Sazalan Forest Recreation Site (FRS) that is under control of Trabzon National Park and Hunting - Wildlife Head Office (NPHO) was selected as a research area. Sazalan FRS is owned by the Forest General Directorate, covers 5 hectares but managed by private manager under control of Trabzon NPHO. The number of visitor is estimated by managers and technical person as 3000 visit per year (Anonymous, 2001).
A total of 66 questionnaires were collected by face-to-face interview. The questions were answered by a representative of each visitor group. Table 1 gives some general descriptive data obtained.
Table 1: The Basic Data for Sazalan Forest Recreation Site
|
Variable |
Units |
Mean |
Standart Deviation |
|
|
Distance |
Km |
54,21 |
23,47 |
|
|
Number of visits made by individual in a year |
Number |
5,20 |
9,54 |
|
|
Time at Recreation Site |
Hour |
3 - 5 |
- |
|
|
Travel Time |
Minute |
126,74 |
38,29 |
|
|
Number of old person in the Visitor Group |
Number |
3,00 |
1,08 |
|
|
Number of children in the Visitor Group |
Number |
1,32 |
0,91 |
|
|
Household Income in a month |
Million TL |
301 - 400 |
- |
|
The main objective of the CVM application was to put a monetary value on the benefits derived by visitors from three different scenarios developed for Sazalan FRS. Aspects thought to be important were current situation of Sazalan FRS, developed situation 1 hypothetically formed by adding the number of present facilities and lastly developed situation 2 hypothetically formed by permitting for some new activities.
Table 2: The Scenario and WTP proposal for the current situation of Sazalan FRS
|
Option A |
Option B |
|
|
· The forest recreation site
will be open for recreational activities as it is now. |
· Entrance of people to the FRS
for recreational purposes will be forbidden. |
|
|
Question1: Which option would you like to prefer? |
· Option A |
· Option B |
|
Question 2a: Would you like to pay 250 000 TL per person as an entry fee? |
· Yes |
· No |
|
Question 2b: Would you like to pay 500 000 TL per person as an entry fee? |
· Yes |
· No |
|
Question 2c: Would you like to pay 1000 000 TL per person as an entry fee? |
· Yes |
· No |
|
Question 3: How much would you be willing to pay, per person per visit? |
.....................................TL |
|
In order to determine the WTP of respondents, it is suggested that hypothetical scenarios have to be developed. In these scenarios, firstly the respondents are asked to prefer one of two options related to the FRS, then maximum WTP for the option preferred by the respondent is determined. For this purpose, it is tried to reach to maximum WTP by suggesting entry fee toward lower to higher amount named as bidding game (Hanley et al., 1997). In this study, the scenarios developed for the current situation of Sazalan FRS and their WTP proposals were shown in Table 2. In order to estimate the value for the developed situation 1 and developed situation 2 of Sazalan FRS, similar question format was used.
The descriptive statistics such as mean WTP, standard deviation, range and protest bids for three hypothetic situations of Sazalan FRS are given in Table 3.
Table 3: Contingent Valuation Results of Sazalan FRS
|
Descriptive Statistics |
WTP for Current Situation |
WTP for Developed Situation 1 |
WTP for Developed Situation 2 |
|
Mean (TL) |
471 212 |
758 468 |
775 758 |
|
Standard Deviation |
184 920 |
596 130 |
879 960 |
|
Range (TL) |
0 - 1 000 000 |
0 - 5 000 000 |
250 000 -7 500 000 |
|
No. of protest bids |
- |
- |
1 |
|
No. of non-protest bids |
66 |
66 |
65 |
As seen in Table 3, the average WTP of respondents as a entrance fee for the current situation of Sazalan FRS is 471 212 TL per person per visit. This figure increase to 758 468 when improving the number of present facilities on site and to 775 758 TL when permitting some more recreational activities on site. Taking the figure of 3000 visitor days per annum for the Sazalan FRS, the following aggregate bids for alternative situations of Sazalan FRS are obtained and given in Table 4.
Table 4: WTP values related to Sazalan FRS
|
Alternative Situations |
Annual Number of Visitors |
3 000 person per year |
|
|
|
Area |
5 ha |
|
|
|
Mean WTP (TL) |
Total WTP per annum (TL) |
Total WTP per hectare (TL/ha) |
|
Current Situation |
471 212 |
1 413 636 000 |
282 727 200 |
|
Developed Situation 1 |
758 468 |
2 275 404 000 |
455 080 800 |
|
Developed Situation 2 |
775 758 |
2 327 274 000 |
465 454 800 |
Total WTP which means annual recreational use value of Sazalan FRS was calculated as 1 413 636 000 TL for the current situation, 2 275 404 000 TL for the developed situation 1 and 2 327 274 000 TL for the developed situation 2. The recreational use values per unit area were calculated by dividing with the area of Sazalan FRS which is about 5 ha. In this case, the recreational use values per ha were estimated as 282 727 200 TL for the current situation, 455 080 800 TL for the developed situation 1 and 465 454 800 TL for the developed situation 2.
In order to estimate the consumer surplus, which means the recreational use value of Sazalan FRS, and set up its demand model and determine the effective factors on the number of visits made by individuals in a year, a multiple regression analysis was done by selecting the number of visits made by individuals in a year as dependent variable and other socio-economic variables related to the visitors. According to F and t values, semi-Logaritmik function type was found significantly at the 99% level. The results of multiple regression analysis are given in Table 5.
Table 5. The Results of Regression Analysis related to Sazalan FRS
|
Model Summary |
||||||
|
Model |
R |
R2 |
Adjusted R2 |
Std. Error of the Estimate |
||
|
Semi-Log (M) |
0,693 |
0,480 |
0,441 |
0,4405 |
||
|
Analysis of Variance |
||||||
|
Model Type |
Model |
Sum of Squares |
df |
Mean Square |
F |
Sig. |
|
Semi-Log (M) |
Regression |
9,510 |
4 |
2,378 |
12,252 |
0,000 |
|
|
Residual |
10,285 |
53 |
0,194 |
|
|
|
|
Total |
19,795 |
57 |
|
|
|
|
Coefficients |
||||||
|
Dependent Variable |
Model Variables |
Coefficients |
t |
Sig. |
|
|
|
|
|
b |
Std. Error |
|
|
|
|
Ln (AVN) (M) |
Constant (a) |
0,867 |
0,359 |
2,416 |
0,019 |
|
|
|
Total Travel Cost [TTC 2] |
-1,020E-07 |
0,000 |
-3,940 |
0,000 |
|
|
|
Characteristics of Settlement [COS) |
-0,332 |
0,086 |
-3,884 |
0,000 |
|
|
|
Time spent on site [TSS] |
0,175 |
0,049 |
3,549 |
0,001 |
|
|
|
Age [A] |
0,127 |
0,060 |
2,107 |
0,040 |
|
According to the regression results summarized in Table 5, the 4 independent variables were included in the regression model. These are total travel costs, characteristics of settlement, time pent on site and age of respondents. In the model, first three variables were found significantly at the 99% level and last one is at the 95% level. Considering the variables in the regression model, the demand function for Sazalan FRS was developed as follows:
Ln(AVN) = 0,867 - 1,020E-07 x C - 0,332 YYN + 0,175 TSS + 0,127 A [3]
As seen in Table 5 and in the demand model, the sign of total travel costs is negative (-). It means that there is a negative relationship between the number of visits made by individuals in a year and the cost of a visit per person.
It is primarily necessary to calculate individual consumer surplus per person per visit for determining the total annual consumer surplus. Individual consumer surplus can be calculated by using the following formula for the semi-log function type (Willis, 1991; Damigos and Kaliampakos, 2001).
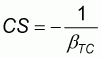 [4]
[4]
where; CS: Consumer Surplus per person per trip,
bTC: Coefficient of travel cost (travel costs)
The total annual consumer surplus can be calculated by multiplying the individual consumer surplus with the number of visits made in a year, estimated as 3000 people for Sazalan FRS. At the last stage, the total consumer surplus value per ha area can be obtained by dividing the total annual consumer surplus with the area of Sazalan FRS which is 5 ha (Anonymous, 2001). The results calculated according to above explanations are summarised in Table 6.
Table 6: Consumer surplus values of Sazalan FRS
|
Area (ha) |
5 |
|
Number of annual visit (visit/year) |
3 000 |
|
Individual consumer surplus (TL/person/visit) |
9 803 922 |
|
Total consumer surplus (TL/year) |
29 411 764 706 |
|
Total consumer surplus per unit area (TL/ha) |
5 882 352 941 |
According to the ITCM for Sazalan FRS, the values of consumer surplus is 9 803 922 TL for per person per visit, 29 411 764 706 TL for the total annual consumer surplus and lastly 5 882 352 941 TL for the total annual consumer surplus per ha.
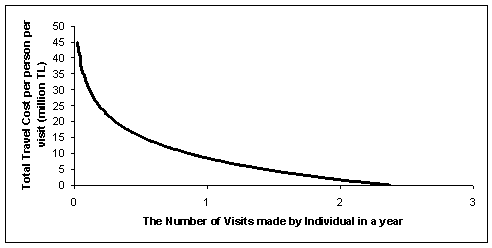
The demand curve for Sazalan FRS was developed by using the demand function (Equation 3) and shown in Figure 1. According to Figure 1, there is a reverse relationship between the number of annual visitors and the cost of travelling to the site. Consequently, it seem that the demand curve estimated for Sazalan FRS is suited to the theoretical expectations in the TCM applications.
Figure 1. Sazalan FRS Demand Curve developed by hypothetically
The natural resources such as forests supply many social benefits as well as economic benefits. The recreational use of forest is a kind of benefit obtained from forests. The monetary value of these benefits has been estimated by using some methods such as TCM and CVM for a long time in many countries. The results of these researches have been used by decision makers and managers in the allocations of natural resources.
In this study, the value of Sazalan FRS located in the East Black Sea region of Turkey (total consumer surplus) was estimated by using ITCM as 29 411 764 706 TL per year. On the other hand, according to CVM, total WTP was annually calculated as 1 413 636 000 TL for the current situation, 2 275 404 000 TL for the developed situation 1 and 2 327 274 000 TL for the developed situation 2 dependently on the entry fee WTP of the respondents for the Sazalan FRS:
Sazalan FRS was managed by private sector paying 420 million TL to the NPHO in 2001 (Anonymous, 2001). This figure was considered as annual income for the NPHO from Sazalan FRS, and it can be accepted very low. But, considering the environmental clearance tax, workers and management costs paid by the manager in addition to rental cost, it would be over the total annual WTP calculated by CVM.
Comparing the results of ITCM and CVM, it will be seen the results of CVM based on the WTP of respondents is lower than the result of ITCM. Namely, average WTP for the current situation of Sazalan FRS was calculated as 471 000 TL and total WTP for year 2001 was about 1,4 billion TL. The economic crises continuing and affecting the society in Turkey may be considered as the most important reason of low WTP calculated by CVM for Sazalan FRS. Because, in CVM, the WTP of individuals for a services provided by forest resource is determined, and of course, the WTP of Sazalan FRS users would be related to their economic situations. Likewise, average household income of respondents was between 300 and 400 million TL per month. The household income of Sazalan FRS users is low, so were the WTP values.
Anonymous, 2001. Trabzon National Park and Hunting - Wildlife Head Office Records
Bateman, I. J. and Turner, R.K., 1993. Valuation of the Environment, Methods and Techniques: The Contingent Valuation, R.K. Turner (Editor) Sustainable Environmental Economics and Management, Bellhaven Press, London.
Bateman, I., 1993. Valuation of the Environment: A Survey of Revealed Preference Methods, CSERGE GEC Working Paper, University of East Anglia, Norwich, and University College, London.
Damigos, D. and Kaliampakos, D., 2001. Economic Valuation of Mined Land Reclamation: An Application of Individual Travel Cost Method in Greece, International Conference of Mine Producing, Geology and Environment Protection, 03 - 09/06/2001, Varna-Bulgaria.
Hanley, N., 1989. Valuing Rural Recreation Benefits: An Empirical Comparison of Two Approaches, Journal of Agricultural Economics, 40, 361 - 374.
Hanley, N., Shogren, J.F. and White, B., 1997. Environmental Economics in Theory and Practice, Macmillan Ltd., UK.
Topak, M., 1999. Economic Value of Turkish Forests, AGM Research and Development (Ar-Ge), Ankara. (in Turkish)
Türker M. F., 1999. The Determination of The Importance of The Forestry Sector in National Economy Using Input- Output Analysis, Tr. Journal of Agriculture and Forestry, 23 (1999), Supplemental. Issues 1, 229-237, TÜBÝTAK, (in Turkish).
Willis, K.G. and Garrod, G.D., 1991. An Individual Travel Cost Method of Evaluating Forest Recreation, Journal of Agricultural Economics, 42, 33-42.
| [1] Research Assistant, Karadeniz
Technical University, Faculty of Forestry, Department of Forest Engineering,
Division of Forest Economics, 61080 - Trabzon, Turkey. Email: [email protected] |