
0455-B4
Ress.Asst.Nuray MISIR 1 , Prof.Dr. Hakkı YAVUZ 2 , Ress.Asst.Dr. Mehmet MISIR 3
Logistic models predicting probability of mortality for individual trees were developed for Crimean pine (Pinus nigra subsp. pallasiana) plantations in Turkey. The data were comprised 115 sample plots with 5029 individual trees. The explicatory variables in the model were competition index (ratio of diameter of the subject tree and basal area mean diameter of the sample plot), basal area, and site index. All parameter estimates were found highly significant (p<0.001) in predicting mortality model. Although the phenomenon of mortality is a stochastic, rare and irregular event, the model fit was fairly good. Given the general uncertainly related to large scale forestry scenario analyses and the uncertainly related to mortality as a phenomenon, the mortality model presented in this paper were considered to have an appropriate level of reliability.
Crimean pine is one of the most important both plantation and natural species in Turkey. Establishment of large scale plantations of Crimean pine in Turkey were started in 1955. These plantations are estimated to cover about 120.000 hectares. Thus, it is important that development of growth and yield models for these stands to provide decision making of forest management. Growth and yield models constitute recruitment, growth, and mortality models. It has been aimed that modeling of mortality of which predicting is the most difficult in this study. From this regard, there is a need of for a reliable system of growth and yield predicting to provide a firm basis for management and decision making.
To account for mortality, two considerations -the self-thinning limit and the probability of a tree to die during the coming growth period- have been found. The model for self-thinning limit is based on the relationship between the total number of trees and the mean tree size of a fully stocked stand. On a log-log scale, the relationship has been found to be linear and the slope of the line is near -3/2, but varies according to species' shade tolerance, locality and the site type (Rautiainen 1999). For this aim, data obtained from stands considered to be at the self-thinning limit have been used.
In this work, with development of mortality model estimated the probability of a tree to die a during the coming growth period was dealt.
Until now, no growth models for individual trees and mortality model had been developed in Turkey. Only empirical yield tables and variable-density yield tables (Yeşil 1992, Köse et al. 2001) were constructed.
Mortality remains one of the least understood components of growth and yield estimation (Hamilton, 1986). The key to a tree's survival or mortality is its genetic make up and its environment. Growth models almost universally ignore a tree's genetic status, as well as important environmental factors such as climatic extremes (e.g. wind, drought, killing frost), insects, and diseases. Great detail is paid to environmental competition arising from neighboring trees, however, as well as measurable gross physical features of the tree and site. Perhaps mortality would appear less stochastic if relevant environmental variables were measured on permanent plots, and if the genetic status of the trees could be characterized.
The most common methodology for modeling individual tree mortality is statistical. Generally, the parameters of a flexible non-linear function bounded by 0 and 1 are estimated using weighted non-linear regression or a multivariate maximum likelihood procedure (Neter and Maynes, 1970). Although most cumulative distribution functions will work, the most popular is the logistic or logit. Other applications have used the Weibull, the gamma, the Richard's function, the exponential and the normal or probit. Monserud (1976) found that both the probit and the logit produced similar results, even though the underlying functional forms are quite different.
Data were collected from 115 sample plots ranging in ages from 3 to 50 years. Sample plots were taken from four Forest Conservancy, Regional Forest Headquarters in Turkey. Data for this study were obtained from Crimean pine plantations which have the same spacing (3x1.5 m.), 2222 planted per hectare. Rectangular plots area varied from 165 m 2 to 600 m 2 .
Plantations were stratified into ten-years age classes and sampled with an effort to equal allocation of at least three sample plots to each age group. For each age group, effort was also made to include the full range of site conditions (from the poorest to best).
For each plot, all trees were measured for diameter at breast height, diameter at stump level, total height, and age. At each plot were also measured slope and altitude and aspect. The site index for each site was determined using the age-dominant height relations. The mean site index for all sample plots was 12.52 m. at base age 40 years.
The values for volume ha -1 (V), basal area ha -1 (BA), quadratic mean diameter (![]() ), mean height weighted by basal area (
), mean height weighted by basal area (![]() ), site index (S), age (A), dominant height (h100)and number of trees ha -1 (N) in Table 1 were based on individual trees measured on the sample plots.
), site index (S), age (A), dominant height (h100)and number of trees ha -1 (N) in Table 1 were based on individual trees measured on the sample plots.
Each tree was classified as "alive" or as "dead" at the time of plot establishment (as well as remeasured). Dead trees were defined as (i) standing or (ii) fallen trees with no green branches, or as (iii) wind thrown trees still with green branches. At remeasurement (at measurement in 2001), all trees were alive on 20 (17.1%) sample plots. Out of 5029 living trees at the time of plot establishment, 851 trees were dead when they were remeasured (Table 2).
Table 1. Data Summary
Min |
Max |
Mean | |
S (m) |
5.80 |
22.41 |
12.52 |
A (years) |
7 |
50 |
11 |
h100 (m) |
0.51 |
22.33 |
9.42 |
V(m 3 ha -1 ) |
1.26 |
837.09 |
165.79 |
N (ha -1 ) |
407 |
1765 |
1058 |
BA(m 2 ha -1 ) |
0.04 |
50.56 |
11.62 |
|
0.51 |
32.64 |
11.32 |
|
0.42 |
18.53 |
7.22 |
P(die) |
0 |
0.60 |
0.15 |
| P(die) : Probability of a tree dying |
Table 2. Number of Dead Trees and Annual Mortality Rate.
Total no. of trees |
Dead trees |
Annual mortality for no. of trees | |
No. |
% |
(%) | |
5029 |
851 |
16.9 |
1.41 |
The observations of living and dead trees were converted in to annual mortality rates for number of trees according to periods varying from 7 to 50 years between measurements. The 851 dead trees corresponded to an overall annual mortality rate of 1.41% (Table 3).
A model for the probability of a tree to die during the next growth period as a function of tree and stand characteristics was estimated from model data set.
Individual tree mortality is a discrete event, i.e. only the values 0 (dead) or 1 (live) may occur. Although a number of cumulative distribution functions may work as the classification function when natural mortality is modeled, the logistic function is probably the most widely used in models for individual trees.
The candidate variables of the present study were divided into tree groups: (i) measures of individual tree size (ii) measures of individual tree competition and (iii) measures at the stand level of structure, density, and productivity.
The only variable available for describing individual tree size was diameter at breast height (d). Usually a linear function of diameter is not sufficient to describe mortality. Several possibilities for transformation of this variable exist and have been applied (Monserud and Sterba 1999). In addition to a linear relationship d -1 , d 2 were tested in the present work.
Examples of competition indices used in mortality models are d/![]() i.e. ratio of diameter of the subject tree and quadratic mean diameter of the sample plot (Avila and Burkhart 1992), BAL, i.e. the summarized basal area for all greater than the subject tree (Monserud and Sterba 1999). In the present study, d/
i.e. ratio of diameter of the subject tree and quadratic mean diameter of the sample plot (Avila and Burkhart 1992), BAL, i.e. the summarized basal area for all greater than the subject tree (Monserud and Sterba 1999). In the present study, d/![]() and BAL were tested. In addition to proportion basal area (PBA) were tested as an example stand structure.
and BAL were tested. In addition to proportion basal area (PBA) were tested as an example stand structure.
Several possibilities exist to describe stand density. Eid and Tuhus (2001), who used BA, and Burgman et al. (1994), who used N, have provided examples of models with stand density parameters as explicatory variables. Since N and BA were directly determined and did not rely on functional relationships as opposed to volume (V), only these two variables were selected for testing in the present study.
Based on the discussion above, the fallowing mortality model was hypothesized for all species:
![]()
where t1 is the individual tree size (d, d -1 ,d 2 ), t2 is the individual tree competition (d/![]() , BAL), S1 is the stand density (N, BA), S2 is the stand structure (PBA) and S3 is the stand productivity (S).
, BAL), S1 is the stand density (N, BA), S2 is the stand structure (PBA) and S3 is the stand productivity (S).
The validation of a model should involve independent data. For the present work data were partitioned in two groups, one for model development and one for validation. The data set used for model development comprised approximately 80% of the observations (4023), while the remaining 20 % of the observations (1006) were used for validation. Although the number of observations determined for model development was made relatively large in order to provide sufficient data for the model development phase, the number of observations in the test data still should be large enough for validation and appropriate statistical test.
Non-linear regression was used to estimate the parameters of the hypothesized model. This procedure produces weighted least squares estimates of the parameters of a non-linear model. For each non-linear model to be analyzed, the names and starting values for the parameters to be estimated, the model and the partial derivatives of the model with respect to each parameter, were specified. The significance of the parameter estimates was tested by means of Z=β/ASE, where β is the parameter estimate and ASE is the asymptotic standard error (Eid and Tuhus 2001)
The validation was based on two different concepts. First, predicted and observed mortality were compared by visually studying deviations over the explicatory variables included in the models. The model development data set as well as the test data set was compared in this way. Secondly, the test data set was started according to certain attributes not included as explicatory variables in the mortality models, and then used for comparisons of predicted and observed mortality over different classes within the attributes. The deviations between predicted and observed values were tested by means of Pearson Chi-Squared Statistics (Eid and Tuhus 2001). Large chi-squared values provided evidence of lack of fit.
All parameters were highly significant (p<0.001) in predicting tree mortality (Table 3). Ratio of diameter of the subject tree and basal area mean diameter of the sample plot (d/![]() ), basal area and site index were significant in predicting mortality for Crimean pine plantations (p<0.001).
), basal area and site index were significant in predicting mortality for Crimean pine plantations (p<0.001).
The probability of a tree dying in Crimean pine plantations is the best explained by stand basal area, site index and the relative size of a tree (Eq. (1)). The parameter estimates for the mortality model are significant (p<0.001) (Table 4). The probability of mortality in Crimean pine plantations decreased when diameter increased. Accordingly, the larger the value of the exponent, the greater is the probability of mortality. This means that the denser the plantation (stand) and the more suppressed the tree, the greater is the probability of the tree dying. The probability of mortality is lower on good sites than on poor sites.
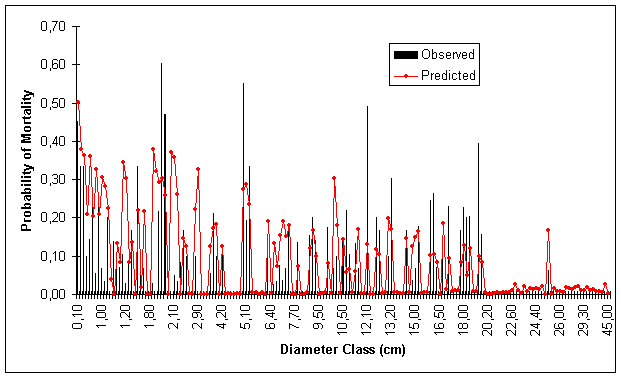
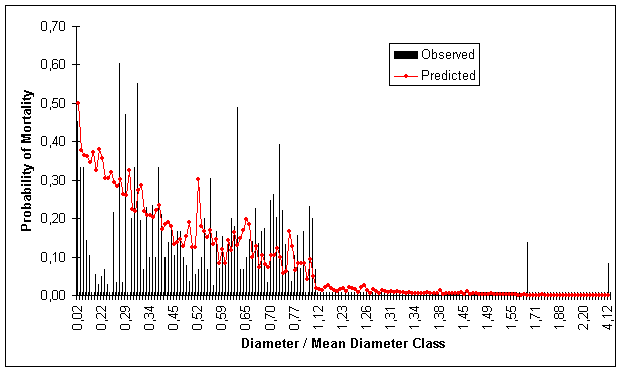
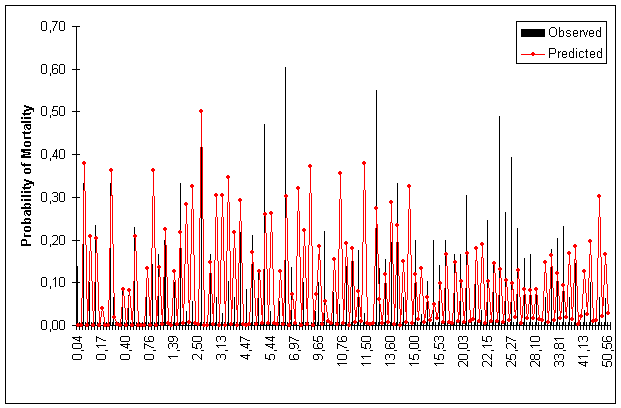
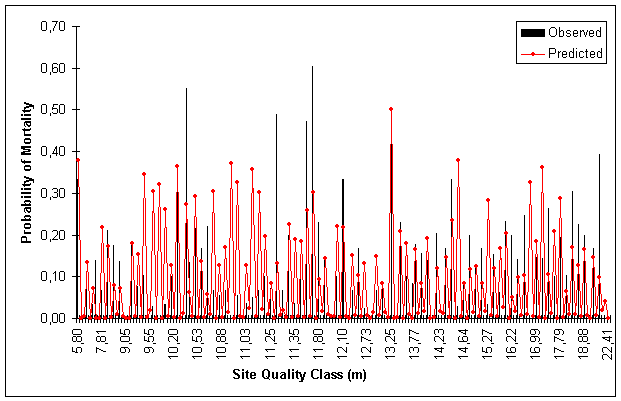
Figures 1, 2, 3 and 4 show predicted and observed mortality plotted over d, d/![]() , BA and S, respectively. The predicted mean values of the figures were calculated using actual values of the explicatory variables for each observation.
, BA and S, respectively. The predicted mean values of the figures were calculated using actual values of the explicatory variables for each observation.
The average predicted and observed number of dead trees in the test data set were 168 and 143, respectively, i.e. a relative deviation of 14.9 % (Table 4).
The chi-squared statistics gave no evidence of lack of fit between predicted and observed values. Since number of trees ha -1 (N) was hypothesized as an explicatory variable, but failed in predicting mortality rates, the test data were stratified according to N, and investigated more thoroughly (Table 5). No evidence of lack of fit was detected over N, however.
Table 3. Estimated Parameters and Standard Errors for Mortality Model (Eq. (1))
Variable |
Estimate |
Standard Error |
Intercept |
-0.099445572*** |
0.138625298 |
d/d |
-4.065710134*** |
0.168432915 |
BA (m 2 ha -1 ) |
0.029035703*** |
0.003432503 |
S (m) |
0.007984269*** |
0.010879860 |
| Radj 2 =0.50 ***: p<0.001 |

Figure 1. Predicted and Observed Mortality Over Diameter Classes for Model Data Set.

Figure 2. Predicted and Observed Mortality Over Diameter/Quadratic Mean Diameter Classes for Model Data Set. Basal Area Class (m 2 ha -1 )

Figure 3. Predicted and Observed Mortality Over BA Classes for Model Data Set.

Figure 4. Predicted and Observed Mortality Over Site Index Classes for Model Data Set.
Table 4. Predicted and Observed Mortality Over Tree Species in Test Data Set
Tree Species |
Total Number of Trees |
Predicted |
Observed |
Deviation |
| ||
No |
% |
No |
% |
% | |||
Crimean Pine |
1006 |
168 |
16.7 |
143 |
14.2 |
14.9 |
3.72024ns b |
Table 5. Predicted and Observed Mortality Over Classes of Number of Trees
N (ha -1 ) |
Total Number of Trees |
Number of Dead Trees |
Deviation |
|
| |
Predicted |
Observed |
% |
(Accumulated) | |||
0-500 |
35 |
15 |
12 |
25.0 |
0.6000 |
0.6000 |
501-1000 |
337 |
79 |
69 |
14.5 |
1.2658 |
1.8658 |
1001-1500 |
394 |
58 |
51 |
13.7 |
0.8448 |
2.7106 |
1501-2000 |
240 |
16 |
11 |
45.5 |
1.5625 |
4.2731ns b |
| b Significant level, ns: nonsignificant |
Mortality of individual trees is a stochastic, rare, and irregular phenomenon. Many mortality models for individual trees include three or fewer explicatory variables (e.g. Eid and Tuhus 2001). Thus, it was as expected when several candidate variables of the hypothesized mortality model were excluded when it came to the final models (Table 4).
The hyperbolic d -1 founded to be significant in many mortality models were failed in the present study. In addition to a model with a linear relationship between d and mortality was tested but parameter estimate was insignificant. However, the model gave decreased mortality with increased diameter. Monserud and Sterba (1999), hypothesized on increased mortality rate for very large diameters due to senescence of overmature trees, included d 2 in the model, and found it significant in predicting mortality for Norway spruce. No signs of such effects were found in the present study.
The competition indices BAL and d/![]() were tested in predicting mortality but only ratio of diameter of the subject tree and basal area mean diameter of the sample plot means that the relative size of a tree was found significant (p<0.001). BAL give on insignificant parameter estimate.
were tested in predicting mortality but only ratio of diameter of the subject tree and basal area mean diameter of the sample plot means that the relative size of a tree was found significant (p<0.001). BAL give on insignificant parameter estimate.
N and BA were tested as measures for stand density but only BA was found significant. N failed as explicatory variable because the parameter estimate was insignificant. Several previous models include a competition index and a measure for density at the same time (Hamilton 1986). In the present data the density seemed too much correlated with mortality. When the predicted and observed mortality of the test data set were compared over different classes for N, no evidence of lack of fit was found (Table 6).
Site index (S) was found significant in predicting mortality i.e. the better the site index the greater the mortality rate (Table 4). The model data indicated a more rapidly increasing mortality for the best side indices.
The average deviation between predicted and observed mortality in the test data was 14.9 % (Table 5). No evidence of lack of fit was found. The same holds true when predicted and observed mortality were compared over different densities (Table 6).
Plots that had been subjected to any harvesting operation between the measurements were included from the data material because of sufficient information about treatments. However, if the harvest was a result of an extraordinary situation (e.g. disease, wind damage), inclusion of the plots may have lead to an overestimated mortality rate. The problems related to the overestimation are probably relatively small. A more definite answer to this, however, is not possible to give as long as "real" independent date are not available.
Logistic model for prediction of mortality for individual trees have been developed. The model was developed from data set provided from Crimean pine plantations in Turkey. Although mortality as a phenomenon is complicated to model, the model fit and the validation tests turned out satisfactory.
The probability of a tree dying in Crimean pine plantations is the best explained by the relative size of a tree (d/![]() ), stand basal area and site index.
), stand basal area and site index.
The presented mortality models seem to hold an appropriate level of reliability, and they can be applied in forest management decision making activities. This does not mean that the model cannot be enhanced, hoewever. With sample plot remeasurements, the model should be evaluated and, if necessary, revised or calibrated.
Avila, O.B., Burkhart, H.E., 1992. Modeling survival of loblolly pine trees in thinned and unthinned plantations. Cand. J. For. Res. 22:1878-1882
Burgman, M., Incoll, W., Ades, P., Ferguson, I., Fletcher, T., Wholers, A., 1994. Mortality models for mountain and alpine ash. For Ecol. Manag. 67: 319-327
Eid, T., Tuhus, E., 2001. Models for individual tree mortality in Norway. For. Ecol. Manag. 154:69-84.
Hamilton, D.A., 1986. A logistic model of mortality in thinned and unthinned mixed conifer stands of Northern Idaho. For.Sci. 32:989-1000.
Köse, S., Yavuz, H., Mısır, M., Mısır, N., 2001. KTÜ Orman Fakültesi araştırma ormanı ladin meşcerelerinin hasılat esasları sonuç raporu, KTÜ Araştırma Fon Başkanlığı, 74p.
Monserud, R.A., 1976. Simulation of forest tree mortality. For. Sci. 22:438-444
Monserud, R.A., Sterba, H., 1999. Modeling individual tree mortality for Austrian forest species. For. Ecol. Manag. 113(2-3):109-123.
Neter, J., Maynes, S.E., 1970. On the appropriateness of the correlation coefficient with a 0.1 dependent variable. J.Am.Stat.Assoc.65:501-509.
Rautiainen, O., 1999. Spatial yield model for Shorea robusta in Nepal. For. Ecol. Manag. 119:151-162.
Yeşil, A., 1992. Değişik sıklık ve bonitetlerdeki kızılçam meşcerelerinin yaşa göre gelişimi, , İ.Ü. Fen Bilimleri Enstitüsü, İstanbul, 179 p.
1 Karadeniz Technical University Faculty of Forestry 61080 Trabzon / TURKEY e-mail: [email protected]
2 Karadeniz Technical University Faculty of Forestry 61080 Trabzon / TURKEY e-mail: [email protected]
3 Karadeniz Technical University Faculty of Forestry 61080 Trabzon / TURKEY e-mail: [email protected]