0524-B4
Nestor T. Baguinon 1 Marilou T. Merioles 2 Ernesto Alvarez 3 Reymar R. Castillo 4
This paper deals with Principal Component Analysis (PCA) and its application in forestry research problems in the Philippines. It was used to process vegetation data in three different studies. Habitat analysis in Palawan through PCA revealed 34 plots can be divided into two groups, secondary growth forest (SGF) and old growth forest (OGF). The 26 OGF plots were grouped into two, Non-Dipterocarp (NDF) and Dipterocarp Forests (DF). Two of the six NDF plots are Limestone forests. DF plots had dipterocarp trees (e.g. cf. Shorea, Dipterocarpus spp and Vatica sp). Site quality study in Quezon grouped weed communities into best, intermediate and poor sites as revealed by PCA and confirmed by the variation in height growth of test plants. Bioinvasion study in Makiling, Laguna used PCA to prove, graphically and mathematically, that the neotropical tree taxon mahogany (Swietenia macrophylla King) is bioinvasive. PCA ordination graph was produced for the tree layer and the undergrowth. Plots with Mahogany contributed more wildlings in the undergrowth, however plots with no Mahogany trees also registered mahogany wildlings. Regression showed PCA Factor Score 1 was positively related with percent mahogany. Regression between Shannon Diversity Index as Y-variable versus percent mahogany cover as X-variable resulted in a negative linear relationship. Mahogany reduces diversity implying its competitive ability at the expense of indigenous taxa in the natural forest undergrowth.
Habitat analysis, site quality assessment and bioinvasion determination studies were done in three different sites. In all cases, vegetation analysis by quadrat sampling was used. The multivariate analytical tool, PCA (Principal Component Analysis), was used to classify vegetation stands by plotting PCA scores in two-dimensional scattergram. PCA is a mathematical procedure for data reduction and interpretation. It reduces dimensionality in very complex multivariate data (Johnson and Wicnern 1982), for example vegetation data and covariates of environmental variables.
Habitat analysis shows how PCA display in graph unique natural forest stands that deserve protection because they are rare as their structure and species composition deviate from the typical stand. PCA distinguishes poor from good sites as reflected by vegetation data from weed communities and verified by the variable heights of test plant. Here, weed species can serve as site indicators. Finally, PCA and Stepwise Regression Analysis showed that mahogany (Swietenia macrophylla King) is bioinvasive.
Location of Study Sites. The locations of the three study sites are shown in Fig. 1. The habitat analysis study is located in Palawan island southwest of Luzon within the jurisdiction of Puerto Princesa City capital of the island province. The site quality analysis and the study on the bioinvasion of mahogany were conducted in Luzon island.
Fig. 1. Location map of study sites. Habitat Study in Palawan, Site Quality Study in Quezon, and Bioinvasion of Mahogany Study in Mt. Makiling, UPLB, Laguna.
Common Procedures for the Three Studies. All studies used quadrat sampling technique. The importance value of each taxon was calculated based on relative density, relative cover and relative frequency. Density of a taxon is based on count of individuals per plot. Cover of a taxon is based on the sum of basal area of trees in forest or green weight of each taxon per plot in weed community. Frequency of a taxon is the number of times it occurred over a total possible occurrence. The relative density is the ratio of the density of a taxon over the total density of all taxa in the study in percent. The relative cover is the ratio of the cover of a taxon over the total cover of all taxa in the study in percent. The relative frequency is the ratio of the frequency of a taxon over the total frequency of taxa in the study in percent. The sum of the relative density, relative cover and relative frequency for any taxon is the importance value of any taxon. The importance values of all taxa may be summarized in an M x N table such as shown below.
Importance values of M plant taxa across N plots/stands
M Species |
N plots | |||
Plot1 |
Plot2 |
------ |
PlotN | |
Species1 |
||||
Species2 |
||||
: |
||||
SpeciesM |
||||
Sum |
||||
Sorensen's similarity index (S) formula was used to determine the pair-wise similarity of the plots or stands used for each study and entered into a symmetric similarity matrix,
2w
Sa x b = ------------- x 100,
A + B
where
This matrix is input for computer principal component analysis. Graph that shows the groupings and spread of plots with respect to one another was printed as major output for further analysis. The general form for the similarity matrix may be presented below.
Similarity Matrix N x N Table
Plot 1 |
Plot 2 |
-------- |
Plot N | |
Plot 1 |
S1 x 1 |
S1 x 2 |
------- |
S1 x n |
Plot 2 |
S2 x 1 |
S2 x 2 |
------- |
S2 x n |
: |
: |
: |
: |
: |
Plot N |
Sn x 1 |
Sn x 2 |
------- |
Sn x n |
This symmetric similarity matrix is input data in the computer and mathematically processed by PCA procedure. A two-dimensional scatter graph is the output showing the grouping and spread of the plots (or stands) with respect to one another.
Study for the Habitat Analysis in Palawan. This study was conducted on August 1995 to February 1996 (Baguinon 1997). Thirty-four 20m x 20m square plots were laid in four predetermined forest strata (Fig. 2). Second growth forest (SGF) stratum had plots 1, 2, 3, 4, 5, 6, 7, and 9. These were at 50m interval from each other and the average elevation is 50 m asl. Plots 9 to 34 were laid in the old growth forest (OGF) stratum in rather unequal clusters at elevations ranging 50 to 150m.
Fig. 2. Map/ photograph of study site in Babuyan Valley, Puerto Princesa City, Palawan and corresponding location of 20m x 20m plots. (Note the karst at background.)
Study for the Site Quality Analysis in Quezon. This study was conducted on October, 1998 by an undergraduate thesis advisee (Merioles 1999). An ocular entitation of the open weed community in the Quezon Power Plant at Mauban, Quezon recognized five blocks. Block I slope aspect was north facing and its substrate was not mulched and well-exposed to the wind and sun. Block II was the same as the previous but much mulched and water-logged during rainy season, Block III was north facing but substrate was hard and the soil was thin. Block IV slope aspect was south facing and its substrate consisted of loose sandy and gravelly material. Block V slope aspect was south facing but located at higher elevation near the top of a hill.
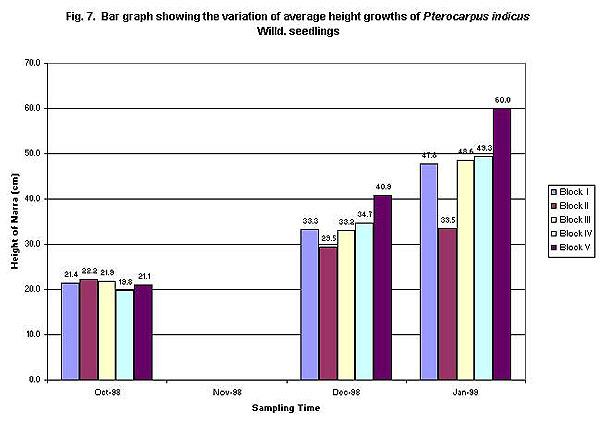
Five 1m x 1m square plots were randomly selected per Block thus made a total of 25 plots. The importance values of all weed taxa in the study were summarized in the 25 plots. After vegetation analysis, the plots were cultivated and planted to narra seedlings (Pterocarpus indicus Willd.) of equal heights. There were 4 narra seedlings planted to each plot. The average height growth of narra seedlings was determined for each block and Analysis of Variance (ANOVA) of the mean height growths of the five blocks at different sampling times was conducted. DMRT (Duncan's Multiple Range Test) determined the significantly different mean heights among the five blocks.
Study for the Bioinvasiveness of Mahogany (Swietenia macrophylla King). Two collaborative studies examined the invasiveness of Mahogany. One concentrated on the tree layer (Alvarez 2001) and the other on the undergrowth (Castillo 2001). The 24 plots in this study were laid systematically with Plot 1 starting from the edge of a Mahogany plantation established in 1940 at the Makiling Forest Reserve (Fig. 3). Each rectangular plot was 10m x 40m. It is subdivided into 16 grids each with 5m x 5m dimension. The tree layer and the undergrowth layer were separately analyzed.
All circumscribed wildlings and poles of < 10 cm dbh were enumerated. Counting individuals (density), measuring canopy coverage (cover) and counting the occurrence in 16 grids (frequency) were done for each taxon. For the canopy layer, all circumscribed trees with ≥ 10cm dbh were enumerated. Counting individuals (density), measuring basal area with tree diameter at breast height (cover) and counting the occurrence in 16 grids (frequency) were done for each taxon.
Stepwise regression analysis was employed to determine which independent variables impinge on either PCA Factor Scores 1 or 2 as response variable. The independent variables measured were % slope, % mahogany, Shannon's diversity index, Evenness index, Elevation, Number of species and % soil moisture content. Simple regression analysis was employed to see if the dependent variable Shannon's diversity index relates to the % mahogany.
Fig. 3. Map showing the location of the 62 year old Mahogany Plantation with respect to the systematically laid twenty-four (24)10m x 40m rectangular plots.
The analysis consisted of two PCA graphs. The first PCA (Fig. 4) was able to group plots (e.g. Plots 1, 3, 4, 5, 6, 7 and 8) from the secondary growth forest (SGF) and from the old growth forest (OGF). The second (Fig. 5) considered the OGF plots only. The was able to isolate the limestone OGF, Plots 30 and Plots 31. A second group was also identified which were located around Tibei Creek, Plots 27, 28, 29 and 32. These represented the Non-Dipterocarp Old Growth Forest (NDOGF). Character taxa are Pavetta indica L., Pterospermum perrinii Elm., Elaeocarpus sp, Kokoona ochracea (Elmer) Merr., Stemonurus luzoniensis (Merr.) Howard, Instia bijuga (Colebr.) O. Ktze., Ficus benjamina L., etc.
The rest of the eighteen plots represented the Dipterocarp OGF (DOGF), for example Plots 9 to 26. With exception of Plot 18, all the plots contained dipterocarps. Magpanggamot (cf. Shorea sp) is the most common, followed by panau (Dipterocarpus gracilis Bl.) and Hasselt's panau (D. hasseltii Bl.). One taxon of Vatica was found with magpanggamot in Plot 20. These taxa are absent or probably occasional in the aforementioned Non-Dipterocarp OGF.
Plot 18 was grouped with DOGF because the non-dipterocarp trees in this plot are also taxa associated with dipterocarps, for example, taxa like Atuna racemosa Rafin., Diospyros pilosanthera Blco., Actephila sp, Magnolia candollei (Bl.) Keng. var angatensis, Baccaurea sp, Chisocheton cumingianus (C.DC) Harms, Alstonia scholaris (L.) R.Br., Decaspermum fruticosum Forst. etc. In other DOGF plots, the following non-dipterocarp taxa were present like Diospyros discolor Willd., Dysoxylum arborescens (Bl.) Miq., Mangifera altissima Blco., Heliciopsis artocarpoides (Elm.) Sleum., Payena leeri (Teijsm. & Binn.) Kurz, Planchonella obovata (R.Br.) Pierre, to name a few. Common to both Non-dipterocarp and Dipterocarp forests were taxa, namely, Dacryodes rostrata (Bl.) H.J. Lam, Alseodaphne malabonga (Blco.) Kosterm., Koordersiodendron pinnatum (Blco) Merr., Pometia pinnata Forst. & Forst.f., Parkia speciosa Hassk., Buchanania arborescens (Bl.) Bl., Calophyllum blancoi Pl. & Tr., Chisocheton pentandrus (Blco.) Merr., Dracontomelum dao (Blco.) Merr. & Rolfe, Microdesmis grewiaefolia Planch., Sterculia comosa Wall., etc.
The first output upon PCA analysis among the 26 plots in five blocks of weed communities is shown in Fig. 6. The other output (Fig. 7) is a bar graph showing the average heights of narra seedlings at different sampling times in each of the five blocks. Block II is the poorest site and had the lowest height growth after four months with only 33cm. Blocks I, III and IV together averaged 48cm. The best site Block V registered average seedling height at 60cm.
Poor growth in Block II is explained by the waterlogging in that area during October to December. Andropogon aciculatus Retz. indicates compacted soil while the presence of Fimbristylis dichotoma (L.) Vahl. indicates waterlogging. Blocks I, III and IV show Axonopus compressus (Swartz) P. Beauv. as dominant. In Block V, the dominant was the creeper legume Desmodium triflorum (L.) DC. followed by Axonopus compressus. The dominance of a legume could mean nitrogen fixing in that block, a plus factor. It is possible that being a legume narra Pterocarpus indicus Willd. also positively responded as did the weed Desmodium triflorum. This is shown in the PCA ordination of the 26 weed stands below (Fig. 6). Poor sites are markedly separate from the rest of the plots.
The PCA shows that plots containing significant number of Mahogany trees tend to cluster together such as Plots 1, 2, 16, 18 and 19, however Plots 13 and 14 are grouped with plots without large Mahogany trees. This indicates that the later plots have species composition similar to the non-Mahogany stands. This observation indicates Mahogany is spreading to the adjacent natural forest.
In the analysis of the undergrowth, further evidence is given by the PCA graph for the undergrowth layer in Fig. 9. Plots 1, 2, 13, 14, 16, 18 and 19 being with mother trees of Mahogany contributed significant individuals in the undergrowth. Plots with no mother trees of Mahogany namely Plots 15, 20 and 21 also contributed significant number of individuals. This means Mahogany came from nearby Mahogany plantation. The cover percentage of Mahogany is also included in Fig. 9. Regression between the PCA Score (Factor Score 1) and Mahogany cover in the set of 24 plots resulted significant results. In Fig. 9, the abscissa bears the label PCA 1 = -.581 + 4.392. It has a high R 2 = .896 suggesting very good linear relationship. Furthermore, regression between the Shannon Diversity Index versus Mahogany cover interestingly resulted in a negative linear relationship (Fig. 10). Shannon Diversity Index decreases with the increase of Mahogany. Mahogany is giving indigenous taxa very stiff competition.
Principal component analysis (PCA) can be employed in many endeavors in Forestry. Its use in habitat analysis makes PCA a dependable tool for protected area management. This enables the identification of rare and unique habitats in a seemingly homogenous natural forest stand. This procedure of singling unique habitats can be replicated in other protected forest areas in the Philippines and elsewhere.
It has been shown also that PCA can determine site quality based of vegetation characteristics. PCA is complemented by the result of seedling testing. Fast growing seedlings are reflections of good site and correlates with plant ecological indicators. Hence, on the ground and on the map, good sites can be distinguished from poor sites even without the expensive protocol of collecting soils for chemical analysis. Plant indicators indirectly tell which are good and bad sites. This procedure can be adapted in forest lands earmarked for restoration, rehabilitation or reforestation.
Detection of bioinvasion by PCA has also been demonstrated. This application of PCA employs plot sampling, such that the plots traverse a gradient of diminishing probability of seed dispersal from a bioinvasive source. Due to random forces, even plots far from the bioinvasive source recruit wildlings. Ordination by PCA helps distinguish plots that contain higher or lower number of mahogany wildlings. When the bioinvasive agent is very aggressive it must provide stiff competition at the expense of indigenous taxa. This can be verified by letting the Shannon's Diversity as dependent variable and the bioinvasive taxon as independent variable. Since the linear relationship is negative, it proves that mahogany spreads while the indigenous biodiversity declines. Foresters regard forests as either man-made or natural. Thus, planting exotic trees is also reforestation. Perhaps this should be rectified and reforestation should be limited to the restoration of the original flora and fauna of the land..
Alvarez, E.M, 2001. Monitoring the spread of large leaf mahogany (Swietenia macrophylla King) in lowland dipterocarp forest in Mt. Makiling, Laguna. Unpublished undergraduate thesis, University of the Philippines Los Baños.
Baguinon, N.T, 1997. Relationship of some environmental factors with the tree layer and other plant communities in a lowland rainforest of Palawan, Philippines. Unpublished Ph.D. Dissertation, University of the Philippines Los Baños.
Castillo, R.R, 2001. Vegetation analysis of undergrowth plants in lowland forest of Mt. Makiling as a tool in assessing the advance and spread of big leaf mahogany (Swietenia macrophylla King). Unpublished undergraduate thesis, University of the Philippines Los Baños.
Johnson, R.A. and Wicnern, D.W, 1982. Applied Multivariate Statistical Analysis, Englewood Cliffs, N.J., Prentice-Hall, Inc.
Merioles, M.T, 1999. Vegetational analysis as a tool for site quality determination. Unpublished undergraduate thesis, University of the Philippines Los Baños.
1 Associate Professor, Department of Forest Biological Sciences, College of Forestry and Natural Resources, University of the Philippines Los Baños, College, Laguna, Philippines
Office Telefax (6349) 536-2773
Residence Telephone (6349) 536-3314
E-mail Address: [email protected]
2, 3, 4 Theses Advisees
Principal Component Analysis in Detecting
Site Quality, Habitats and Bio-invasiveness