0540-B1
M. Carlini, B. Capitoni, C. Belli, D. Papale and M. Vitullo[1]
The S.A.G.M.A. project (Satellite, Aereo, Gis, Monitoraggio, Addestramento) has been developed by CIRPS (Centro Interuniversitario di Ricerca Per lo Sviluppo Sostenibile) of the University La Sapienza of Rome, in collaboration with the Forest Ecology Laboratory of DiSAFRi University of Tuscia, Italy, financed by the Italian Agricultural and Forest Ministry. The aim of the project is to develop a forest fire risk forecast system, a burnt area mapping system, and a damage assessment system, integrated in SIM environment (Sistema Informativo della Montagna-GIS), managed by the Italian Forestry Service. The FPI (Fire Potential Index) is computed on regional scale, obtained by remote sensing and meteorological data. The A.SP.I.S. airborne sensor (Advanced SPectroscopic Imaging System) is employed to collect, at a very high geometric resolution, images of the burnt area surface. Red and NIR band spectrum are used to detect burnt areas and for the assessment of damage. The assessment of the fire-run areas is based on images thanks to Direct Georeferencing system, without the support of any given identification point on earth.
The present work shows the first year of activity on a test area.
The following is a progress report on the SAGMA (Satellite, Aereo, Gis, Monitoraggio, Addestramento) project which covers the technical and methodological aspects of the project itself. It refers to partial results reached up to August 2002, and seeks to analyse in the conclusion what worked and what can be improved. Furthermore, it provides an up-dated work plan for the remainder of the project, and outlines possible future prospects.
The SAGMA project, concerning the development of an integrated system for forecasting and monitoring forest fire risk and burnt area mappings, has been developed by CIRPS (Centro Interuniversitario di Ricerca sui Paesi in via di Sviluppo/Interuniversity Centre for Research on Developping Nations) of Rome University "La Sapienza", in collaboration with the Forest Ecology Laboratory of the University of Viterbo on behalf of the Ministry of Agricultural and Forestry Policy, with which an experimental phase was agreed upon covering the period August 2001 - October 2002 over a test area.
The project derives from the need to spread the use of new technology at the service of the State Forestry Service and subsequently to all entities that have the institutional task of defending wooded areas from fire, the need to coordinate activity in emergency situations and to assess damage at season’s end.
Service includes the periodical distribution of products derived from ground observation data acquired from satellite and aerial platforms and integrated meteorological data in the GIS environment. In particular, a modern system has been developed for forecasting daily fire risks in agro-forest areas, as well as the mapping of burnt areas, for geo-referencing and the measuring of areas hit by fire through tele-surveying from aerial platforms, which is what represents the truly innovative aspect of this sector. Together with experts of the State Forestry Service, the possibility of importing into and giving remote access to data and maps in the Mountain Informative System (SIM) is currently being studied, for the purpose of providing real time data to Comand Stations and other operational sites in the field. Project outputs are:
Fuel map
Forest fire risk map (daily in critical periods)
Burnt area mapping at season’s end
These products can be used during the fire season to identify areas at risk, in planning prevention activity based on the analysis of the entire summer season, and in the assessment of damage at season’s end.
The study area chosen is the north west part of the Latium Region, between the Provinces of Rome and Viterbo, for an area of 220,000 hectares (2,200 sq km), which represents 12.74% of the region’s total area. This covers a heterogenous area, including coastline between Civitavecchia and Tarquinia, wooded areas of the Tolfa hills, a lake environment on the shores of Lake Bracciano and the Tiber River valley. There are also urban and agricultural areas. The municipalities of this area are listed in Table 1.
Fig. 1: SAGMA project area
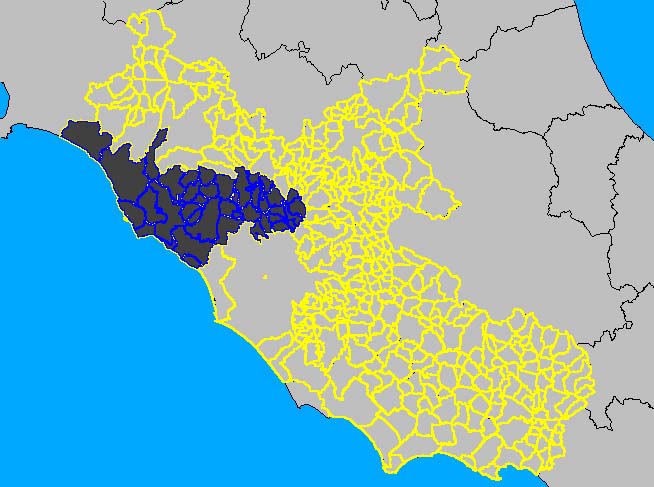
The area was chosen in collaboration with Dr. Pasquini, head of Regional Coordination for Latium, for the following reasons: a large variety of environments and different orographic conditions in which to test the system, and important aspect in view of applying the system at the national level. The perimeter was drawn in order to contain exactly the jurisdictions of the following Command Stations: Tolfa, Oriolo Romano, Vetralla, Civita Castellana, Ronciglione, Tarquinia, Manziana, Bracciano, Rignano Flaminio, Rome. This allows for all burnt area data to be summed on the basis of municipality and Command Station. This data will then be compared to data and statistics put together by these entities. The same applies to the risk forecasting model which can, for all the more reason, be broadcast and used in real time. Another objective was to contain the costs of aerial reconnaisance which were kept to a minimum thanks to the operative base located in the area in question (Fiano Romano). Furthermore, another advantage derives from the familiarity that experts have of the area in question, allowing them to better interpret relative data.
Tab. 1: list of municipalities in the project area
|
Municipalities |
Area (Km2) |
|
Al lumiere |
91,817 |
|
Anguillara |
72,566 |
|
Barbarano Romano |
37,260 |
|
Bassano Romano |
37,619 |
|
Blera |
92,983 |
|
Bracciano |
146,095 |
|
Calcata |
7,670 |
|
Campagnano di Roma |
46,645 |
|
Canale Monterano |
36,925 |
|
Capena |
29,063 |
|
Capranica |
40,585 |
|
Castel San Elia |
23,971 |
|
Castelnuovo di Porto |
30,840 |
|
Cerveteri |
134,359 |
|
Civitavecchia |
72,881 |
|
Civitella S.Paolo |
20,694 |
|
Faleria |
25,687 |
|
Fiano Romano |
41,298 |
|
Formello |
31,172 |
|
Ladispoli |
25,916 |
|
Magliano Romano |
20,483 |
|
Manziana |
23,849 |
|
Mazzano Romano |
28,743 |
|
Montalto di Castro |
189,739 |
|
Monteromano |
86,025 |
|
Monterosi |
10,760 |
|
Morlupo |
24,332 |
|
Nepi |
1,010 |
|
Oriolo Romano |
19,203 |
|
Riano |
25,204 |
|
Rignano Flaminio |
38,849 |
|
S.Marinella |
49,019 |
|
S.Oreste |
43,827 |
|
Sacrofano |
29,927 |
|
Sutri |
60,386 |
|
Tarquinia |
279,882 |
|
Tolfa |
167,673 |
|
Trevignano |
37,936 |
|
Vejano |
4,746 |
|
Villa S. Giovanni |
5,271 |
|
TOTAL AREA |
2192.912 Km2 |
The following are the area’s fire statistics from 1987 to 2001, as provided by the State Forestry Service, which records fires on agro-forest areas. It must be kept in mind that over the years the definition of burnt area has changed various times and thus the minimum recorded fire extension.
Tab 2: 1987-2000 fire statistics
|
YEAR |
QUANTITY OF FIRES |
BURNT AREA IN HECTARES |
|
1987 |
62 |
411 |
|
1988 |
144 |
252 |
|
1989 |
69 |
34 |
|
1990 |
125 |
326 |
|
1991 |
67 |
114 |
|
1992 |
94 |
120 |
|
1993 |
95 |
269 |
|
1994 |
71 |
179 |
|
1995 |
158 |
202 |
|
1996 |
47 |
360 |
|
1997 |
22 |
276 |
|
1998 |
34 |
514 |
|
1999 |
22 |
499 |
|
2000 |
65 |
1095 |
|
2001 |
55 |
804 |
The fuel type map is an important product developed with the help of land surveys, the processing of satellite survey data and the photo-interpretation of A.SP.I.S. flight images. This is the first time that a study of this kind is carried out on a part of Latium’s territory. The map shows how fuel, as a function of type and homogeneity category, is distributed across the territory and thus provides and important indications on the behaviour of fires. Furthermore, this map is also used as an intermediate product for the calculation of the integrated fire risk index used in SAGMA (FPI).
Results
Figure 2 is a fuel type map at 30 m. Of the four classifications reached, after an analysis of the same for comparison with official ground use statistics, it was determined that the most reliable was the one deriving from multi-temperal analysis, known as "mis".
Fig. 2: Fuel map
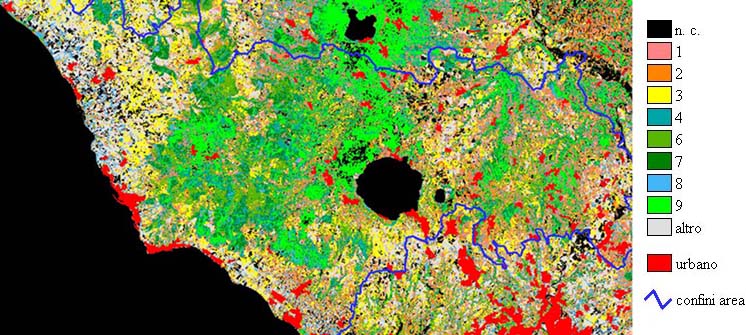
It should be noted that the "other" category partially covers agriculture not related to any fuel model (this category appears mainly in flat areas destined to agriculture and near the coast between Civitavecchia and Tarquinia). The black area refers to areas that could not be classified. This includes inland water.
The accuracy of this image was obtained through the study of a confusion matrix created with a part of the data acquired on the ground that was not used for the classification. This matrix puts the map’s data in relation with ground reality. The resulting KIA (Kappa Index of Agreement) total, which expresses the relation between real data and the derived data, is equal to 8.82 (K = 1 perfect agreement; K=0, random agreement).
Many different methods are used for assessing forest fire risk. There are strictly meteorological indices and structural (or static) ones. Structural indices are based on parameters that do not change in the short term. These included variables that are more or less static, for example topography or the type of vegetative cover. Structural risk indices are indicators of stable conditions correlated to the out-break and behaviour of fire. Dynamic indices determine the probability of out-break and the possibility of fire propagation. These indices are based principally on the determination of the state of vegetation that can be derived directly from the use of meteorological variables, or indirectly, through the use of vegetation indices derived from aerial survey data.
The Forest Potential Index (FPI) was developped by Burgan et al. (1998) putting together various factors that are generally used independently of strictly structural or dynamic risk indices, representing an interesting integrated approach to the management of forest fire risk. The FPI is today used for the forecasting of daily risk by the National Fire Ranger Rating System (NFDRS) of the USA. An on-going research programme was initiated in 2000 for experimentation, with various adaptations, at the European level, carried out by the ED DC Joint Research Centre.
The FPI model requires the following input:
- Fuel Map: the map is used to determine the type of fuel;
- Aerial survey: the NDVI vegetation index derived from NOAA AVHRR images is used to calculate the Relative Grenness (RG). RG is an indicator of how green vegetation is in relation to how green it should be. This is used in the model as a surrogate information for the level of humidity contained in living vegetation;
- Meteorological data
Fig. 3: FPI Model diagram
Initial results
The Forest Ecology Laboratory of the Tuscia University (Viterbo) has nearly completed gathering, through a FTP network, all useful data for the processing of an index for the period that goes between June and September 2002, which for Latium corresponds to the firefighting campaign. The Arsial data alone requires the intervention of an operator for a short time each day. It is nevertheless possible to automize the acquisition of metereological data with the activation of a receiving station, in case the project becomes operative at the national level.
Data is currently being processed for the daily FPI calculation for the entire period. This part is behind the schedule, due to problems in obtaining meteorological data, as on various occasions and for lengths of time, the network of ARSIAL stations was out of order. There were also problems with recording data in the Tarquinia and the Montefiascone stations, while data from the new Monterotondo station were available only as of August. Further delays derived from the time required to adapt the methodology of the FPI calculation process, which had been used in the US and in Europe at the continental scale, to the regional level. A module is being developed that will allow for the automatic calculation of FPI.
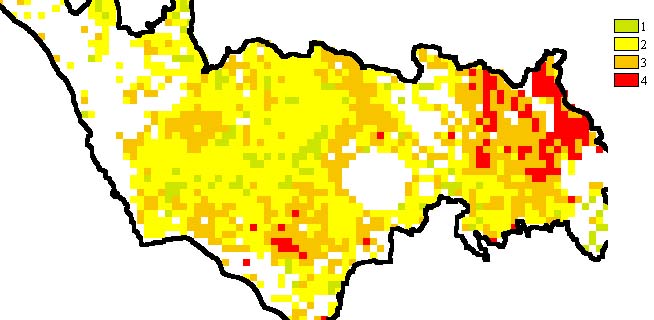
Figure 4 gives an example of a FPI map produced for the day of July 12. The index has a value that goes between 0 and 100, where 0 corresponds to a no-risk condition and 100 to extreme risk. To facilitate visual interpretation, FPI was divided into four risk categories, ranging from 1 (minimum risk) to 4 (maximum risk).
Fig. 4: Fire Potential Index map
This part covers the work that has been carried out in certain test areas for the purpose of verifying the methodology and the accuracy of the burnt area assessment and the determination of damage.
A.SP.I.S. image aquisition
Between the months of July and August, approximately 12 hours of flight were carried out to acquire sample reference areas, burnt and not, chosen to represent different possibile situations. The flights involved the provinces of Rome and Viterbo. Flight altitude was chosen in relation to the area to be surveyed and was between 800 and 1300 m.
A ground GPS survey was conducted on these areas and land registry data was gathered for the purpose of comparing different possible survey techniques.
Assessment of the test area extension and damage evaluation
The test forsaw:
- the comparison of different assessments of the unburnt sample area surveyed through: ground GPS survey, processing of A.SP.I.S. images using only flight data (without the aid of ground reference points or other cartography) and land registry data.
- Assessment of two burnt areas with A.SP.I.S. images
GPS data was taken on the ground in stand alone mode (without differential correction), acquiring the average data across 300 positions. This procedure allowed for position accuracy within a few metres. Surface area was calculated with the Erone formula.
A.SP.I.S. images were pre-processed to correct them in radiometric and geometric terms. The following data was used for calculation and for surface assessment without ground survey: system geometry (lens draught, CCD size, pixel size, etc.), flight data (e.g. altitude, attitude movements) and DEM at a resolution of 40 m
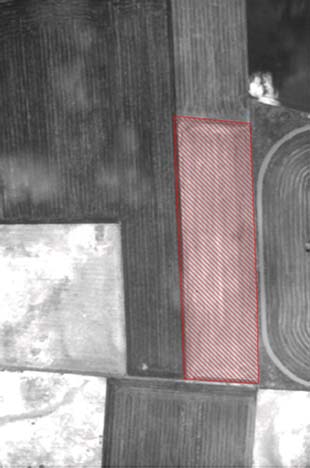
Land registry data was checked for the sample area.
Fig. 5. Sample area
Results were:
Tab. 3: Surface area assessment in sample area
|
Area according to land registry data |
GPS Area |
A.SP.I.S. area |
|
2,05 ha |
1,96 ha (-4,3%) |
1,86 ha (-9,27%) |
It is to be noted that the assessment done with A.SP.I.S. suffered from the use of an inaccurate DEM.
The same technique was used for calculating burnt areas. To evaluate damage, infrared sensor images were used in addition to images acquired with A.SP.I.S. sensors.
Three categories were indentified: vegetation not affected by fire (grey tones), vegetation with medium damage (green), severely damaged vegetation (red). A relatively rapid recovery is foreseen for areas of medium damage.
Fig. 6: Burnt area I
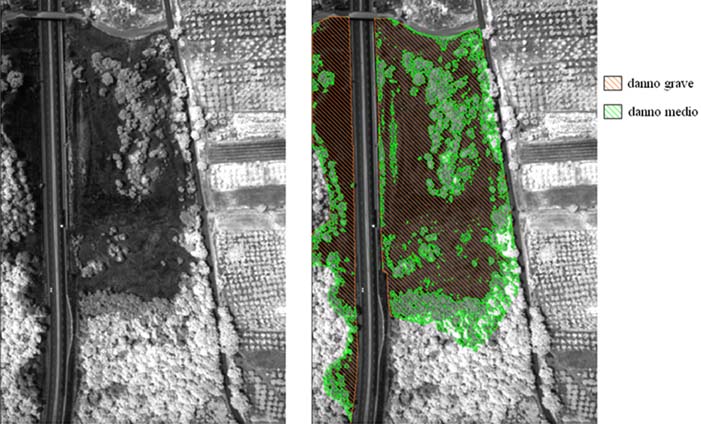
Tab. 4: Burnt area assessment of area I
|
Vegetation with medium damage |
Vegetation with serious damage |
|
1,280 ha |
3,055 ha |
Fig. 7: Burnt area II
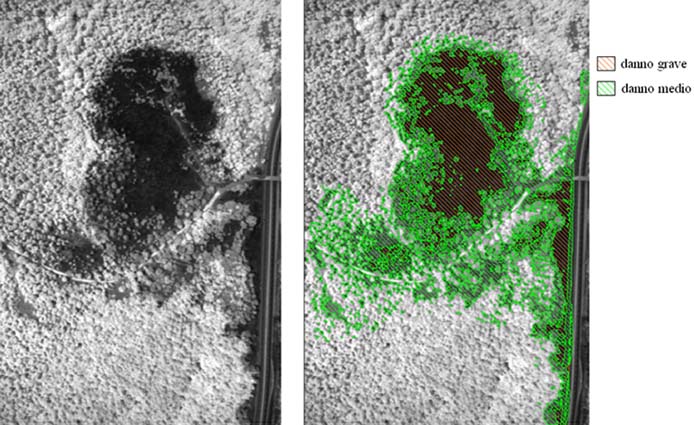
Tab. 5: Burnt area assessment of area II
|
Vegetation with medium damage |
Vegetation with serious damage |
|
3,814 ha |
2,677 ha |
An important aspect for the assessment of damage is the time elapsed between the fire and the images taken. Test flights were taken one week from the event, therefore it is assumed there is no recovery in vegetation. The plan in the future is to do a series of flights over time to check on plant recovery.
Procedures for burnt area mapping are currently being defined. The very new technique of image geo-referencing without the aid of Ground Control Point is usually referred to as Direct Georeferencing. This is possible today thanks to new instruments that allow for the recording of the attitude movements of the mobile platform from which data is collected. Difficulties due to the integration of the GPS system, for the recording of attitude movements, have as a result that the use of this data is incomplete. The definitive fine tuning of this procedure and the use of higher resolution DEM will allow for correct geo-referencing, burnt area mapping, and improved accuracy in the estimate of the same.
Following the project’s first phase, results can be summarized as follows:
- A.SP.I.S. system adaptation has been completed; ground surveys were carried out resulting in 240 test areas, and fuel maps were subsequently completed with the processing of aerial imaging;
- The network used for acquiring all data required for FPI processing was set up;
- An adapted methodology index was set up allowing for the processing of all data;
- Tests were carried out to verify the accuracy of the burnt area mapping and damage assessment
Delay against the intial schedule were due to the index processing and updating. This was due to various factors, as was highlighted previously, but the need to test and validate the model with real fire data from 2002 (which will occur in the next months, once official data is released) seems pre-eminent. In fact, only once the correlation between forecast data and real data is verified, followed by modification and fixing of the FPI, can the index be used in real time with accertained value.
Work is being done on various aspects to improve the index, now that the rough version has been developed. In particular, there is an attempt to enrich the network of meteorological stations with data arriving from other entities such as UCEA, Assofrutti, and the Italian Hydrographic Institute, that manage their own meteorological network. Research is oriented mainly on the coastline, near Civitavecchia and Fiumicino and would allow for the extrapolation of temperature and relative humidity maps, more reliable in this part of the area. Another aspect that is still under study is research for an appropriate algorythm for processing AVHRR images for cloud cover maps. Furthermore, all procedures for processing and calculations, which are currently carried out semi-automatically, are being automated.
Another no-less important aspect, so that research activity results in strong pratical application, is to verify, along with the help of the State Forestry Service, how to implement risk and burnt area maps into the SIM (Mountain Information System).
As far as the burnt area mapping is concerned, tests carried out on sample areas confirmed the potential for the use of new technology and methodology at the service of the forest fire sector. Surface estimates are to be considered improvable as soon as a more accurate DEM is available (currently a 40 m resolution DEM is used) and attitude movement data is fully used. The request has been made to the State Forestry Service’s SIM for the use of 20 m DEM of the IGM (Istituto Geografico Militare).
Based on the values obtained from tests, a difference of just 5% with respect to ground surveys with GPS seems acceptable and encouraging, and makes the continuation of work a priority. It should be kept in mind that currently the perimeter and the area estimate is carried out on the ground, with the aid of a map with all possible margins of error. The use of GPS, moreover, does not seem completely possible, given orographic difficulties in covering the perimeter of burnt areas, without making evaluation errors on the ground and with the availability of GPS signals, continuously and under vegetation. From the test it is interesting to note how, differently from the ground, there is a correct evaluation of where the fire passed.
As a result of this report, work in the next few months will vary and be enriched as compared to the initial plan. In the time remaining, flights will be completed for the burnt area mapping, to cover the entire area. At the same time, related data will be processed, followed by the development of maps. As for the index, data processing for the period of June-September is currently underway, and at the same time, improvements are being implemented. At the end of this phase, and once official statistics for fires in 2002 is available, validation will take place.
At this point, it would be useful to make some general considerations. The SAGMA project is addressing certain aspects of the forest fire sectors, that of risk forecasting and burnt area mapping, of which there is very little experience at the national level, which goes anyway in other directions and for which there is no unique reference, if only the framework law no. 353 of November, 2000.
The experience that is currently being gained in certainly important and not free of problematics and many aspects that can be improved. Certain delays that are being experienced in reaching results appear to be inevitable and can be accounted for a priori in a process that has a strong research component. Initial results are nevertheless positive and can make us hopeful for the continuation of work.
Anderson H.E. 1985. Moisture and fine forest fuel response. In: Proceedings Eighth Conference of Fire and Forest Meteorology (edited by L.R. Donoghue and R.E. Martin), Detroit, Michigan, April 29-May 2, 1985. Society of American Foresters, Bethesda, Maryland. pp 192-199.
Bovio G., Camia A. 1997. Previsione del pericolo di incendio boschivo in Sardegna. IFM n. 6, 405-428
Bradshaw L.S.; Deeming J.E.; Burgan R.E.; Cohen J.D. 1983. The 1978 National Fire-Danger Rating System: Technical Documentation. United States Department of Agriculture, Forest Service, General Technical Report INT-169, Intermountain Forest and Range Experiment Station, Ogden, Utah. 44 pp.
Burgan RE, Klaver RW, Klaver JM 1998. Fuel models and fire potential from satellite and surface observation. Interna-tionalJournal of Wildland Fire. 8: 159-170.
Burgan R.E.; Hartford R.A. 1993. Monitoring vegetation greenness with satellite data. United States Department of Agriculture, Forest Service, General Technical Report INT-297, Intermountain Forest and Range Experiment Station, Ogden, Utah. 13 pp.
Capitoni B. 2000. Adattamento alla realtà forestale del centro Italia del modello di propagazione degli incendi boschivi (BeHave) applicato negli USA. Tesi di laurea, Facoltà di Agraria, Università di Viterbo.
Chuvieco E. 1999. Remote sensing of large wildfires in the European Mediterranean basin. Ed. Springer.
Sebastian-Lopez, A., Libertà, G., and San-Miguel-Ayanz, J., 1999. An integrated forest risk for Europe. 20th EARSeL SYMPOSIUM, Remote Sensing in the 21st Century: A decade of Trans-European Remote Sensing Cooperation, 14-16 June 2000, Dresden, Germany.
Lovreglio R. Leone V., 2000. - La previsione del
comportamento del fuoco in
impianti di arboricoltura da legno.
Legno Cellulosa e Carta, 3/4:2-9.
Ministero Delle Risorse Agricole, Alimentari e Forestali, Corpo Forestale dello Stato, Servizio Antincendio Boschivo. 2000. Gli incendi boschivi dell’anno 2000.
Mollicone D., 1994. Sviluppo di un nuovo sistema multicanale a bande preselezionabili per il telerilevamento delle risorse forestali (Digital Aircraft Resources and Wildlife ImagiNg - Darwin). Tesi di laurea, Facoltà di Agraria, Università di Viterbo.
Papale D., Vitello V., Belli C., Valentini R., 2002. Un nuovo strumento di proximal sensing per lo studio degli ecosistemi agroforestali: l’AS.P.I.S. (Advanced SPectroscopic Imaging System). Atti del Convegno Nazionale SISEF.
San Miguel-Ayanz J., Burgan R.E. 2002. Integration of satellite sensor data, fuel type maps and meteorological observations for evaluation of forest fire risk at the pan-European scale. International Journal of Remote Sensing. Vol. 23, 13 pp, 2713-2719.
Simard A.J. 1968. The moisture content of forest fuel. A review of the basic concepts. FF-X-14, Forest Fire Research Institute, Ottawa, Ontario
| [1] Contact information: Davide
Pontani, Ministero delle Politiche Agricole e Forestali, Direzione Generale
delle Risorse Forestali Montane e Idriche, Corpo Forestale dello Stato,
Servizio Antincendio Boschivo, Via Carducci, 5, 00187 Rome, Italy. Tel:
+39 06 46657042; Fax: +39 06 42012815; Email: [email protected];
Website: http://www.corpoforestale.it |