0648-B1
G. Cornelis van Kooten and Sen Wang 1
The emphasis on pure economic explanations for economic development has recently shifted to cultural, social and institutional factors. An ordinary least squares (OLS) regression equation is used to examine the relationship between deforestation and economic, institutional and social capital variables for 117 countries. Institutional, economic and social capital variables are significantly related to deforestation, although there is no evidence to support the existence of an environmental Kuznets relation. While the results cannot be used to discuss any one country specifically, they do provide insight into the general roles of social and institutional factors in deforestation.
Deforestation is defined as the conversion of forest to another land use, usually agriculture. According to the FAO, deforestation occurs when forest canopy cover is reduced to 10% or less. Global patterns of deforestation are indicated in Table 1. Forest cover in the majority of developing countries has declines. Tropical forests in particular are felt to be disappearing at a rapid rate (Tables 1 and 2), alarmingly so because they are thought to account for most of the globe's biodiversity, over half of the earth's 10-30 million species (Lovejoy 1997).
We hypothesize that rates of deforestation are dependent not only on economic variables, but also on the existence of certain critical levels of institutional development and social capital.
The relationship between development (as represented by per capita income) and the rate of deforestation is expected to reveal the existence of an environmental Kuznets curve (EKC). The basic idea underlying the EKC applied to deforestation is as follows: a very poor country has a relatively low rate of deforestation because it lacks the resources to undertake large-scale logging operations, but as income rises, deforestation rates may initially rise as forest exploitation aids economic development. As income continues to grow and more environmental amenities are demanded, a point is reached where further increases in income lead to reduced rates of deforestation, or even reforestation to correct earlier damage (Bhattarai and Hammig 2001). An EKC relation is found if the sign on the per capita GDP variable is negative, and that on GDP-squared is positive with both parameters being statistically significant. The consequent shape of the EKC is a U.
The emphasis on pure economic explanations for economic development (monetary and fiscal policies, trade policy) has shifted to focus on the role of cultural, historical, social and institutional factors (North 1990; Woolcock 1997; Landes 1998; Shleifer and Vishny 1998; Fukuyama 1999; Ostrom 2000; Easterly 2001). Particular emphasis has been on the institutional environment as a driver of development. The institutional environment consists of formal rules (constitutions, laws and property rights) and informal constraints (sanctions, taboos, customs, traditions, and norms or codes of conduct) that structure political, economic and social interactions. Informal constraints are commonly referred to as `social capital', which is "the shared knowledge, understandings, norms, rules, and expectations about patterns of interactions that groups of individuals bring to a recurrent activity" (Ostrom 2000, p. 176). It refers to "features of social organizations, such as networks, norms and trust, that facilitate action and cooperation for mutual benefit" (Putnam 1993, pp. 35-36).
Institutional variables used in this study are based on data from the index of economic freedom (Gwartney et al. 2001). The four indices used in this analysis relate to the `size of government', the `freedom to use alternative currencies', `legal structure and property rights' and the `freedom of exchange in capital and financial markets'. Each index ranges from 0.0 (least economic freedom) to 10.0 (greatest economic freedom). The economic freedom indices correlate positively to measures of social progress, such as income and economic growth, as well as low levels of corruption and high levels of human development.
The data are analyzed using the following ordinary least squares (OLS) regression model:
Di = α + ![]() ßk Xi,k + µi,
ßk Xi,k + µi,
where Di is the average annual rate of deforestation (1990-2000) for country i, i=1,...,n countries, α is the intercept term, ßk are the coefficients to be estimated, Xk (k=1,...,K) are the K explanatory variables described in Table 4, and µi represents the error terms. White's (1978) correction of standard errors for possible heteroskedasticity and model misspecification is used.
Data were collected for 117 countries. The dependent variable in the regression analysis is the rate of deforestation, based on the average annual rate of change in forest cover from 1990 to 2000. Changes in forest cover data were obtained from the FAO (2001b), which defines forest cover change as the net change in forests, including gains and losses in natural forest areas and expansion of forest plantations. The dependent variable has been constructed so that a positive value indicates a higher rate of deforestation, while a negative value indicates reforestation.
The independent variables and their descriptions, units of measurement and expected relationships, with the average annual rate of forest cover change, are presented in Table 3. Descriptive statistics are presented in Table 4. Variables that proved to be statistically insignificant in all of the preliminary regressions were not included for further consideration in this analysis. This was the case for several institutional variables represented by certain indexes of economic freedom. Foreign direct investment, inflation rates, population growth, an index of sustainability, forest output, agricultural exports, forest-certification status and population density were other variables that were excluded. Final regression results are reported in Table 5.
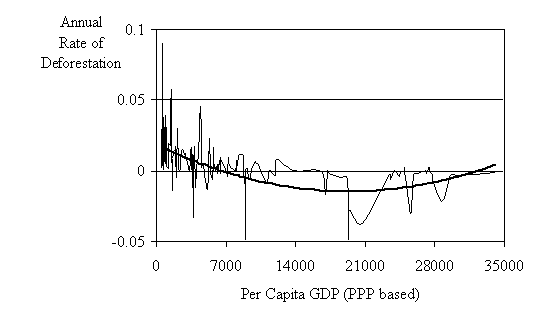
In the first model of Table 5, the rate of deforestation was regressed against only GDP and GDP-squared. The purpose of this regression was to examine the relationship between deforestation and income growth in order to test whether there is empirical evidence for an environmental Kuznets relation. Both variables are statistically significant at 1% or less and have the correct signs. As GDP increases during early development, the rate of deforestation declines immediately. We find that deforestation rates fall to zero as income rises to about $6,000, and, as it rises further, that countries begin to reforest areas previously deforested. Thus, forest area increases, but reforestation rates decline beyond about $19,500 (Figure 1), with deforestation/reforestation rates reaching equilibrium (no change in forested area) in the richest countries. In this sense, there clearly does exist an environmental Kuznets relation.
This result does not change when all of the variables are included in the regression (model 2). The statistical significance of per capita GDP and GDP-squared falls slightly, while the `freedom to exchange in capital and financial markets' index is statistically significant (at the 1% level), but of the wrong expected sign. This result suggests, contrary to our earlier notion, that freedom to exchange capital actually hastens forest depletion, as firms are better able to turn forests into cash. The OECD dummy variable is statistically significant at the 10% level, but also of the wrong expected sign. This suggests that OECD countries may be somewhat more likely to deforest than other countries. None of the other variables provide a statistically significant explanation of deforestation.
It is only when per capita GDP is removed from the model (models 3 and 4, Table 5) that other institutional variables (`size of government', corruption and possibly `freedom to use alternative currencies') become statistically significant explainers of deforestation. While these variables are correlated with income, they do illustrate the importance of institutions and social capital in affecting environmental degradation. Countries with permit currency conversion and ones that are less corrupt are less likely to experience deforestation (as expected), while larger governments may hasten deforestation (contrary to what was expected). In models 3 and 4, agricultural output is also an important explainer of the likelihood that a country degrades its forests: the greater a country's agricultural output, however, the less likely the country has degraded its forests in the past decade. Yet, a greater rural population (more workers in agriculture) leads to higher rates of deforestation (as indicated especially in model 4). This suggests that, if agriculture output is adequate, countries may deforest less, but, as the number of people in rural areas increases (meaning more farm workers), deforestation is more likely.
Finally, and surprisingly, neither the degree of literacy nor protection of property rights affects the likelihood that a country will degrade its forests at a higher or lower rate. As expected, forest exports do not affect deforestation because the cases where higher forest exports increase rates of deforestation appear to be offset by those where they result in a greater desire to protect or even expand forests.
This study examines the effects of economic, institutional and social capital variables on deforestation across 117 countries. The results do not provide direct support for the EKC notion. Rates of deforestation decline continuously as income increases from a low of some $500 per person per year (purchasing power parity basis) to about $6,500, after which countries begin to afforest. The rate of afforestation peaks at some $19,500 per capita after which it declines to zero for the richest countries. In this sense, this study provides evidence for an EKC.
Institutional factors do appear to be important explanatory factors, but their influence is mixed and difficult to explain. There is some, albeit weak, evidence over the decade 1990-2000 that a country's ability to provide stable monetary policy and solid financial institutions with few restrictions on foreign capital transactions indicates economic agents in that country have weaker incentives to manage forestlands, having better ability to liquidate forest assets. Trust, measured as a `control of corruption' index, appears to be a more important explanatory variable, particularly in the absence of income. That is, countries with less corruption are less likely to liquidate forest assets. Not unexpectedly, countries that have high rural populations are also more likely to deforest than those with lower rural populations.
The results of this analysis indicate a need for institutional reforms such as greater government involvement and freedom of financial markets, in order to stabilize economies and raise the demand for environmental improvements. Because the analysis presented above is cross-sectional and includes more than 100 countries of differing development status, the results cannot be used to discuss any one country specifically, nor can they be used to provide global-scale policy recommendations. They do, however, provide insight into the general roles of social and institutional factors in deforestation. Further research might use time series data to estimate more accurately an EKC for deforestation. Placing an emphasis on one nation or region, or a number of similar nations or regions may produce results that would be more useful in developing policy implications.
BHATTARAI, M. and Hammig, M. 2001. Institutions and the environmental Kuznets Curve for deforestation: A crosscountry analysis for Latin America, Africa and Asia. World Development 29: 995-1010.
DASGUPTA, P. 2000. Economic progress and the idea of social capital. In: Dasgupta, P. and SERAGELDIN, I. (eds.) Social capital: A multifaceted perspective (pp. 325-424). The World Bank, Washington, DC:
DEACON, R.T. 1995. Assessing the relationship between government policy and deforestation. Journal of Environmental Economics and Management 28: 1-18.
EASTERLY, W. 2001. The elusive quest for growth: Economists' adventures and misadventures in the tropics. The MIT Press, Cambridge, MA.
EHRHARDT-MARTINEZ, K., Crenshaw, E.M. and Jenkins, J.C. 2002. Deforestation and the environmental Kuznets Curve: A cross-national investigation of intervening mechanisms. Social Science Quarterly 83: 226-243.
FAO. 2001a. FAOSTAT online statistical database. Found at: http://apps.fao.org/default.htm.
FAO. 2001b. State of the world's forests 2001. Food and Agriculture Organization, Rome.
FUKUYAMA, F. 1999. The great disruption: Human nature and the reconstitution of social order. The Free Press, New York.
GWARTNEY, J., Lawson, R., Park, W. and Skipton, C. 2001. Economic freedom of the world: 2001 annual report. The Fraser Institute, Vancouver, Canada.
INTERNATIONAL MONETARY FUND. 2001. IMF world economic outlook (WEO), the information technology revolution, October 2001 - contents. Found at: http://www.imf.org/external/ pubs/ft/weo/2001/02/index.htm.
KUZNETS, S. 1955. Economic growth and income inequality. American Economic Review 45: 1-28.
LANDES, D.S. 1998. The wealth and poverty of nations: Why some are so rich and some so poor. W.W. Norton & Company, New York.
LOVEJOY, T.E. 1997. Biodiversity: what is it? In M.L. Reaka-Kudla et al. (Eds.), Biodiversity II: Understanding and protecting our natural resources. Joseph Henry Press, Washington, DC.
NORTH, D.C. 1990. Institutions, institutional change and economic performance. Cambridge University Press, Cambridge, UK.
OSTROM, E. 2000. Social capital: A fad or a fundamental concept? In: Dasgupta, P. and Serageldin, I. (eds.) Social capital: A multifaceted perspective. The World Bank, Washington, DC, pp. 172-214.
PUTNAM, R.D. 1993, March 21. The prosperous community: Social capital and public life. The American Prospect 4(13): 35-42.
SHLEIFER, A. and Vishny, R.W. 1998. The grabbing hand: Government pathologies and their cures. Harvard University Press, Cambridge, MA.
UNDP. 2001. Human development report 2001: Making new technologies work for human development. Oxford University Press, New York.
VAN KOOTEN, G.C., Sedjo, R.A. and Bulte, E.H. 1999. Tropical deforestation: Issues and policies. In: Folmer, H. and Tietenberg, T. (eds.) The International Yearbook of Environmental and Resource Economics 1999/2000. Edward Elgar, Cheltenham, UK, pp. 198-249.
WHITE, H. 1978. A heteroskedasticity consistent covariance matrix and a direct test for heteroskedasticity. Econometrica 46: 817-838.
WOOLCOCK, M. 1997. Social capital and economic development: Toward a theoretical synthesis and policy framework. Theory and Society 27: 151-208.
Table 1. Forest area and rates of deforestation, 1981-90, 1990-95, 1990-2000.
Region/country |
Forest cover, |
Average annual change in forest cover | |||||
1981-90 |
1990-95 |
1990-2000 | |||||
Area |
Rate |
Area |
Rate (%) |
Area |
Rate (%) | ||
Africa |
649.9 |
- 4,100 |
- 0.7 |
- 3,748 |
- 0.7 |
-5,264 |
-0.7 |
Asia |
524.1 |
a |
a |
- 3,328 |
- 0.7 |
-651 |
-0.1 |
Europe |
161.6 |
a |
a |
+389 |
+0.3 |
+424 |
+0.3 |
Former USSR |
901.4 |
A |
a |
+557 |
+0.1 |
+739 |
+0.1 |
Canada |
244.6 |
A |
a |
+175 |
+0.1 |
0 |
0.0 |
U.S.A. |
226.0 |
A |
a |
+589 |
+0.3 |
+388 |
+0.2 |
Central Am. & Mexico |
73.0 |
- 1,112 |
- 1.5 |
- 959 |
- 1.2 |
-971 |
-1.2 |
Caribbean |
5.7 |
- 122 |
- 0.3 |
- 78 |
- 1.7 |
+13 |
+0.2 |
South America |
885.6 |
a |
a |
- 4,774 |
- 0.5 |
-3,711 |
-0.4 |
Oceania |
197.6 |
a |
a |
- 91 |
- 0.1 |
-365 |
-0.2 |
Global totalb |
3,869.5 |
A |
a |
- 11,269 |
- 0.3 |
-9,397 |
-0.2 |
| Source: FAO (2001b, 1993, 1997) a Not available or not applicable b Totals may not tally due to rounding |
Table 2: Annual Change in Forest Cover, 1990-2000 (106 ha)
Domain |
Natural forest |
Forest plantations |
Total forest | ||||||
Loss |
Gain |
Net change |
Gain |
Net change |
Net change | ||||
Deforestation |
Conversion to forest plantations |
Total loss |
Natural expansion of forest |
Conversion from natural forest |
Afforestation | ||||
Tropical areas |
-14.2 |
-1.0 |
-15.2 |
+1.0 |
-14.2 |
+1.0 |
+0.9 |
+1.9 |
-12.3 |
Non-tropical areas |
-0.4 |
-0.5 |
-0.9 |
+2.6 |
+1.7 |
+0.5 |
+0.7 |
+1.2 |
+2.9 |
Global total |
-14.6 |
-1.5 |
-16.1 |
+3.6 |
-12.5 |
+1.5 |
+1.6 |
+3.1 |
-9.4 |
| Source: FAO (2001b) |
Table 3: Independent Variables and Expected Relationships with the Rate of Deforestation
Independent variable |
Description |
Unit of measurement |
Expected sign |
Economic |
|||
GDP |
PPP weighted GDP per capita, 2000 |
US$ |
+ |
Forest exports |
Forest exports as a proportion of total exports, 2000 |
% |
No expectation |
Agricultural Output |
Agricultural output per capita, 1999. |
Index |
+ |
Institutional |
|||
OECD |
A dummy variable. 1.0 indicates a country is an OECD member. |
- | |
Exchange |
Freedom of exchange in capital and financial markets, 1999 (0-10) |
Index |
- |
Property Rights |
Legal structure and property rights, 1999 (0-10) |
Index |
- |
Currency |
Freedom to use alternative currencies, 1999 |
Index |
- |
Size |
Size of government, 1999 (0-10) |
Index |
- |
Social Capital |
|||
Corruption |
2001 Control of Corruption Index (-2.5 - +2.5) |
Index |
+ |
Literacy |
A country's overall literacy rate. |
% |
- |
Other Factors |
|||
Rural Population |
The proportion of the total population that lives in rural areas. |
+ |
Table 4. Descriptive statistics of variables used in the regression analysis.
Variable |
Obs. |
Mean |
St. Dev. |
Dependent |
|||
Rate of Deforestation |
117 |
-0.0014 |
99008.6 |
Economic regressors |
|||
GDP |
115 |
9128.5 |
9044.78 |
Forest Product Exports |
111 |
0.0391 |
0.0654 |
Agricultural Output |
114 |
100.5 |
23.05 |
Institutional regressors (indices) |
|||
OECD |
117 |
0.1880 |
0.3924 |
Freedom of Exchange in Capital and Financial Markets |
114 |
6.1702 |
2.3310 |
Legal Structure and Property Rights |
110 |
5.956 |
2.6136 |
Size of Government |
112 |
6.6104 |
2.0541 |
Social Capital regressors |
|||
Control of Corruption Index |
114 |
0.1046 |
0.9650 |
Literacy |
116 |
81 |
20.073 |
Other regressors |
|||
Proportion of Rural Population |
116 |
0.4521 |
0.2269 |
Table 5: Regression Results
Independent variable |
Model 1 |
Model 2 |
Model 3 |
Model 4 |
Number of Observations |
115 |
99 |
99 |
105 |
Intercept |
0.018592*** |
-0.0087 |
-0.0179 |
-0.0073 |
Economic regressors |
||||
GDP |
-3.50e-06*** |
-2.85e-06** |
||
GDP2 |
9.04e-11*** |
5.58e-11** |
||
Forest exports |
0.0240 |
0.0355 |
0.0250 | |
Agricultural |
-0.0001 |
-0.0001** |
-0.0001* | |
Institutional regressors |
||||
OECD membership |
0.0254* |
0.0188* |
0.0153 | |
Freedom to exchange in capital and financial markets index |
0.0031*** |
0.0033*** |
0.0036*** | |
Legal structure and property rights index |
0.0008 |
0.0004 |
||
Freedom to access alternative currencies index |
-0.0014 |
-0.0014 |
-0.0015 | |
Size of government index |
0.0016 |
0.0022** |
||
Social Capital regressors |
||||
Control of corruption index |
-0.0076 |
-0.0123** |
-0.0118*** | |
Overall rate of literacy |
0.00004 |
-0.0001 |
-0.0001 | |
Other regressors |
||||
Proportion of rural population |
0.0119 |
0.0221 |
0.0325** | |
R2 |
0.2491 |
0.3707 |
0.3348 |
0.3091 |
| a Values in parenthesis are t-statistics based on White's corrected standard errors. *** significant at 1% level or better; ** significant at 5% level or better; * significant at 10% level or better. |
Figure 1: Forest Environmental Kuznets Curve, Actual vs Model 1
1 Department of Economics, University of Victoria, PO Box 1700 STN CSC, Victoria, BC, Canada V8W 2Y2. [email protected]