0895-B1
Yeda Maria Malheiros de Oliveira[1], Jeffery Burley, Terence Dawson and Mike Packer
Forest cover monitoring is a means of obtaining information over time. Its importance is increasing since attention has been focused on the seemingly inevitable reduction of the high biological diversity of tropical forests, as a result of their occupation by growing human populations. About 80 million people, more than 50% of the Brazilian population, lives in the Brazilian Atlantic Forest (BAF) area that, besides including most of the cities and metropolitan areas, involves also the great industrial, chemical, oil complexes and ports, representing 80% of the national GDP. This study centred on offering tools for monitoring trends over an area that involved a protected area and its surroundings, using several different approaches related to the Remote Sensing Image Differencing Methodology. The Irati National Forest (INF), located at BAF was selected to determine the magnitude of any changes in the forest types representing Araucaria Forest Region specifically, in the period from 1987 to 1997. Landsat TM 5 imagery was used in the process and a method was developed by which future changes in Araucaria Forest as a biome and Araucaria angustifolia as a species can be monitored.
It was found that: a) urban expansion in the area is a fact - after ten years Irati town concentrates 65% of its population in the urban areas and the rural population (35%) is made up of small farmers; b) as expected, very little change was found within the INF as a result of anthropogenic interference, in the ten-year period, although clear cuts within some introduced pine stands (of Pinus elliottii and P. taeda) were identified; c) there had been intense deforestation (not allowed by law) during the period over an area located close the INF covering approximately 3 000 ha; d) the different approaches were able to catch the alterations that had occurred in the ten-year period.
Brazil's Atlantic Forest (BAF) are some of the richest and most threatened bioma in the World. Home to 5 percent of the world's fauna and 7 percent of its flora, the Atlantic Forest, extends practically for the whole Brazilian coast and the interior in varied extensions. There have been many disagreements over the years as to exactly what can be considered part of the Atlantic Forest. However, Brazil's National Council of the Environment approved a definition in 1992 that includes not only coastal, araucaria, deciduous and semi-deciduous forests, but also associated ecosystems like oceanic islands, sandbanks, mangrove swamps, high altitude meadows and marshlands as Atlantic Forest. Today only about 7% (approximately 92,000 km²) of its original extent (approximately 1.2 million km²) still exists, and much of this acreage is not contiguous. About 80 million people, more than 50% of the Brazilian population, lives at the BAF area that, besides including most of the cities and metropolitan areas, involves also the great industrial, chemical, oil complexes and ports, representing 80% of the national GDP.
The increasing threats to forests in general stress the need for conducting repetitive forest inventories as a basis for long term management of sustained yield. However, multitemporal forest monitoring only by conventional methods is often impractical. In the scenario of changes in land use and declining forest cover caused by an expanding human population, archived remote sensing (RS) data (aerial photographs and satellite images) can contribute as an important tool for the monitoring of deforestation, providing essential tools to foresters.
This work based the detection of changes in forested areas on the RS image differencing method. The selected approach intended: a) to test the classification of the image differentiation product (TM band 5) in the process of categorising losses of vegetation; b). to test image differentiation over the fraction images derived using the Linear Mixing Model -LMM(Shimabukuro 1995; 1998). The aim was to develop and suggest an alternative methodology to detect changes in Araucaria forest. Every effort (including analysing differences in atmospheric conditions and illumination angle) was made in the pre-processing and processing phases to guarantee that the data sets were comparable.
Study area: Irati National Forest (INF) is located at Fernandes Pinheiro, State of Paraná, Brazil at approximately 25°21’S, 50°35’W. INF total area is 3,495.00 hectares and natural forest covers approximately 50 per cent of the area. Man made forests are represented by Pinus elliottii, Araucaria angustifolia and Pinus taeda.
Imagery: Two sets of Landsat 5 TM imagery (from 20/06/1987 and 18/08/1998), bands 1 to 5, and 7 were used. Images were rectified and georeferenced to the UTM projection and resampled using a bilinear interpolator. The study presented a calculated RMS of 0.852 pixels (approximately 25.56 m). In the geometric co-registration, image 1987 was used as the reference. The resultant RMS was smaller than one pixel (0.486 or 14.58 m approximately). In the radiometric corrections, Digital Numbers (DNs) were converted to reflectance (and multiplied by 255 to keep the same amplitude of DNs from raw images).
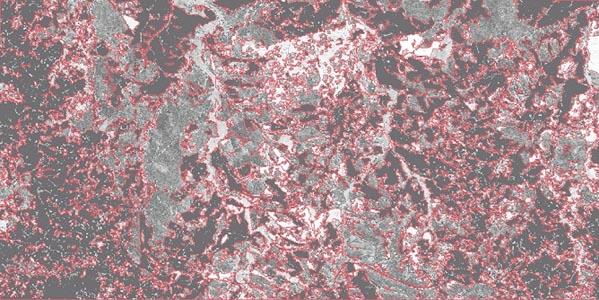
Simple image differencing - Overlay The basic version of image differencing involves the subtraction of one band of each date. TM band 5 that has been selected for this purpose in some Brazilian projects (Alves et al. 1998; Soares et al. 1996) was also considered the best choice and the Difference image (Dif.image5) was generated and is presented in Figure 1. In this paper, all the images have been subjected to a histogram equalisation contrast stretch for printing purposes.
Figure 1 Simple image differencing image from TM band 5 (Dif.image5).
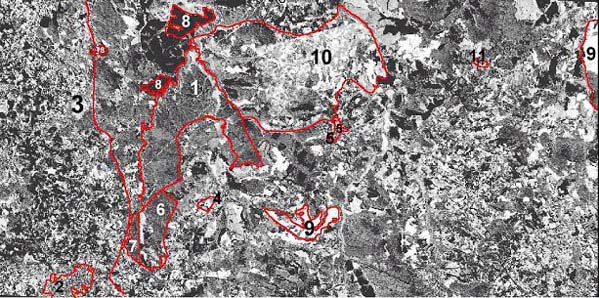
Dif.image5 was chosen to be a reference image and also was involved in the analysis of the additional techniques aiming: a) to test its overall capability of detecting major changes; b) to present a preliminary idea of the environmental complexity and a visual perception of the relationships between the protected area (INF) and adjacencies. The INF contour is almost auto-delineated by itself, showing how altered and fragmented the area is. To mark its area, a layer with its perimeter is shown in (1). In the lower left corner is the Irati town (2), the region main urban concentration. The left part of the window (3) is dominated by the Irati urban and semi-urban areas. Two other smaller towns are present (Fernandes Pinheiro (4) and Teixeira Soares (5) and other small villages (11). The area with Araucaria forest below the INF (6) belongs to the Agronomic Institute of Paraná (IAPAR), a State research institution. The area labelled with (7) belongs to a brickyard (Olaria Van Laars). The areas labelled as (8), (9) and (10) will be discussed later. The Dif.image5 shows some changes outside the National Forest. Within the INF, however, apparently no changes were detectable by the technique, in the period of 1987 to 1997.
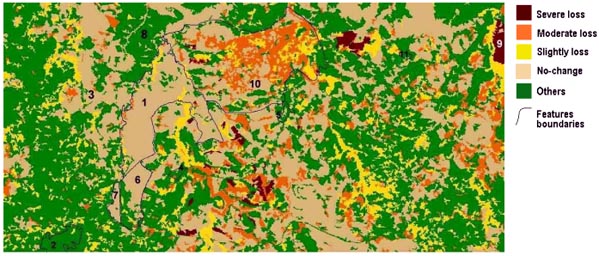
Image differencing classification: Change detection has been accomplished by comparison of two independent image classification results. A major problem with this approach is that the final results incorporate errors that may have been committed in the individual classifications. According to Häme et al. (1998), it is difficult to differentiate if, for example, change in the value of biomass is due to an actual change or to an error in the interpretation model. In the present work, Dif.image5 was used to test its detection sensitivity for different levels of vegetation loss. In the fieldwork, it was possible to define three levels of forest degradation, defined as ‘severe’, ‘intermediate (moderate)’ and ‘slight’ changes. Classification was based on the maximum likelihood decision rule (MAXVER). A pos-processing procedure with the objective of eliminating isolated points was performed. The results of the classification process (Dif.image5c) are shown in Figure 2.
When analysing the resultant image, it was noted that: a) inside the INF - in general there were no changes detected except for areas in process of regeneration - detectable mainly when close to internal earthen roads. A concentration of positive (reforestation) changes was found close to the number (1) in Figure 2. The area was a field trial (Acacia sp.) and because of its high mortality rate, it was abandoned as an experiment years ago. The area in 1998 presented aspects of second-growth forest; and b) outside the INF: clearcuttings of pine plantations (9) were captured as severe losses of biomass. In addition, some areas concentrated in the region labelled as (10) were also classified as ‘severe loss’. These areas were located following the streams and in the low valleys. Intermediate losses of biomass were detected in pine plantations that suffered severe thinning and in the area labelled as (10), around the areas classified as severe. Slight losses were distributed in the whole area.
Figure 2 Classified change image (SDif.image5s)
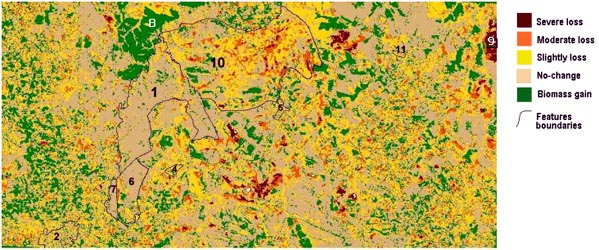
Gain of biomass was concentrated in the areas where agriculture was substituted for forestry (8). By the results, it was confirmed that TM band 5 and supervised classification are promising as tools to contribute to the monitoring of Araucaria forest. The differentiation between levels of degradation was achieved as a result of the training effort. The classification effectiveness involved the comparison of the categorised data to the reference set. When analysing the producer’s accuracy it was noted that practically no errors were found in mapping ‘biomass gain’. Some misclassification had occurred between the class ‘no-change’ and its immediate classes, ‘slight loss’ and ‘biomass gain’. The class severe loss presented very little confusion, except occasionally with the class ‘intermediate (moderate) loss’. As expected, however, ‘intermediate loss’ was the class that was less accurately classified. The user’s accuracy presented values superior to 84% for all classes. A global accuracy of 90.66% was found. Considering the difficulties in defining some of the classes, it can be considered adequate. The Kappa (or KHAT) coefficient of agreement was 87.80% and the TAU statistic was 88.32%. Analysing the final results, it was found that even when good results are obtained in discriminating the different levels of change in the study area, this traditional approach suffers from limitations related to the assumption that each accuracy site can be unambiguously assigned to only one class. The defined classes in the present work might be better analysed if considered as continuous instead of discrete classes. In reality, the categories are not easily defined as cover types identified by species like ‘pine’ or ‘eucalyptus’ should be. This reasoning leads to the possible solution by using mixing models or fuzzy logic.
Alternative process of change detection for monitoring purposes: No effort has been concentrated on developing methodology for monitoring the biome Araucaria forest and, consequently, no early information about successful projects can be incorporated into the new initiatives. There are advantages and disadvantages in using unsupervised classification, and they are related to the limited control of the analyst over the menu of classes and their specific identities. However, some of these limitations maybe can be softened by the concomitant use of other techniques, as image segmentation. In the present study, the tested method was based on Shimabukuro et al. (1998) using Linear Mixing Model (shade fraction image) that has been suggested as very promising in densely vegetated areas. The main reason for using shade image in deforestation assessment is that it is has been found to be well correlated with vegetation canopy structure. Shimabukuro et al. (1998) working in the Amazon Region also mentioned limitations of conventional digital analysis of TM data based on pixel-by-pixel classification because it takes into account only the spectral variation of the scene and misses the contextual information of the objects, which is potentially important. Eastman (1997) mentioned that, although some procedures are able to incorporate information about image characteristics as texture and context, the majority of image classification is based solely on the spectral signature detection of land cover classes. The new approaches involving image segmentation and fraction images obtained by mixing models tend to improve the deforestation estimation.
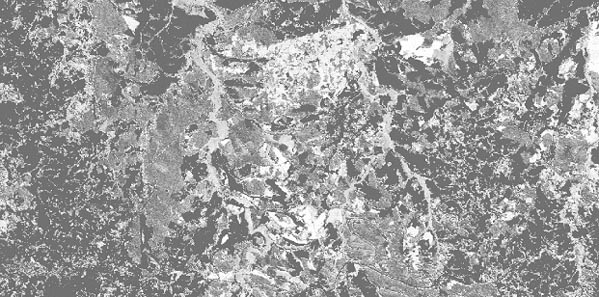
Step 1 - Preparing the differencing image: The shade image of 1987 was subtracted from the shade image of 1997 (Figure 3)
Figure 3 Image differencing of the shade images (Dif.image-sh).
Step 2 - Segmenting the differencing image: Figure 4 shows Dif.image-sh and the labelled image obtained by the selected segmenting thresholds (lines in red).
Figure 4 Segmentation of the Dif.image-sh
Step 3 - Classifying the segmented image:.. The unsupervised classification was performed using the per-field clustering classifier - ISOSEG algorithm (Figure 5)
Figure 5 SDif.image-sh-u (classification of the segmented image Dif.image-sh)
The analysis of the Figure 5 shows that: a) inside the INF - the only detectable positive changes were verified in the areas of former Acacia spp. stands. Some ‘slight biomass loss’ was also detected in the riparian areas which might be a consequence of the flooding process that normally occurs in the area; b) outside the INF: no changes were detected in the areas labelled as (6) or (7). Wood exploitation is regulated by law (management plans); however, exploitations against the law as identified in the area labelled as (10) are possible. The mentioned area was almost totally classified as ‘moderate biomass’ loss and some few small patches were included in the ‘severe loss’ class. In the period of 10 years, the region, which is equivalent in area to the INF (approximately 3,000 ha), was deeply altered. The class ‘severe biomass loss’ was only identified when a highly dense area were clearcut (commercial forest). Only a few natural areas were included in this same class. The classifier incorporated agriculture, pasture and urban areas as ‘biomass gain’, in the same class as reforestation (young pine, mainly). The fact maybe can be partially explained by the characteristics of shade image. According to Adams et al. (1995) deforested or sparsely forested areas present low shade contents. Actually, the class should not be called biomass gain but "others". Therefore, gain in biomass was not well modelled; the shade image did not provide information enough to the discrimination between forestation (and/or reforestation) and other cover types present in the study area. It is a typical tool to analyse deforestation classes. The image, therefore was composed by the three levels of deforestation, the class ‘no-change and the class ‘others’, where others features were included. A supervised classification was also performed. However, no improvements were found and the categories ‘moderate’ and ‘slight’ loss presented more difficulties in their discrimination.
Agreement analysis: Analysing Table 1, for the first group: (SDif.image-sh-u x SDif.image5-s) the agreement percentage between the unsupervised approach using the shade image and the supervised approach using band 5 were compared. The overall agreement occurred in less than 50% of the pixels. Even when it can be considered a good agreement, it does not means that the same pixels were considered in both cases. In this group, the highest disagreement occurred in the class gain of biomass. This might be explained by the fact that in the shade image features other than deforestation were included in this class. In TM band 5, however, they were sometimes considered biomass loss, sometimes biomass gain, according to the dynamics of the region urban and rural areas. The second group was composed by the two approaches (supervised and unsupervised) over the shade image.
Table 1 Agreement among the three image differencing classification approaches
|
(1) Sdif.image-sh-u x Sdif.image5-s Overall agreement: 48.28% |
||
|
|
SDif.image-sh-u (%) |
SDif.image5-s (%) |
|
Severe loss |
43.52 |
46.63 |
|
Moderate loss |
33.90 |
29.99 |
|
Slight loss |
15.43 |
39.73 |
|
No-change |
57.08 |
74.34 |
|
Gain of biomass |
87.59 |
34.96 |
|
(2) Sdif.image-sh-u x Sdif.image-sh-s Overall agreement: 75.36% |
||
|
|
SDif.image-sh-u (%) |
SDif.image-sh-s (%) |
|
Severe loss |
78.19 |
50.26 |
|
Moderate loss |
90.96 |
90.96 |
|
Slight loss |
24.35 |
24.43 |
|
No-change |
70.82 |
90.49 |
|
Gain of biomass |
92.42 |
93.62 |
|
(3) Sdif.image5s x Sdif.image-sh-s Overall agreement: 49.04% |
||
|
|
SDif.image5-s (%) |
SDif.image-sh-s (%) |
|
Severe loss |
37.98 |
38.51 |
|
Moderate loss |
27.82 |
33.85 |
|
Slight loss |
42.86 |
16.27 |
|
No-change |
77.64 |
59.70 |
|
Gain of biomass |
34.35 |
84.60 |
The class slight loss presented similar percentages in both cases, and the class gain of biomass as well. This class (biomass gain) reflected the high level of misclassification occurred when the shade image was used independent of the classifier used. The third group compared both supervised approaches, but over different background images (SDif.image5s x Sdif.image-sh-s). Here the main difference was the already mentioned discrepancies found when shade image and band 5 were involved.
Considering the potential size of the area in Southern Brazil, a monitoring system to detect changes in Araucaria forest, has to be: a) repeatable on whatever time interval is appropriate; b) simple to carry out and not time-consuming; and c) effective in detecting changes. It was concluded that the use of shade differencing image, image segmentation and a per-field unsupervised classification resulted in an alternative methodology for detecting deforestation in Araucaria forest. It should be a good option for situations as rapid assessments as well when powerful computational resources are not available, important aspects in the monitoring of this large and complex area. The methodology must be tested in other areas of the same biome and minor alterations might be necessary. Further research in the same direction is strongly recommended.
Adams, J.B., Sabol, D.E., Kapos, V., Almeida F.,R., Roberts, D.A., Smith, M.O., and Gillespie, A.R., 1995, Classification of multispectral images based on fractions of endmembers: application to land-cover change in the Brazilian Amazon. Remote Sensing of Environment, 52:137-154.
Alves, D.S., Pereira, J.L.G., Sousa, C.L., Soares, J.V., Moreira, J.C., Ortiz, J.O., Shimabukuro, Y.E., and Yamaguchi, F., 1998, Análise comparativa de técnicas de classificação de imagens do sensor Landsat/TM para caracterização de áreas desflorestadas. In: Proceedings of IX Simpósio Brasileiro de Sensoriamento Remoto. Santos, Brazil, 11-18 Sep.1998 - CD-Rom.
Eastman, J.R., 1997, Idrisi for Windows - User’s Guide Version 2.0. Clark Labs for Cartographic Technology and Geographic Analysis, Clark University, Worcester, MA.
Häme, T., and Heiler, I., 1998, An unsupervised change detection and recognition system for forestry. International Journal of Remote Sensing, 19(6):1079-1099.
Shimabukuro, YE., and Smith, J.A., 1995, Fraction images derived from Landsat TM and MSS data for monitoring reforested areas. Canadian Journal of Remote Sensing, 21(1):67-74.
Shimabukuro, Y.E., Batista, G.T., Mello, E.M.K., Moreira, J.C., and Duarte, V., 1998, Using shade fraction image segmentation to evaluate deforestation in Landsat Thematic Mapper images of the Amazon Region. International Journal of Remote Sensing, 19(3):535-541.
Soares, V.P., Hoffer, R.M., Brites, R.S., and Ribeiro, C.A.A.S.,1996, Monitoramento de Plantações de Eucalyptus spp no Vale do Rio Doce através de imagens TM/Landsat 5. In: Proceedings of VIII Simpósio Brasileiro de Sensoriamento Remoto. Salvador, Brazil, April 14-19 1996 - CD-Rom.
| [1] Researcher, EMBRAPA (Brazilian
Agricultural Research Corporation), Forest National Centre, PO BOX 319,
80400-000 - Colombo, Paraná, Brazil. Email: [email protected] |