

0933-B4
Sun Xiangyang, Wang Haiyan, Tan Xiao 1
Coarse woody debris (CWD) in a mixed plantation of Pinus tabulaeformis and Platycladus orientalis in Xishan area, Beijing, China were systematically studied based on investigations and random samplings. Results show that the density of CWD ranged from 0.231 to 0.737 g cm-3 and decreased with increasing decay classes. The biomass of CWD was 1.152 t hm-2 and was distributed in the order of decay class II (47.22 %) > class I (27.20 %) > class III (11.44 %) > class V (7.67 %) > class IV (6.47 %). The decomposition rate of Pinus tabulaeformis, Platycladus orientalis and broad-leaved trees was 0.0446, 0.0325 and 0.0408 year-1, respectively. The nutrient concentrations of CWD decreased with increasing decay classes, with carbon as the major element (46.37- 53.97 %) and other elements in the range of 0.014 to 1.749 %. The decomposing of CWD increased soil pH and the nutrient contents and thus increased soil fertility.
Large pieces of standing or fallen dead wood, termed coarse woody debris (CWD), play important ecological roles in forest systems. CWD include snags with a diameter larger than 2.5 cm, down boles, large branches and roots.
The biomass, rates of production, and ecological roles of CWD have been extensively studied, with considerable information amassed concerning CWD amounts and dynamics in various forest ecosystems (USA, Canada, Chile, Australia, Russia, Finland, Sweden, Norway). In China, studies on CWD have been carried out in subtropical, temperate, and cold temperate natural forests. However, there is a lack of quantitative information on the abundance and biomass of CWD in the mixed plantation of North China subjected to warm temperate zone.
The aim of this study was to add further information to CWD storage, decomposition, and its ecological functions in the warm temperate zone by studying CWD wood density, biomass, decomposition rate, nutrient pools and its effects on soil ecology. Comparison was also made with CWD in other forest stands under different climate conditions, so as to provide a scientific basis for reasonable forest management.
This study was conducted at Beijing Xishan Experiment Forest Farm located on the west of Beijing, China (E116º28′, N39º34′). This region is an offshoot of the Taihang Mountain range. It has a warm temperate continent monsoon semi-humid climate with an annual average temperature of 11.6 ℃, an annual average precipitation of 630 mm, and an average wind speed of 4.1 m/s in Spring.
Artificial forests established between the 1950s and 1960s are distributed at the elevation of 90-400 m a.s.l., with main tree species of Platycladus orientalis, Pinus tabulaeformis, Quercus variabilis Bl., Robinia pseudoacacia, and Fraxinus bungeana in closed-canopy. The seedlings under canopy are in good regeneration, with the height of Platycladus orientalis, Pinus tabulaeformis, Quercus variabilis Bl., Fraxinus bungeana, Ailanthus altissma, Broussonetia papyrifera, Morus mongolica higher than 6 m. The vegetation in the forest floor has Vitex negundo var. heterphylla, Arthraxon hispidus (Thunb.) Makino, Cyperaceae heterostachya Bge., Spiraea sp., Grewia biloba G. Don, Lespedeza bicolor Tercz., with the total coverage of about 35 %.
Soil is classified as drab soil, with pH value in a range of 7.0-8.2, organic matter content of 30-60 g kg-1, and cation exchange capacity (CEC) of 15-22 cmol(+) kg-1.
Four sample plots of 20 m * 20 m were established in the mixed plantation of Pinus tabulaeformis- Platycladus orientalis in the study area. Investigations were made by diving CWD into down boles (including branches and tops) and snags (including stumps) with detailed records.
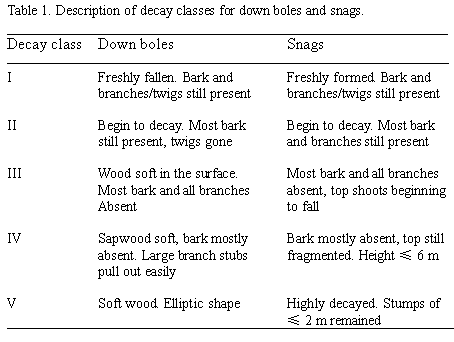
We used five classes to describe the stage of decomposition (Table 1). CWD samples were grouped by CWD types and decay classes. Soil samples were also collected from the sites 5-10 cm away from CWD in the highest decay class for nutrient analyses.
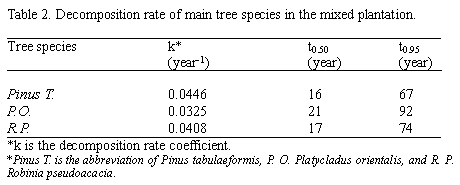
To simulate the decomposition process of CWD during each time-step, decomposition models were used. The most common one was the single negative exponential model (nonlinear least-squares regression) expressed as Yt = Y0 * e-kt (Tinker and Knight, 2001), where Y0 is the initial mass of CWD sample, Yt is the remaining mass at time t, and k is the decomposition rate coefficient. Generally, t0.50 and t0.95 denote the time interval when CWD reach half decomposition and 95 % decomposition respectively. In our study, after weighing, CWD samples were carefully wrapped in the plastic string bags and returned to the sampling sites for natural decomposition. After a certain time interval, CWD samples were weighed again. The weight difference was approximately that decomposed during the time interval. Replacing Yt and Y0, we can get k, and then t0.50 (=0.693/k) and t0.95 (=3/k).
For density measurement, volumes were determined by the water immersion method. Weights were then determined after drying in a forced-air oven at 80-90°C for 24 hrs until reaching constant weight. The density was calculated as a ratio of weight to volume.
CWD samples were cut with a band saw or hand clippers and ground to pass a 1-mm sieve and further a 0.25-mm sieve for the determination of total N, P, K and C. The results of density and chemical analysis are based on the whole sample set.
Soil samples were air-dried and ground to pass a 1-mm sieve and further a 0.25-mm sieve for the determination of total soil N, readily available P and K, and organic matter content. Soil pH was measured in a suspension of soil and water at a 1:2.5 (v/v) ratio.
To estimate the volume of CWD, a cylindrical or half-cylindrical shape was assumed for each piece depending on its degree of decomposition and position with respect to the ground level.
Volume of decapitated down boles can be calculated with Smalian's volume formula: V = π/4 * (d02 + dn2)/2 * l, where V is volume in cubic meters, d0 and dn the diameter at both ends (small-end and large-end) in meters, and l the length in meters. Volume of down boles with complete tree form can be calculated with Huber's formula: V = π/4 * d2 * l, where d is the midpoint diameter in meters and l the length in meters. Volume of snags can be calculated in three ways: 1) V = g1.3 * (h + 3) * f, where g1.3 is the basal area of DBH in meters, h the height in meters and f the experimental shape/form coefficient; 2) Huber's volume formula; and 3) Cone volume formula: V =π* r2 * (h/3), where V is the cone volume, h the height of cone and r the radius of the base.
Biomass estimate was obtained by multiplying the volume of each piece with the wood density for the respective decay class. Biomass was summed within each decay class on the sample plot.
Decomposition rates of main tree species in the mixed plantation in Xishan area are shown in Table 2. Generally, broad-leaved tree species decompose a little faster than coniferous tree species. However, in our study, we found the decomposition rate in the order of Pinus tabulaeformis > Robinia pseudoacacia > Platycladus orientalis. This may due to different wood density of tree species, which was in the reverse order (Table 3). It may indicate that CWD decomposition rate was closely interrelated with wood density of tree species.
In addition, CWD decomposed faster in the early stage, with main possible reasons as follows: 1) fresh CWD was prone to pest diseases; 2) fresh CWD had higher organic matter content which led to stronger respiration; and 3) fresh CWD was over the forestland surface in the position and higher temperature could speed up decomposition process. When CWD decomposed to a certain degree, it was gradually approaching the soil surface and decomposition slowed down due to the decreasing temperature and increasing moisture.
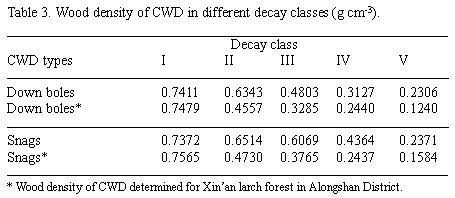
CWD in different decay classes differed quantitatively in wood density (see Table 3). The changes in wood density generally follow those observed previously: with increasing decay class (from decay class I to class V), wood density declines considerably. Wood density of down boles and snags were a little higher than those determined for Xin'an larch forest in North Daxin'anlin (Alongshan District) except for CWD in decay class I. This may be due to shorter forest age of the mixed plantation in Xishan area, and thus CWD was produced and decomposed during shorter period, and also due to dry weather and little precipitation there. Whereas the forests in Alongshan District are old-growth virgin natural forests, CWD was decomposed relatively faster with longer decomposition period, suitable moisture in the forest stand, and active microorganism under canopy.
Wood density of snags was slightly higher than that of down boles, both in Xishan area and in Alongshan District. This was mainly because snags were farther away from soil surface, lower temperature and moisture and fewer microorganisms involved in CWD decomposition made CWD decompose more slowly than down boles, which, however, was decomposed in a relatively favorable condition. Thus, we may conclude that snags decompose more slowly than down boles, and accordingly, have higher wood density than down boles.
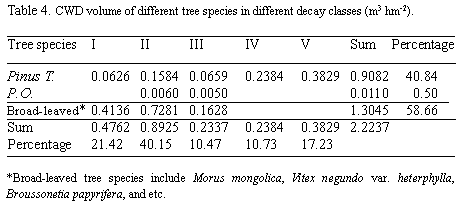
CWD volumes of different tree species in different decay classes are shown in Table 4. According to decay classes, CWD volume was distributed in the order of decay class II > class I > class V > class IV > class III. According to tree species, CWD volume was distributed in the order of broad-leaved trees > Pinus tabulaeformis > Platycladus orientalis. Generally, within the same forest stand, CWD volume of coniferous trees is larger than that of broad-leaved trees. However, we found the opposite result in our study. This was mainly because of short forest age of the mixed plantation in Xishan area, and thus less CWD was produced naturally and CWD was mostly formed after thinning operations. CWD from broad-leaved tree species was mainly snags and down boles with large DBH and height, and thus large volume.
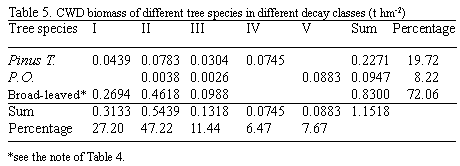
CWD biomass was 1.152 t hm-2 in the mixed plantation of Pinus tabulaeformis and Platycladus orientalis in Xishan area (Table 5). According to decay classes, CWD biomass was distributed in the order of decay class II (47.22 %) > class I (27.20 %) > class III (11.44 %) > class V (7.67 %) > class IV (6.47 %). According to tree species, CWD biomass was distributed in the order of broad-leaved trees > Pinus tabulaeformis > Platycladus orientalis, which followed similar pattern to CWD volume with same explanations.
Global studies on CWD storage in various forest ecosystems found the highest CWD storage in temperate coniferous forests ranging 30-200 t hm-2, and the lowest in broad-leaved forests ranging 8-50 t hm-2 (Harmon, 1986). In China, CWD storage was 7.9-16.2 t hm-2 in forests in Changbai Mountains, 11.63 t hm-2 in Daxin'anling, and 98.46 t hm-2 in evergreen broad-leaved forests in Ailao Mountains in Southwest China. The mixed plantation of Pinus tabulaeformis- Platycladus orientalis in Xishan area belongs to warm temperate coniferous forest. However, CWD storage was rather low. This can be explained in part by the practice of clearing away undetermined amount CWD from the plantation because of the emphasis given on CWD harmfulness for a long time, but also by the increased CWD decomposition under favorable environmental condition including high temperature and much precipitation. In addition, not much CWD was produced from the plantation with 50 years of forest age when trees had strong adaptability and resistance. Lower CWD storage within the mixed plantation suggests that further expansion of forest use may reduce regional storage of CWD.
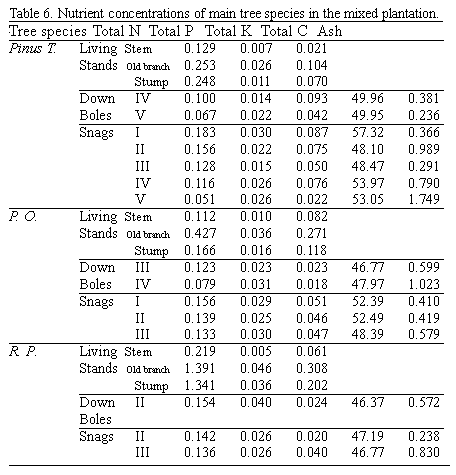
CWD acts as one of the forest's main stores of nutrients that are released slowly over time through decomposition. Total C, N, P and K in both living trees and CWD of different tree species in different decay classes are shown in Table 6. The unadjusted mass-based nutrient concentrations (mass of nutrient per mass of CWD at the current decay class) generally decreased with increasing decay classes for total N, P and K, ranging 0.051-0.183 %, 0.014-0.040 % and 0.018-0.093 %, respectively, depending upon tree species and decay stage. This may indicate that N, P, and K were lost at a greater rate than bulk CWD mass, which is however not in total agreement with other studies using the same decay class system (Preston et al., 1998; Holub et al., 2001). Total C ranged 46.37-53.97 % and was very close at any stages. No much difference between nutrient concentrations in CWD and those in the living trees indicated that nutrients are released very slowly over time. We also found slightly higher nutrient concentrations in snags than in down boles. This again explained that snags decompose more slowly than down boles.
Nutrient concentrations of soil samples from the sites 5-10 cm away from CWD of Pinus tabulaeformis and Platycladus orientalis in the highest decay class are shown in Table 7. With CWD decomposition, soil pH decreased slightly, and organic matter content, soil total N, readily available P and K increased rapidly compared with control. This may be due to the presence of humic acids formed in CWD decomposition, which resulted in lower soil pH and thus more readily available P and K. CWD can also fix N during its decomposition. Therefore, CWD was considered as soil nutrient source. It can not only keep soil fertility, but improve soil structure as well, by returning nutrients present in CWD to soil, and also increase site productivity by increasing soil biodiversity.
1) The density of CWD ranged from 0.231 to 0.737 g cm-3 and decreased with increasing decay classes.
2) The biomass of CWD was 1.152 t hm-2 and was distributed in the order of decay class II > class I > class III > class V > class IV.
3) The decomposition rate of Pinus tabulaeformis, Platycladus orientalis and broad-leaved trees was 0.0446, 0.0325 and 0.0408 year-1, respectively.
4) The nutrient concentrations of CWD decreased with increasing decay classes.
5) With CWD decomposition, soil pH decreased and soil nutrient concentrations increased, and thus increasing soil fertility.
Table 1. Description of decay classes for down boles and snags.

1 College of Soil and Water Conservation, Beijng Forestry University, P.O. Box 111, Beijing, P. R. China