0990-B1
M.P. de Silva[1], W.P. Sapumohotti and R. Karunatileke
This study covered three sites in the southeastern dry zone in the Hambantota district of the Southern Province of the island of Sri Lanka. In the dry zones, intensive felling and a form of shifting cultivation locally called chena cultivation has badly degraded the forests. Chena cultivation occupies a large area, predominantly in the once-forested parts of the dry zone. During fallow periods, secondary successions lead to the development of scrub or low jungle. These forests remain largely unutilized. At present, shifting cultivation covers about 1.2 million ha or about 18 percent of the country’s total land area. Poverty is prevalent among the rural folk of the district and hence animal husbandry using natural vegetation in the scrub forests of the dry zone is proposed as an additional source of income for the inhabitants.
Animal husbandry is poorly developed in the country though sufficient resources are available for its development. Goat rearing has been identified as a viable option for farmers in the Hambantota district of Sri Lanka. The district is characterized by hot dry weather and by flat terrain and fertile soils. The natural vegetation is of tropical dry mixed evergreen type with small trees and shrubs predominating. A preliminary survey was carried out to study the sustainable use of this natural vegetation as primary fodder during goat rearing. Data were collected at three sites to identify the available vegetation and categorize them to varying fodder classes, ranging from best fodder plants to non-fodder plants. The Importance Value Index (IVI) was used to make a comparative assessment of the availability of fodder plants quantitatively during the year at the three sites. The study on biomass production among the best fodder plants identified the most suitable plants at the sites with reference to their rates of growth and regeneration. Using this data as baseline information, the carrying capacity of each site for goat rearing using natural vegetation was estimated.
Sri Lanka is an island in the Indian Ocean located between 5055 and 9051 N and 79041 and 81051 with a land area of 65,000 km2. As a result of its diverse terrain and climatic variations, 15 floristic regions have been identified (Ashton and Gunatileke, 1987). The present study was carried out in the Hambantota district in the Southeastern region of the dry zone of Sri Lanka which is characterized by tropical dry evergreen mixed forests and tropical thorn forests. Animal husbandry is poorly developed in the district although suitable land is available (Gunasena, 1990). Goat rearing has been identified as a viable option for farmers in this district to increase their household income and thereby to overcome the prevalent poverty. However the cost of fodder and long term environmental damage on the vegetation through goat browsing are important limitations. This study focused on the feasibility of a goat rearing system using natural vegetation as fodder if goat rearing is developed as an important optional occupation for the farmers.
The three sites are located in the Hambantota district within the villages of Wediwewa (named as site A), Gonnoruwa (named as site B) and Kawantissapura (named as site C). The district occupies the Southeastern region of the dry zone of the island and has an area of 2623 km2. The area is characterized by tropical dry mixed evergreen forests and tropical thorn forests. With reference to relief, the region shows great uniformity and is almost entirely made up of undulating plains except for some isolated hills on its western, northwestern and northeastern margins. As a result of the low rainfall and flat terrain, there is less wash off and the soils are generally fertile (Moorman and Panabokke, 1961). The region is characterized by hot dry weather and rainfall is restricted almost to a single period. Maximum rainfall is experienced during the Northeast monsoon which extends from October to January while the period from July to September is dry. The mean annual rainfall is around 1279 to 2540 mm. However, average rainfall varies in the district within a large range. For example, the southeastern coastal belt experiences a mean annual rainfall of only 889 - 1270 mm. The average daily temperature is around 26.60 C to 27.20 C while the average relative humidity in the region varies from 76 % to 81 %.
The vegetation analysis was carried out using transects of 24 m. x 4 m. Three transects were laid per site. Six quadrates each of 4 m x 4 m. were demarcated along each transect (Cocran, 1977, Magurran, 1988). The following parameters were included in the analysis.
(a) the identification of the prominent plant species which was done using herbarium specimens and taxonomic keys. The plants were classified into their respective families and habit.(b) stem circumference and height,(c) relative density,(d) basal area (dominance) and relative dominance,(e) frequency and relative frequency, (f) the importance value index (IVI). (Hawksworth, 1995).(g) the fodder classes of the identified species categorized into fodder classes as follows:
Class 1 unknown as fodder,
Class 2 non-fodder
Class 3 fairly good fodder
Class 4 good fodder
Class 5 very good fodder.
The categorization was based on the data gathered on feeding habits of the goats collected from goat farmers in the district, and through field observations on browsing habits of goats. Good digestive ability, fast growth rate, good milk production and attraction as fodder were some criteria used in the categorization. (h).biomass production for which only species categorized under very good and good fodder plants were used. Twigs located above 10 cm from ground level were cut and thereafter the new leaves that appear at one month intervals were harvested and their fresh and dry weights were determined during rainy periods (around 130 days per year) and dry periods (235 days per year) in two consecutive years. Results were expressed as growth in mg/day.(i)nutritional value of the species used in the biomass assessment in this analysis. The parameters measured were percentage of crude protein, dry matter and ash in each of these species. Leaves and petioles which were oven burnt were used and results were expressed as % of oven burnt mass.
A total of 48 plant species were found to be prominent at the 3 sites.
The identified plant species are listed in the table 1. The habit and the fodder class are also indicated.
Table 1: List of plants.
|
Species No. |
Species Name (Family) |
Plant Form |
Fodder class |
|
1. |
Euphorbia nerifolia(Euphorbiaceae |
S |
2 |
|
2. |
Capparis heynema(Capparidaceae) |
ST |
2 |
|
3. |
Atalantia ceylanica(Rutaceae) |
ST |
4 |
|
4. |
Mayterus emerginata(Leguminosae) |
ST |
5 |
|
5. |
Cassipourea ceylanica(Rhizophoraceae |
ST |
3 |
|
6. |
Carmona microphylla(Boraginaceae) |
ST |
4 |
|
7. |
Phyllanthus pinnatus(Euphorbiaceae) |
S |
1 |
|
8. |
Grewia corpinifolia(Tiliaceae) |
V |
5 |
|
9. |
Carissa spinarum(Apocynaceae) |
S |
5 |
|
10. |
Calamus radiatus(Palmae) |
V |
5 |
|
11. |
Randia dumetorum(Rubiaceae) |
ST |
5 |
|
12. |
Zizyphus oenoplia(Rhamnaceae |
S |
5 |
|
13. |
* Dichrostachys cinerea (Leguminosae) |
ST |
4 |
|
14. |
Capparis sepiaria(Capparidaceae) |
S |
5 |
|
15. |
Bauhiniya racemosa(Leguminosae) |
ST |
5 |
|
16. |
Cassia auriculata(Leguminosae) |
ST |
2 |
|
17. |
Salvadora persica(Salvadoraceae) |
S |
4 |
|
18. |
Flugia leucopyrus(Leguminosae) |
ST |
5 |
|
19. |
Lantana camara var.aculeata(Verbenaceae |
S |
4 |
|
20. |
Phyllanthus polyphyllus(Euphorbiaceae) |
S |
4 |
|
21. |
Ixora arborea(Rubiaceae) |
S |
4 |
|
22. |
Manilkara hexandra(Sapotaceae) |
T |
4 |
|
23. |
Premna latifolia(Verbenaceae) |
ST |
5 |
|
24. |
Wrightia antidysenterica(Apocynaceae) |
ST |
2 |
|
25. |
Scutia myrtina(Rhamnaceae) |
V |
2 |
|
26. |
Glycosmis mauritiana(Rutaceae) |
S |
1 |
|
27. |
Drypetes sepiaria(Euphorbiaceae) |
T |
4 |
|
28. |
Bauhinia tomentosa(Leguminosae) |
ST |
1 |
|
29. |
.Cordia monoica(Boraginaceae) |
T |
4 |
|
30. |
Feronia limonia(Rutaceae) |
T |
5 |
|
31. |
Canthium coromandelicum(Rubiaceae) |
V |
5 |
|
32. |
Erythrina fusca(Legumonosae) |
ST |
4 |
|
33. |
Cordia gharaf(Boraginaceae) |
T |
4 |
|
34. |
Tarenna asiatica(Rubiaceae) |
ST |
3 |
|
35. |
Diospyros ferrea(Ebenaceae) |
T |
4 |
|
36. |
Catunnaregan spinosa(Apocynaceae) |
ST |
4 |
|
37. |
Abutilon indicum(Malvaceae) |
H |
3 |
|
38. |
Sida alba(Malvaceae) |
H |
1 |
|
39. |
Canthium sp.(Rubiaceae) |
S |
4 |
|
40. |
Ochna squarrosa(Ochnaceae) |
ST |
1 |
|
41. |
Euphorbia antiquorum(Euphorbiacea) |
ST |
1 |
|
42. |
Cissus quadrangularis(Vitaceae) |
V |
1 |
|
43. |
Acacia eburnea(Leguminosae) |
ST |
5 |
|
44. |
Asparagus racemosa(Liliaceae) |
V |
2 |
|
45. |
Croton laccifer(Euphorbiaceae) |
S |
2 |
|
46. |
Hibiscus abelmoschus(Malvaceae) |
S |
1 |
|
47. |
Grewia damine(Tiliaceae) |
ST |
1 |
|
48. |
Gymnema sylvestre(Asclepiadaceae) |
ST |
5 |
H herb S shrub ST small tree(> 3m.) T tree (<3m) V vine
1 unknown as fodder 2 non fodder 3 fairly good fodder
4 good fodder 5 very good fodder * only pods are used as fodder. The best fodder plants are in bold print.
Among the 48 species identified at the 3 sites, 14 belonged to the very good fodder class, while 15 were good fodder plants. 3 were fairly good fodder plants and 7 were non fodder plants. The fodder status of 9 plants was unknown. The results showed that over 60 % of the vegetation consisted of good goat fodder.
The distribution pattern of the fodder classes among the 3 sites is indicated in the table 2.
Table 2: Distribution pattern of fodder classes among the 3 sites
|
Fodder Class |
A |
B |
C |
|||
|
Total |
% |
Total |
% |
Total |
% |
|
|
1 |
2 |
5.5 |
3 |
7.3 |
0 |
0 |
|
2 |
10 |
27.7 |
5 |
12.2 |
7 |
36.8 |
|
3 |
6 |
16.6 |
7 |
17.0 |
5 |
26.3 |
|
4 |
7 |
15.4 |
14 |
31.1 |
3 |
15.8 |
|
5 |
11 |
30.5 |
12 |
29.2 |
4 |
21.1 |
| |
36 |
|
41 |
|
19 |
|
The IVI values were used to compare the three study sites. Values above 10 indicate the significance of a species within a population. The species numbers (as given in table 1) of significant plants are indicated below. The IVI values obtained for each species are given within parentheses for each species. At site A, 18 species had IVI values ranging from 10 to 230. Among them, the important fodder plant species were 14 (24), 6 (13), 11 (112), 12 (38), 18 (112), 20 (123), 23 (235), 36 (37),and 43 (62). For site B, 16 species had significant IVI values out of which 10 were fodder plants. The most significant were the species 4 (85), 6 (11), 8 (13), 9 (50), 10 (13), 12 (28), 2 (14), 18 (48), 19 (13), and 23 (30). The IVI values for site C varied from 10 to 100 for 15 plant species among which the fodder plant species were the species 4 (43), 8 (14), 11 (40), 18 (35), 19 (37) and 31 (18).
Through the transect study, the number of fodder plants present at each site was estimated. The area of one transect was 96 m2. Using the mean number of individuals of each species present within the three transects per site, the area of cover was extrapolated to one hectare and the number of fodder plants per hectare was calculated. These results are summarized in table 3.
Table 3: Number of fodder plants per hectare at the three sites
|
Fodder Class |
A |
B |
C |
|
5 |
3382 |
2808 |
3178 |
|
4 |
1595 |
2608 |
573 |
|
Total |
4977 |
5416 |
3751 |
According to the results, a total of 4977, 5416 and 3751 plants which can be utilized as fodder plants are available in a land area of one hectare at the site A, B, and C respectively.
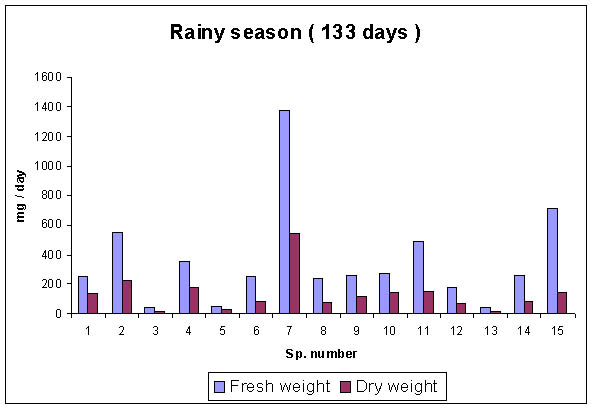
The amount of bio-mass produced by 15 fodder species during the rainy season and the dry season in two consecutive years was expressed as mean growth in mg/day. The species showed a fresh weight increase ranging from 100 mg/day to 1300 mg/day during the rainy season and from 25 mg/day to 200 mg/day during the dry season. The species Mayterus emerginaata, Carissa spinarum, Acacia eburnea, Flugia leucopyrus, Catunnaregan spinosa showed the highest biomass increase during the rainy season (Fig.1) while species Mayterus emerginata, Carissa spinarum, Zizyphus oenoplia, and Flugia leucopyrus showed significant growth during the dry period (Fig. 2).
Fig.:1 Fresh weight changes in mg/day during the rainy season
Species such as Mayterus emerginata, Carissa spinarum and Flugia leucopyrus have
Fig. 2. Fresh weight changes in mg/day during the dry season
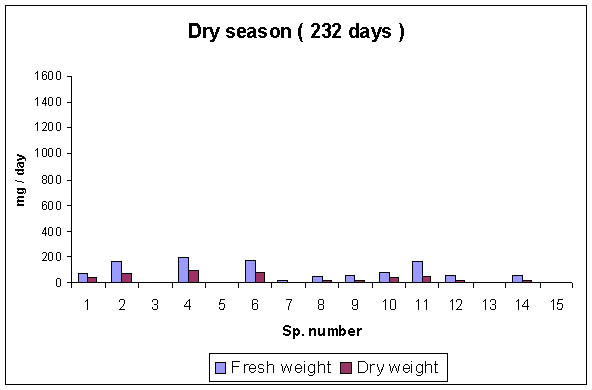
Plant species in figures 1 and 2: 1.Atalantia ceylanica 2Mayterus emerginaata 3.Grewia corponifolia 4.Carissa spinarum 5.Randia dumetorum 6.Zizyphus oenoplia 7.Acacia eburnea 8. Gymnema sylvestre 9.Capparis sepiaria 10.Bauhinia racemosa 11. Flugia leucopyrus 12.Ixora arborea 13.Premna latifolia 14.Erythrina fusca 15 Catunnaregan spinosa
The results on the nutritional value with reference to crude protein, dry matter and ash content showed that fodder species had crude protein contents ranging from 9% to 25%, dry matter contents from 22% to 48 % and ash contents from 5% to 20% (Fig. 3).
Fig. 3 Crude protein, dry matter and ash content in fodder plants
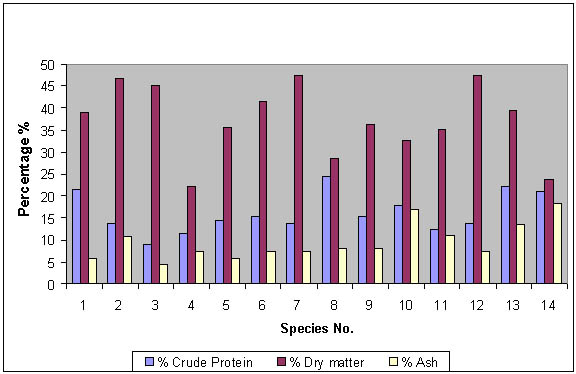
Plant species in the figure 3..1.Atalantia ceylanica 2Mayterus emerginaata 3.Grewia corponifolia 4.Carissa spinarum 5.Randia dumetorum 6.Zizyphus oenoplia 7.Acacia eburnea 8. Gymnema sylvestre 9.Capparis sepiaria 10.Bauhinia racemosa 11. Flugia leucopyrus 12.Ixora arborea 13.Premna latifolia 14.Erythrina fusca
The three sites in this study are all located within the Hambantota district of Sri Lanka which is characterized by significant diurnal variations in the maximum and minimum temperatures, low rainfall, and rainfall mainly confined to a single period of 2-3 months in the year, dry winds and low humidity (Land and Water Use Division, 1976). These climatic factors along with the soil properties and physical features such as flat terrain etc are the main edaphically responsible factors for the presence of the dominant dry mixed low grown vegetation in the area consisting of herbs, shrubs and predominantly small trees. Over 90% of the trees are of height of less than 3 m. Due to the low height of the vegetation, it is ideal for browsing animals such as goats. The study identified 48 prominent species of flowering plants classified within 22 taxonomic families. Site B was found to be a floristically richer area with 41 species. The results showed that 50%, 39% and 70% of plants identified at sites A, B and C had IVI values > 10 respectively. Out of this amount, it was further found that72.3%, 87.5% and 60% of all species with IVI > 10 at site A, B and C were fair, good or very good fodder plants respectively. This indicates that site B is not only floristically richer but also is better utilizable as a fodder land for goats than sites A and C. The number of fodder plants available per hectare at site B is also higher than the other two sites. The order of preference for the 3 areas as rearing sites would be in the order: B > A > C. The results further identified species such as Carissa spinarum, Mayterus emerginata, and Flugia leucopyrus as nutritionally rich fast growing fodder plants present throughout the year while Acacia eburnea, Bauhinia racemosa, Tephrosia purpurea and Erythrina fusca are nutritionally rich fast growing fodder plants present predominantly only during the rainy periods. Selective removal of some non fodder plants could facilitate the growth of these plants increasing the carrying capacity of the forest area for goat farming as well as minimizing the long term damages to the environment through browsing. Using the simple method described in this paper, valuable information to prospective small scale goat farmers can therefore be given so that goat farming can be developed in the identified areas as a viable source of income but with least impacts on the natural environment..
Goat rearing has been identified in Sri Lanka as a viable option for farmers to eradicate poverty. High cost of fodder is however a limiting factor. Large areas of unutilized scrub jungle are available in the dry zones of Sri Lanka. This paper presents a simple method to study the feasibility of using natural vegetation in a goat rearing system in the Hambantota district of Sri Lanka. Fodder plants within the vegetation were listed. Their abundance, growth rates as biomass production and nutritional value were estimated and on the basis of these data the best site for goat rearing among the 3 sites studied was recognized. Carrying capacity of a site can be increased through selective removal of non-fodder plants. The data provides valuable information for prospective goat farmers.
Ashton,P.S. and C.V.S. Gunatilleke, 1987: New light on the plant geography of Ceylon.Historical plant geography, Journal of Biogeography 14:249-285
Cocran, W.G., 1977, Sampling techniques, 3rd Edition, Wiley & Sons, New York, 413 pp.
Gunasena, H.P.M, 1990, Agriculture and livestock sectors, Draft submitted for Natural Resources Profile.
Hawksworth, D.L.,(ed) 1995, Biodiversity, Measurement and Estimation, Chapman & Hall,London 140pp.
. Land and Water Use Division, 1976:Agro-ecological regions map of Sri Lanka, Dept of Agriculture, Peradeniya
Magurran,A.E., 1988. Ecological diversity and its measurement, Croom Helm Ltd., London, 179 pp
Moorman, F.R. and C.R. Panabokke, 1961, Soils of Ceylon, Tropical Agriculturist, 117, 2-65.
This work was supported by a grant from the Association for Technical Cooperation of Germany (GTZ) under the Smallholder Integrated Livestock Extension Project (SILEP), Sri Lanka.
| [1] Professor, Department of
Botany, University of Ruhuna, Matara, Sri Lanka. Email: [email protected] |