![]()
![]()
![]()
presented for ALCOM by
Inès Beernaerts
RAFA, Accra, Ghana
Summary
The Southern African Development Community (SADC) Water Resource Database (WRD) has evolved from the need to estimate the potential of small-water bodies fisheries development.
This database integrates information on surface water bodies, watersheds, rivers, fish species distribution and related data, in a Geographic Information System. It is currently the most comprehensive and complete source of information on surface water resources in southern Africa.
Résumé
La base de données sur les ressources en eau de la Communauté du Développement de l'Afrique Australe (SADC) s'est développée à partir du besoin d'estimer le potentiel de développement piscicole des petits plans d'eau.
Cette base de données intègre les informations sur les plans d'eau de surface, les bassins versants, les rivières, la distribution des espèces piscicoles et sur toutes données relatives à ces sujets, en un Système d'Information Géographique. C'est actuellement la source d'information la plus complète d'Afrique australe sur les ressources en eau de surface.
1 DEVELOPMENT AND OBJECTIVES OF THE DATABASE
Since 1992, ALCOM has been gathering information on surface water bodies from all countries in the Southern African Development Community (SADC) Region. This work has evolved in the establishment of a Water Resource Database (WRD) which contains numerous data on surface water resources.
The WRD is composed of a number of database components:
Principal objective: to estimate the fishery potential.
Principal objectives: hydrological monitoring and development of digital fish species distribution maps.
Objective: to provide background information and mapping facilities for the other database components.
Objective: to recommend the use of appropriate species for stocking, to avoid the transfer of alien species between different catchments.
WRD is integrated into a Geographic Information System (GIS) but it can also be used as a stand-alone application. The above four main database components are inter-linked through standard identifiers, which give maximum flexibility to the users.
The structure of the database and the various types of data allow the users to approach the water issue in a holistic way and to use the database as a decision support tool for policy-makers, government services and non-governmental organizations. There are applications in various disciplines such as fisheries and aquaculture (e.g. species selection, fishery potential), water resources (e.g. irrigation potential), health (e.g. control of waterborne diseases), and environmental issues (e.g. pest distribution).
2 THE SURFACE WATER BODY DATABASE
2.1 Introduction
This database has been created to estimate the fishery potential of surface water bodies (SWB). Since 1992, ALCOM has been gathering information on SWBs from countries in the SADC Region. To date, more than 18 000 SWBs have been inventoried in eleven countries (Angola, Botswana, Lesotho, Malawi, Mozambique, Namibia, South Africa, Swaziland, Tanzania, Zambia, Zimbabwe). More data are still being added daily.
Database fields include administrative, geographical, physical, chemical, meteorological, and socio-economic data, as well as data on the use of the water body, the presence of plant and animal species and fishing activities.
A meta-database contains the data sources for each entry. Data originate from government departments, projects, ALCOM surveys, individual records and literature.
2.2 Conditions for Entry
Both reservoirs and natural water bodies larger than one hectare are included in the inventory under specific conditions, although some of the data fields are only valid for reservoirs (e.g. dam wall data).
2.3 Data Fields
Initially, the principal purpose of the database was to provide an instrument for estimating fishery potential. As a consequence, a large number of data fields handle information on fish species or fisheries, and on a number of physico-chemical and geographical parameters that are important to estimate potential fishery yield.
2.4 Integration into a Geographical Interface and GIS
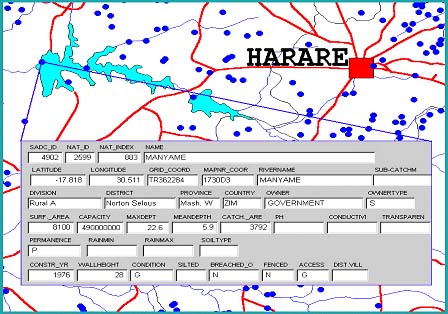
For the geo-referenced entries, the data have been integrated in a geographical interface. It is possible to zoom in on standardized hydrological maps into a certain area and to click on displayed points (SWBs) to get more information about them (Figure 1).
On the other hand, one can also display one particular reservoir or a set of selected reservoirs based on their characteristics. Soil data, physico-chemical data and climatological data are then plugged into fish production models to estimate fish production. The same data will be used to develop models for the estimation of fish production and to define recommendations on optimum species choice, for a given set of geographical locations.
2.5 Future of the Database
Just like most other databases, the SWB database is very dynamic. Additional information is regularly obtained to complete fields for registered water bodies and fields are being added when needed. For example, as new dams are being constructed, their data are added to the database and a field was recently added to register the presence of water hyacinth, to be able to monitor its spread to different watersheds. Specific health data fields (like the presence of bilharzia) could also be added or linked to the database, in order to pinpoint priority locations for action, etc.
Applications of the SWB database are not limited to the fishery field. Combination of data on the permanence of a water body, human population density and climatological data could indicate high-risk areas for malaria as well as priority areas for yearly stocking of fish to limit the number of mosquito larvae.
3 THE WATERSHED MODEL AND DATABASE
3.1 Introduction
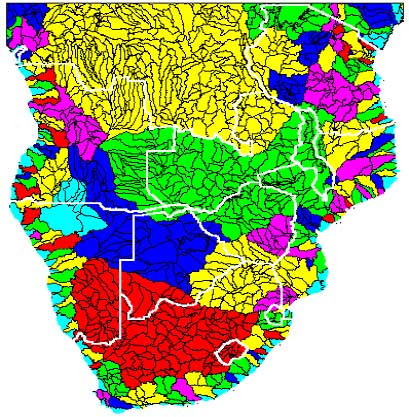
The Watershed Model was developed to delineate exactly the different catchment areas in subequatorial Africa, across country borders and hence to delineate the potential distribution boundaries for aquatic species (Figure 2).
Today, the ultimate applications reach far beyond hydrological monitoring and the development of digital species distribution maps. For instance, another application is the monitoring of downstream spread of aquatic pests such as water hyacinth and other programmes are already using the data for flow analysis to monitor the filling of reservoirs on the basis of the rainfall in their catchment area.
3.2 Development of the Watershed Model and Naming
The SADC Digital Watershed Model is a joint project between ALCOM and the World Wildlife Fund Zimbabwe. The delineation of the subbasins has been done by a consultant based on a DEM and the DCW river layer in Arc Info[8]. Approximately 1 100 subbasins have been delineated for subequatorial Africa. After the delineation, naming and determination of each downstream basin has been done manually at ALCOM, based on the DCW drainage and topographical layer.
Figure 1. Information on a water body that can be displayed on a clickable map.
Figure 2. Display of the catchment areas in subequatorial Africa
3.3 Classification System of the Watersheds
ALCOM has developed a classification system, which allows to determine, the following data for each individual watershed, within seconds and without the use of proper GIS software:
The basis of this classification system is a database, which holds names and the identifier of the downstream basin for each subwatershed.
3.4 Use of the Watershed Model and Database
With the help of the classification system, mapping of downstream basins, upstream basins, mega-watersheds or parts of watersheds becomes very easy. The use of the watershed model and database has been demonstrated at the Workshop using GIS and mapping programmes (Mapviewer, Windisp3). For more information, refer to Section 6.3.
Climatological, elevation and surface statistics are available for each subwatershed, which allows for quick calculation of statistics for complete mega-basins, subbasins or individual subwatersheds.
4 RIVER DATABASE
The River Database has been mainly created to provide background information, mapping facilities for the other database components. It is comprised of approximately 40 000 river stretches covering SADC countries plus Rwanda and Burundi. The coverage has been obtained from the Digital Chart of the World (DCW) through the SADC Regional Remote Sensing Project.
ALCOM has combined the river layers by country, renumbered the stretches with unique identifiers for each country and generated a number of attributes for all 40 000 river stretches, through GIS. Generated attributes include watersheds, minimum and maximum elevation and country. Additional data are available for a few countries.
ALCOM is currently not planning to further develop the river database, since other programmes are dealing with river flow already (e.g. FRIENDS Project). New layers, particularly with names are welcome however, mainly to facilitate the verification work of the Aquatic Species Distribution Database (see next).
5 AQUATIC SPECIES DISTRIBUTION DATABASE
The Aquatic Species Distribution Database (ASD) has been conceived in order to recommend the use of appropriate species for stocking and to avoid the transfer of alien species between different catchments. It has evolved however into a much more powerful instrument for ecologists and zoogeographers, based on information from a number of important museum collections, both from inside and from outside the Region[9].
ALCOM's task in the ASD Project is to integrate the collections into a GIS, based on ALCOM's watershed model for southern Africa. Through an overlay of the locations where certain fish species have been found and the subwatersheds, distribution polygons are determined. After checking polygons for possible errors or inaccuracies, digital species distribution mapping becomes available, including historical changes in species distribution, which might be reflected in the collections. The method also offers a unique chance to verify records for possible errors in geographical locations.
The interface and methods for the digital species distribution mapping have been developed already and the different databases are currently being merged and checked for errors in locations.
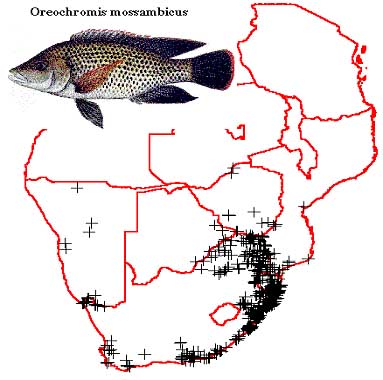
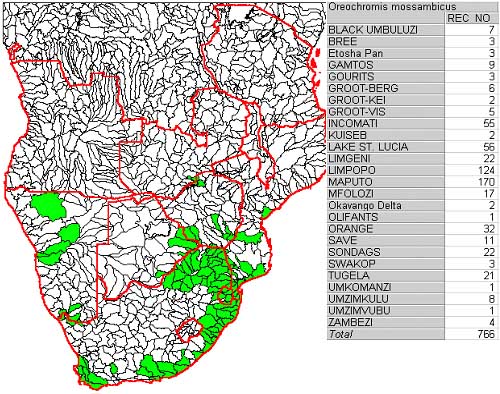
The distribution according to the records in museum collections is first plotted as points on the map. After checking for obvious erratic locations, the records are overlaid with the catchment map (subwatersheds). The result is a digital distribution map (Figure 3).
6 DEVELOPMENT STATUS AND FUTURE OF WRD
6.1 Development Status of WRD
Parts of the WRD such as the Surface Water Body and the Watershed databases are already well developed while other parts such as the Species Distribution, the Fishing Gear and the Socio-economic databases are still being established.
The development of most decision support modules focuses on simple tools, which can be implemented without highly skilled labour and without heavy soft and hardware requirements.
Major work has been achieved in standardization of identifiers for water bodies, watersheds and many other components of the databases. This was crucial to enable linkage of all data from different sources.
Figure 3. Examples of the distribution mapping for Oreochromis mossambicus. - A
Figure 3. Examples of the distribution mapping for Oreochromis mossambicus. - B
Efforts are made to make the use of these identifiers more widespread, to enable linkage to more external data. This will open the WRD to programmes that are active in many different disciplines such as health, dam construction or general environment. However, this stresses the importance of an official establishment of the WRD in a leading regional institution to avoid the loss of this standardization.
The WRD development status relies on data reliability, quality and quantity, which mostly depends on reports and inventories to be provided by the countries themselves.
6.2 Future of the Water Resource Database
A crucial question remains the choice of the hosting institution.
To date, ALCOM has been working under the SADC umbrella but without being formally integrated into a SADC structure. This integration is critical in the long term, not only for the development and updating of the database but also for its access and use.
With regard to the multidisciplinary aspects and the holistic approach of the WRD, it is important to find a host which can fully realize the potential of a database that holds reliable information on the most important natural resource in the SADC Region, water.
Extension of the WRD to the North of the Equator.
ALCOM is currently involved with the extension of the WRD to Africa, North of the Equator, through WWF which is funding the delineation. This new delineation will be matched with the current delineation for southern Africa and hence it will be possible to merge both watershed models. ALCOM will give technical advices to WWF with regard to the ordering and naming of the watersheds.
Potential for integration of irrigation and aquaculture databases.
A collaboration for the development of databases already exists between the FAO Water Resources, Development and Management Service (AGLW) and the FAO Inland Water Resources and Aquaculture Service (FIRI).
For example, AGLW has often been subcontracted by FIRI to produce maps (inland fishery potential development) using the AGLW GIS facilities and ALCOM data. On the other hand, one of the sources for the SWB database (the International Commission on Large Dams Register) has been obtained from AGLW.
At present, AGLW is mapping the "Irrigation in Africa by watershed", while the WRD is being developed. Since the objectives of FIRI (fish potential) and AGLW (irrigation potential) are different, the data used originate from different sources and the maps are produced with different scales. For these technical reasons, the integration of both databases has not yet been possible.
6.3 Obtaining Additional Information
You may download your own file of the SADC Water Resource Database at the following address on the Internet website:
http://www.zamnet.zm/zamnet/alcom.htm
For more information, you may also contact ALCOM by e-mail at:
|
[7] ALCOM is a regional
community-based aquatic resource management programme executed by FAO. Its
objective is to enhance outputs from smallholder farming systems and economies
through improved management of aquatic resources. ALCOM's work covers five
action programmes one of which is the SADC WRD. [8] The DEM of Africa used has been developed by U.S and other international cooperators at the USGS EROS Data Center in Sioux Falls, SD, USA. This DEM was based primarily on elevation data taken from the Digital Chart of the World (DCW) which had been digitized from the 1:1 000 000 Operational Navigation Charts by the Environmental Systems Research Institute (ESRI) for the U.S. Defence Mapping Agency (DMA). [9] This project is driven by Dr Paul Skelton, Director of the J.L.B. Smith Institute, Grahamstown (RSA), who is providing ALCOM with records from the most important museum collections on fish species in southern Africa. |
![]()
![]()
![]()