![]()
![]()
![]()
Aquafeed News. 2001. Dioxin and dioxin-like PCBs in fish and fishmeal. September News Reel, 1 September, 2001. [www.aquafeed.com/september_newsreel.html]
Åsgård, T. & Austreng, E. 1995. Optimal utilization of marine proteins and lipids for human interest. In H. Reinertsen & H. Haaland (eds), Sustainable fish farming. pp. 79-87. Rotterdam, Netherlands, A.A. Balkema.
Åsgård, T., Austreng, E., Holmefjord, I. & Hillestad, M. 1999. Resource efficiency in the production of various species. In N. Svennevig, H. Reinertsen & M. New (eds), Sustainable aquaculture: food for the future? pp. 171-183. Rotterdam, Netherlands, A.A. Balkema.
Barlow, S. 2000. Fishmeal and fish oil: sustainable feed ingredients for aquafeeds. Global Aquaculture Advocate, 3(2):85-88.
Brandsen, M.P., Carter, C.G. & Nowak, B.F. 2001. Alternative protein sources for farmed salmon. Feed Mix, 9(4/5):18-21.
Cailliez, B. 2001. The use of plant-based feed in fish farming. INFOFISH International, 6/2001:31-33.
Chamberlain, G.W. 1993. Aquaculture trends and feed projections. World Aquaculture, 24(1):19-29.
Chamberlain, G.W. 2000. Aquaculture projections for use of fishmeal and oil. Oral presentation at the Annual Meeting of IFOMA, Lima, Peru, 30 October - 3 November 2000. (MS)
Crawford, M.A., Bloom, M., Broadhurst, C.L., Schmidt, W.F., Cunnane, S.C., Galli, C., Gehbremeskel, K., Linseisen, F., Lloyd-Smith, J. & Parkington, J. 1999. Evidence for the unique function of DHA during the evolution of the modern hominid brain. Lipids, 34:S39-S47.
Cremer, M., Baoxin, Z., Schmittou, H. & Jian, Z. 1998. Status and forecast for the freshwater aquaculture production and feed industries in China. Paper presented at Aquaculture ‘98, 16-19 February 1998, Las Vegas, Nevada. Baton Rouge, Louisiana, USA, World Aquaculture Society,.
De Silva, S.S. 1999. Feed resources, usage and sustainability. pp. 221-242 In N. Svennevig, H. Reinertsen & M. New (eds), Sustainable aquaculture: food for the future? Rotterdam, Netherlands, A.A. Balkema.
Dowden, A. 2001a. Salmon; so just what are the alternatives? Daily Mail, 16 January 2001:53. London, United Kingdom, ANL.
Dowden, A. 2001b. Muddy waters. Sunday Times Style Magazine, 4 March, 2001:41. London, United Kingdom, Times Newspapers Ltd.
FAO. 1980. A review of the world resources of mesopelagic fish, by J. Gjosaeter & K. Kawaguchi. FAO Fisheries Technical Paper No. 193. Rome. 149 pp.
FAO. 1987. Feeds and feeding of fish and shrimp: a manual on the preparation and presentation of compound feeds for fish and shrimp in aquaculture, by M.B. New. FAO Report No. ADCP/REP/87/26. Rome.
FAO. 1993a. Farm-made aquafeeds, by M.B. New, A.G.J. Tacon & I. Csavas (eds). FAO Fisheries Technical Paper No. 343. Rome. 434 pp.
FAO. 1993b. Feed ingredients for warmwater fish: fishmeal and other processed feedstuffs, by A.G.J. Tacon. FAO Fisheries Circular No. 856. Rome. 68 pp.
FAO. 1994. Feed ingredients for carnivorous fish species: alternatives to fishmeal and other fishery resources, by A.G.J. Tacon. FAO Fisheries Circular No. 881. Rome,. 39 pp.
FAO. 1995. Code of conduct for responsible fisheries. Rome. 41 pp.
FAO. 2000. The state of world fisheries and aquaculture. Rome. 160 pp.
FAO. 2001a. Fishery statistics Vol. 88/2: aquaculture production. FAO Fisheries Series No. 58/FAO Statistics Series No. 160. Rome. 178 pp.
FAO. 2001b. Options for utilization of lantern fish (Benthosema pterotum, Myctophidae) in the Gulf of Oman by F. Teutscher. Rome. 8 pp. (mimeo)
FAO. 2001c. Efficient capture and handling of lantern fish, by W. Thiele & J.W. Valdemarsen. Rome,. 10 pp. (mimeo)
FAO. In press. Promotion of sustainable commercial aquaculture in Sub-Saharan Africa. Volume 2: Investment and economic feasibility, by N. Hishamunda & P. Manning. FAO Fisheries Technical Paper No. 408/2. Rome.
FAO/ESN. 1999. Animal Feeding and Food Safety. In International Aquafeed Directory and Buyers’ Guide 1999. pp. 12-18. Uxbridge, United Kingdom, Turret RAI, plc.
FAO Fishstat. 2001. Fishstat Plus (v.2.30). Rome.
FIN. 2001. The fight for fishmeal goes on (press release 22 June 2001). Fishmeal Information Network (Grain and Feed Trade Association, UK). [[email protected]]
Fiskeridirektoratet. 2001. Preliminary results from the profitability survey on Norwegian fish farms in 2000. Fiskeridirektoratet, Oslo, Norway. [www.fiskeridir.no]
Forster, J. & Hardy, R. 2001. Measuring efficiency in intensive aquaculture. World Aquaculture, 32(2):41-42,44-45.
Gérin, M. 1999. Feed additives and biotechnologies in aquafeeds: moving towards sustainable development. In International Aquafeed Directory and Buyers’ Guide 1999. pp. 32-40. plc. Uxbridge, United Kingdom. Turret RAI.
Gill, C. 1998. Curtain falling on Asia’s ‘feed decade’? Feed International, January 1998:4-6.
Gill, C. 1999. First, Asian feed slump... Now, global stagnation? Feed International, January 1999:4-10.
Gill, C. 2000. Growth recovering, slowly. Feed International, January 2000:4-6.
Girling, R. 2001. Is this fish or is it foul? The Sunday Times Magazine, 30 September, 2001:40-43, 45-46, 49. Times Newspapers Ltd., London, United Kingdom.
Global Aquaculture Advocate. 2001. Aquaculture associations compare codes at international summit., 4(4):3-4.
Globefish. 2001a. One page (internet) presentations: fishmeal. www.globefish.org
Globefish. 2001b. Commodity update. Fishmeal, Fishoil. FAO, Rome, Italy. 76 pp.
Klinkhard, M. 2001. How contaminated are fish and fish products? EUROFISH Magazine, 4/2001:102-104.
Leake, J. 2001. Fish farms turn salmon into fatty food. The Sunday Times, 8 July, 2001:14. Times Newspapers Ltd., London, United Kingdom.
Little, D.C. & Edwards, P. 1997. Contrasting strategies for inland fish and livestock production in Asia. pp. 75-87 In J.L. Corbett, M. Choct, J.V. Nolan & J.B. Rowe (eds), Recent Advances in Animal Nutrition in Australia ‘97, 30 June - 2 July 1997. Armidale, New South Wales, Australia, University of Armidale at New England.
Martín, A. 1998. Current status of the aquafeed industry in Europe. International Aquafeed, 1(3):5-9.
Martín, A. 2000. Developments in the European aquafeed industry. International Aquafeed, 3/2000.
Millar, G. 2001. IFFO must focus on EU and China. Fish Farming International, 28(10):37.
MAFF. 2001. Facts on the Industrial Fisheries. Note to the Council of the European Union. Ministry of Food, Agriculture and Fisheries, Copenhagen, Denmark. 8 pp. (mimeo)
NACA/FAO. 2000. Aquaculture development beyond 2000: the Bangkok Declaration and Strategy. Conference on Aquaculture in the Third Millennium, 20-25 February 2000, Bangkok, Thailand. NACA, Bangkok, Thailand and FAO, Rome, Italy. 27 pp.
Naylor, R.L., Goldburg, R.J., Primavera, J.H., Kautsky, N., Beveridge, M.C.M., Clay, J., Folke, C., Lubchenco, J., Mooney, H. & Troell, M. 2000. Effects of aquaculture on world fish supplies. Nature, 405:1017-1024.
New, M.B. 1991. Turn of the millennium aquaculture: navigating troubled waters or riding crest of the wave? World Aquaculture, 22(3):28-49.
New, M.B. 1997. Aquaculture and the capture fisheries - balancing the scales. World Aquaculture, 28(2):11-30.
New, M.B. 1999. Global aquaculture: current trends and challenges for the 21st century. World Aquaculture, 30(1):8-13, 63-79.
New, M.B. 2001. The European aquafeed industry, Part II. Fish Farmer, 24(5):46-48.
New, M.B. & Csavas, I. 1995. The use of marine resources in aquafeeds. pp. 43-78 In: H. Reinertsen & H. Haaland (eds), Sustainable fish farming. A.A. Balkema, Rotterdam, Netherlands.
New, M.B. & Valenti, W.C. (eds). 2000. Freshwater Prawn Culture. Blackwell Science, Oxford, United Kingdom. 443 pp.
New, M.B. & Wijkstrom, U.N. 1990. Feed for thought: some observations on aquaculture feed production in Asia. World Aquaculture, 21(1):17-19, 22-23.
New, M.B., Shehadeh, Z. & Pedini, M. 1995. Status and trends in food production through aquaculture. FAO Aquaculture Newsletter (FAN), 9:12-18.
Noguchi, F.S. 2001. Utilization of the resources of Myctophiformes as fisheries products. p. 8 In: Abstracts of the International Symposium on More Efficient Utilization of Fish and Fisheries Products, 7-10 October, 2001, Kyoto, Japan. Graduate School of Agriculture, Kyoto University, Japan.
Pedini, M. 1999. Bridging the gap: can aquaculture meet the additional demand for fishery products? FAO Aquaculture Newsletter (FAN), 24:4-9.
Pike, I. 1998. Future supplies of fishmeal and fish oil: quality requirements for aquaculture with particular reference to shrimp. In International Aquafeed Directory & Buyers’ Guide 1998. pp. 39-49. Uxbridge, United Kingdom, Turret RAI plc.
Ridmontri, C. 2001. Ambitious period for Charoen Pokphand Food: an interview with Dr. Chingchai Lohawatanakul. Asian Aquaculture Magazine, May/June 2001:30-32.
Rosenlund, G., Obach, A., Sandberg, M.G., Standal, H. & Tveit, K. 2001. Effect of alternative lipid sources on long-term growth performance and quality of Atlantic salmon (Salmo salar L.). Aquaculture Research, 32 (Suppl. 1):323-328.
SCAN. 2000. Opinion of the Scientific Committee on Animal Nutrition on the dioxin contamination of feedingstuffs and their contribution to the contamination of food of animal origin. Adopted 6 November, 2000. Brussels, Belgium, European Commission. 105 pp.
Sorgeloos, P. 2000. Technologies for sustainable aquaculture development. Plenary lecture presented at the International Conference on Aquaculture in the Third Millennium, 20-25 February 2000, Bangkok, Thailand. NACA, Bangkok, Thailand. (MS)
Stirling. 1999-2000. Annual report of the Institute of Aquaculture, University of Stirling 1999-2000. University of Stirling, Stirling, United Kingdom. 27 pp.
Svennevig, N., Reinertsen, H. & New, M.B. (eds). 1999. Sustainable aquaculture: food for the future? A.A. Balkema, Rotterdam, Netherlands. 348 pp.
Tacon, A.G.J. 1995. Feed ingredients for carnivorous species: alternatives to fishmeal and other fishery resources. In H. Reinertsen & H. Haaland (eds), Sustainable fish farming. pp. 89-114. A.A. Balkema, Rotterdam, Netherlands.
Tacon, A.G.J. 1998. Global trends in aquaculture and aquafeed production 1984-1995. In International Aquafeed Directory & Buyers’ Guide 1998. pp. 5-37. Uxbridge, United Kingdom, Turret RAI plc.
Wijkström, U.N. & New, M.B. 1989. Fish for feed: a help or a hindrance to aquaculture in 2000? INFOFISH International, 6/89:48-52.
Yoshitomi, B. 2001. Utilization of Antarctic krill for food and feed. p. 6 In: Abstracts of the International Symposium on More Efficient Utilization of Fish and Fisheries Products, 7-10 October, 2001, Kyoto, Japan. Graduate School of Agriculture, Kyoto University, Japan.
Table 1. Species selected as being or likely to be fed commercial feeds containing products from marine resources (fishmeal[11] and fish oil[12])
|
ISSCAAP Code[13] |
Species included, with systematic codes[14] |
Name used in this study |
Species excluded |
|
1 |
FRESHWATER FISH |
||
|
11 |
Common carp |
COMMON CARP |
All other cyprinids |
|
12 |
All tilapias and other cichlids |
TILAPIA |
None |
|
13 |
All types of catfish |
CATFISH |
All others in group 13 |
|
13 |
Gobies, largemouth black bass, mandarin fish, pikes, perches and snakeheads |
SELECTED FRESHWATER FISH |
All others in group 13 |
|
2 |
DIADROMOUS FISH |
||
|
22 |
River eels |
EELS |
None |
|
21 and 23 |
All trouts (except sea trout), sturgeons and paddlefishes |
TROUTS AND STURGEONS |
All others in group 23 |
|
23 |
All salmon, sea trout and chars |
SALMON |
All others in group 23 |
|
25 |
Milkfish |
MILKFISH |
All others in group 25 |
|
25 |
Asian seabass (= giant seaperch = barramundi) and hybrid striped bass |
OTHER DIADROMOUS |
All others in group 25 |
|
3 |
MARINE FISH |
||
|
31, 32, 36 and 39 |
Halibuts, soles, turbots and other flatfish, cod, tunas and miscellaneous marine fishes |
SELECTED MARINE FISH |
None |
|
33 |
Groupers, seabasses, seabreams, snappers and drums. |
REDFISH |
None |
|
34 |
Cobia, jacks and horse mackerels and amberjacks (yellowtails) |
JACKS AND YELLOWTAILS |
All others in group 34 |
|
4 |
CRUSTACEANS |
||
|
41 |
Giant river prawn[15] and freshwater prawns, shrimps nei (Palaemonidae) |
FRESHWATER PRAWNS |
All others in group 41[16] |
|
41, 42 and 43 |
All freshwater and marine crabs, and lobsters |
CRABS AND LOBSTERS |
All others in group 41 |
|
45 |
All marine shrimp |
MARINE SHRIMP |
None |
Table 2. Future aquaculture expansion rates used in this study[17]
| SPECIES GROUP |
GLOBAL |
WORLD WITHOUT CHINA |
||
| APR APPLIED (%) |
SOURCE AND COMMENTS |
APR APPLIED (%) |
SOURCE AND COMMENTS |
|
| COMMON CARP |
7.2 |
1997-1999 |
Nil |
Lowest rate minus |
| TILAPIA |
9.1 |
1997-1999 |
7.6 |
1990-1999 |
| CATFISH |
1.0 |
1997-1999 |
1.0 |
China production nil |
| SELECTED FRESHWATER FISH |
10.0 |
Artificially capped rate (lowest actual rate was ~22%) |
5.0 |
Artificially capped rate (lowest actual rate was ~12%) |
| EELS |
Nil |
Lowest rate (1997-1999) was minus |
Nil |
Rates for all periods minus |
| TROUTS AND STURGEONS |
0.4 |
1997-1999 |
0.4 |
China production nil |
| SALMON |
10.4 |
1997-1999 |
10.4 |
China production nil |
| MILKFISH |
Nil |
Lowest rate (1990-1999) was minus |
Nil |
China production nil |
| OTHER DIADROMOUS |
2.1 |
1995-1999 |
2.1 |
China production nil |
| SELECTED MARINE FISH |
10.0 |
Artificially capped rate (lowest actual rate was ~12%) |
5.0 |
Artificial rate (lowest, in 1997-1999, minus but all others were >18%) |
| REDFISH |
12.0 |
Artificially capped rate (lowest actual rate was ~13% |
12.0 |
China production nil |
| JACKS AND YELLOWTAILS |
Nil |
Actual rates for 3 of the 4 periods were minus |
Nil |
China production nil |
| FRESHWATER PRAWNS |
10.0 |
Artificially capped rate (lowest rate was >16%) |
5.0 |
Artificial rate (lowest was 1.1% but it was nearly 13% in 1997-1999). The 98-99 increase was higher |
| CRABS AND LOBSTERS |
10.0 |
Artificially capped rate (lowest was >26%) |
Nil |
Lowest rate minus |
| MARINE SHRIMP |
4.4 |
1995-1999 |
2.4 |
1995-1999 |
Table 3. Parameters used in this study
| SPECIES GROUP |
YEAR |
AFCR[18] |
% FED ON AQUAFEEDS |
INCLUSION RATE IN FEEDS (%) |
|
| FISHMEAL |
FISH OIL |
||||
| COMMON CARP |
1999 |
2.0 |
25 |
5 |
1 |
| 2015 |
1.5 |
50 |
2 |
1 |
|
| 2030 |
1.3 |
80 |
0 |
1 |
|
| TILAPIA |
1999 |
2.0 |
40 |
7 |
1 |
| 2015 |
1.5 |
60 |
3 |
1 |
|
| 2030 |
1.3 |
90 |
0 |
1 |
|
| CATFISH |
1999 |
1.6 |
85 |
3 |
1 |
| 2015 |
1.4 |
90 |
0 |
1 |
|
| 2030 |
1.2 |
95 |
0 |
1 |
|
| SELECTED FRESHWATER FISH |
1999 |
2.5 |
50 |
50 |
10 |
| 2015 |
1.8 |
80 |
25 |
15 |
|
| 2030 |
1.5 |
100 |
15 |
15 |
|
| EELS |
1999 |
2.0 |
80 |
50 |
10 |
| 2015 |
1.5 |
90 |
40 |
8 |
|
| 2030 |
1.2 |
95 |
20 |
8 |
|
| SALMON |
1999 |
1.2 |
100 |
40 |
25 |
| 2015 |
1.0 |
100 |
25 |
15 |
|
| 2030 |
0.8 |
100 |
15 |
15 |
|
| TROUTS AND STURGEONS |
1999 |
1.2 |
100 |
30 |
15 |
| 2015 |
1.0 |
100 |
20 |
15 |
|
| 2030 |
0.8 |
100 |
15 |
15 |
|
| MILKFISH |
1999 |
2.0 |
40 |
12 |
3 |
| 2015 |
1.5 |
60 |
5 |
2 |
|
| 2030 |
1.3 |
80 |
5 |
2 |
|
| OTHER DIADROMOUS FISH |
1999 |
1.8 |
60 |
40 |
10 |
| 2015 |
1.5 |
80 |
20 |
10 |
|
| 2030 |
1.2 |
95 |
20 |
10 |
|
| SELECTED MARINE FISH |
1999 |
2.0 |
60 |
45 |
10 |
| 2015 |
1.8 |
80 |
35 |
10 |
|
| 2030 |
1.4 |
90 |
25 |
10 |
|
| REDFISH |
1999 |
2.0 |
80 |
45 |
20 |
| 2015 |
1.8 |
100 |
35 |
15 |
|
| 2030 |
1.4 |
100 |
25 |
10 |
|
| JACKS AND YELLOW TAILS |
1999 |
2.0 |
80 |
45 |
20 |
| 2015 |
1.8 |
100 |
35 |
15 |
|
| 2030 |
1.4 |
100 |
25 |
10 |
|
| FRESHWATER PRAWNS |
1999 |
2.0 |
85 |
20 |
1 |
| 2015 |
1.6 |
95 |
15 |
2 |
|
| 2030 |
1.4 |
100 |
15 |
2 |
|
| CRABS AND LOBSTERS |
1999 |
1.8 |
80 |
25 |
2 |
| 2015 |
1.6 |
90 |
15 |
3 |
|
| 2030 |
1.4 |
90 |
15 |
3 |
|
| MARINE SHRIMP |
1999 |
1.8 |
80 |
25 |
2 |
| 2015 |
1.6 |
90 |
15 |
3 |
|
| 2030 |
1.2 |
95 |
15 |
3 |
|
Table 4. Estimated fishmeal and fish usage by aquaculture in 1999 and projections for 2015 and 2030[19]
| SPECIES GROUP |
YEAR |
FISHMEAL REQUIREMENTS (‘000 tonnes) |
FISH OIL REQUIREMENTS (‘000 tonnes) |
||
| WORLD |
CHINA |
WORLD |
CHINA |
||
| COMMON CARP |
1999 |
64 |
51 |
13 |
10 |
| 2015 |
117 |
109 |
58 |
54 |
|
| 2030 |
- |
- |
230 |
225 |
|
| TILAPIA |
1999 |
61 |
31 |
9 |
5 |
| 2015 |
120 |
73 |
40 |
24 |
|
| 2030 |
- |
- |
191 |
130 |
|
| CATFISH |
1999 |
18 |
- |
6 |
- |
| 2015 |
- |
- |
7 |
- |
|
| 2030 |
- |
- |
7 |
- |
|
| SELECTED FRESHWATER FISH |
1999 |
78 |
56 |
15 |
11 |
| 2015 |
206 |
178 |
124 |
107 |
|
| 2030 |
537 |
502 |
537 |
502 |
|
| EELS |
1999 |
182 |
132 |
36 |
26 |
| 2015 |
123 |
89 |
25 |
18 |
|
| 2030 |
52 |
38 |
21 |
15 |
|
| SALMON |
1999 |
437 |
- |
273 |
- |
| 2015 |
1 107 |
- |
664 |
- |
|
| 2030 |
2 345 |
- |
2 345 |
- |
|
| TROUTS AND STURGEONS |
1999 |
170 |
- |
85 |
- |
| 2015 |
101 |
- |
75 |
- |
|
| 2030 |
64 |
- |
64 |
- |
|
| MILKFISH |
1999 |
37 |
- |
9 |
- |
| 2015 |
17 |
- |
7 |
- |
|
| 2030 |
20 |
- |
8 |
- |
|
| OTHER DIADROMOUS FISH |
1999 |
11 |
- |
3 |
- |
| 2015 |
8 |
- |
4 |
- |
|
| 2030 |
11 |
- |
5 |
- |
|
| SELECTED MARINE FISH |
1999 |
218 |
183 |
49 |
41 |
| 2015 |
936 |
864 |
268 |
247 |
|
| 2030 |
2 444 |
2 351 |
978 |
940 |
|
| REDFISH |
1999 |
167 |
- |
74 |
- |
| 2015 |
896 |
- |
384 |
- |
|
| 2030 |
2 725 |
- |
1 090 |
- |
|
| JACKS AND YELLOWTAILS |
1999 |
107 |
- |
47 |
- |
| 2015 |
94 |
- |
40 |
- |
|
| 1999 |
35 |
27 |
2 |
1 |
|
| 2015 |
107 |
96 |
14 |
13 |
|
| 2030 |
412 |
390 |
55 |
52 |
|
| CRABS AND LOBSTERS |
1999 |
99 |
96 |
8 |
8 |
| 2015 |
274 |
272 |
55 |
54 |
|
| 2030 |
1 000 |
998 |
200 |
200 |
|
| MARINE SHRIMP |
1999 |
407 |
62 |
33 |
5 |
| 2015 |
486 |
183 |
97 |
37 |
|
| 2030 |
735 |
392 |
147 |
78 |
|
| TOTALS |
1999 |
2 091 |
638 |
662 |
107 |
| 2015 |
4 592 |
1 864 |
1 862 |
554 |
|
| 2030 |
10 397 |
4 671 |
5 899 |
2 142 |
|
Table 5. Global supplies[20] of fishmeal and oil and their estimated and potential usage by aquaculture
| FISHMEAL |
FISH OIL |
|||||
| YEAR |
GLOBAL SUPPLY (‘000 tonnes) |
USAGE BY AQUACULTURE (%) |
GLOBAL SUPPLY (‘000 tonnes) |
USAGE BY AQUACULTURE (%) |
||
| GLOBAL |
CHINA |
GLOBAL |
CHINA |
|||
| 1999 |
6 548 |
32 |
10 |
1 360 |
49 |
8 |
| 2015 |
6 526 |
70 |
29 |
1 283 |
145 |
43 |
| 2030 |
6 526 |
159 |
72 |
1 283 |
460 |
167 |
Table 6. Chile: dispositions of landings for species, of which part or all has been converted into fishmeal and/or fish oil in 1997, 1998 and 1999 (tonnes)
| 1997 |
1998 |
1999 |
||||
| FISHMEAL |
OTHER USES |
FISHMEAL |
OTHER USES |
FISHMEAL |
OTHER USES |
|
| ANCHOVY |
1 753 355 |
3 416 |
516 301 |
5 521 |
1 968 472 |
7 059 |
| MACKEREL |
206 390 |
4 525 |
59 699 |
9 984 |
114 335 |
4 260 |
| JACK MACKEREL |
2 529 663 |
374 993 |
1 128 683 |
478 702 |
876 199 |
339 624 |
| HAKE |
57 702 |
1 845 |
331 951 |
1 851 |
282 570 |
4 749 |
| SARDINE |
26 989 |
10 366 |
21 900 |
3 083 |
239 803 |
3 383 |
| COMMON SARDINE |
439 011 |
1 494 |
315 848 |
140 |
775 754 |
366 |
| OTHER SPECIES |
20 514 |
71 845 |
644 |
69 509 |
5 660 |
85 641 |
| TOTALS |
5 033 624 |
468 484 |
2 375 026 |
568 790 |
4 262 793 |
445 082 |
Source: F. Pereira, pers. comm., 2001.
Table 7: Estimated catches (tonnes) from the Danish industrial fisheries in the North Sea, the Skagerrak and the Kattegat in 1999[21]
|
TARGET SPECIES |
NORTH SEA |
SKAGERRAK |
KATTEGAT |
TOTAL |
|
|
||||
|
SAND EEL |
500 105 |
11 081 |
569 |
511 755 |
|
SPRAT |
162 713 |
6 812 |
10 438 |
179 963 |
|
NORWAY |
40 969 |
6 822 |
675 |
48 466 |
|
BLUE WHITING |
41 117 |
3 623 |
273 |
45 013 |
|
HORSE MACKEREL |
4 432 |
73 |
78 |
4 583 |
|
|
||||
|
BY-CATCH |
||||
|
HERRING |
15 232 |
3 211 |
5 867 |
24 310 |
|
COD |
101 |
60 |
52 |
213 |
|
HADDOCK |
1 056 |
334 |
90 |
1 480 |
|
WHITING |
3 826 |
503 |
694 |
5 023 |
|
MACKEREL |
1 196 |
81 |
0 |
1 277 |
|
SAITHE |
40 |
37 |
0 |
77 |
|
GREY GURNARDS |
2 396 |
100 |
5 |
2 501 |
|
OTHERS |
16 985 |
3 689 |
271 |
20 945 |
|
|
||||
|
TOTALS |
790 68 |
36 426 |
19 012 |
845 606 |
Source: MAFF (2001).
Table 8: Average yearly ex-vessel price for species supplied to fishmeal plants
|
COUNTRY |
MAIN SPECIES |
US$/TON |
YEAR |
NOTES |
|
DENMARK |
Sand eel |
81 |
2000 |
Industry source |
|
DENMARK |
Sand eel |
92 |
2001 |
|
|
CHILE |
Horse mackerel (Jurel) |
80 |
2001 |
Price for fish purchased from independent vessels (F. Pereira, pers. comm., 2001) |
|
CHILE |
Common sardine and anchoveta |
45 |
2001 |
|
|
ICELAND |
Herring |
183 |
1998 |
Average yearly prices; market determined (R. Arnason, pers. comm. 2001) |
|
ICELAND |
Herring |
112 |
1999 |
|
|
ICELAND |
Herring |
|
2000 |
|
|
ICELAND |
Capelin |
100 |
1998 |
|
|
ICELAND |
Capelin |
61 |
1999 |
|
|
ICELAND |
Capelin |
|
2000 |
|
|
USA |
Atlantic menhaden |
133 |
1998-2000 |
www.st.nmfs.gov |
Table 9. International market price of fishmeal and fish oil; yearly average, CIF Hamburg (US$/tonnes)[22]
|
|
1970 |
1980 |
1985 |
1990 |
1995 |
1997 |
1998 |
1999 |
2000 |
|
FISHMEAL |
202 |
504 |
280 |
412 |
497 |
606 |
662 |
393 |
413 |
|
FISH OIL |
249 |
450 |
303 |
250 |
457 |
547 |
727 |
314 |
262 |
Source: Globefish (2001b).
Figure 1. Global fishmeal production 1976-1999 (mt)
Source: FAO Fishstat (2001).
Figure 2. Global fish oil production 1976-1999 (mt)
Source: FAO Fishstat (2001).
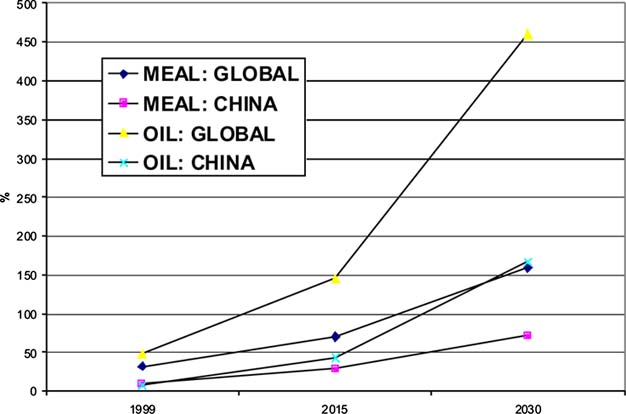
Figure 3. Estimated proportion of available fishmeal supplies used by global aquaculture and by China alone in 1999, with projections for 2015 and 2030 (%)[23]
Figure 4. Estimated proportion of available fish oil supplies used by global aquaculture and by China alone in 1999, with projections for 2015 and 2030 (%)[24]
Figure 5. Illustration of the time when the demands from aquaculture for fishmeal and fish oil would exceed supplies, assuming that supplies remain static at 1990-1999 average annual levels
|
[11] FAO major fishery
commodity group: meals, solubles, etc. [12] FAO major fishery commodity group: oils and fats. [13] International Standard Statistical Classification of Aquatic Animals and Plants. [14] Taxonomic code descriptors (taken from FAO’s Aquatic Sciences and Fisheries Information System) or scientific names have been specified where there is any doubt about the species named. [15] This excludes those reared in Viet Nam; see the following footnote. [16] This category should include giant river prawns reared in Viet Nam but the amount, although substantial, is not yet separately recorded in FAO data. [17] The rate applied is the lowest from the four historical periods 1984-1999, 1990-1999, 1995-1999, and 1997-1999, except where otherwise stated (some rates have been artificially set for the reasons stated in the table). [18] Apparent Feed Conversion Ratio (see section 3.3). [19] All usage figures have been rounded to the nearest thousand tons; in the totals columns, the proportion of resources utilized by Chinese aquaculture has also been shown as a percentage of the global total. [20] Global supplies of fishmeal and fish oil in 2015 and 2030 have been assumed to be the same as the 1990-1999 average annual supply. [21] Estimates from test samples. [22] Fishmeal: CIF Hamburg; Fish oil: CIF North West Europe. [23] Global supplies of fish meal in 2015 and 2030 have been assumed to be the same as the 1990-1999 annual average supply. [24] Global supplies of fish oil in 2015 and 2030 have been assumed to be the same as the 1990-1999 annual average supply. |
![]()
![]()
![]()
)
)
![Figure 3. Estimated proportion of available fishmeal supplies used by global aquaculture and by China alone in 1999, with projections for 2015 and 2030 (%)[23]](javascript:createindex('y3781e02.gif'))
![Figure 4. Estimated proportion of available fish oil supplies used by global aquaculture and by China alone in 1999, with projections for 2015 and 2030 (%)[24]](javascript:createindex('y3781e03.gif'))