by Christopher Parker
Fisheries Division, Princess Alice Highway
Bridgetown, Barbados
[email protected]
1. BACKGROUND
Over the period 1989-1999, flyingfish accounted for approximately 59 % of the island’s fish catch by weight. The margined flyingfish, (Hirundicthys affinis) comprises the majority of the Barbadian flyingfish catch. The guineaman (Cypselurus cyanopterus) was occasionally taken while other species were too rare or small to be commercially important. The majority of the catch (86 % in 1999) was taken by dayboats (also called day-launches) and iceboats. In 1999 there were 273 dayboats with overall hull lengths ranging between around 5 m and 12 m registered in the Barbadian fleet. A total of 149 vessels with hull lengths ranging between around 10 m to 17 m comprised the registered iceboat fleet.
At sea the fisherman searches for the presence of flotsam, which is a good indicator of the presence of flyingfish. If flyingfish are spotted around the flotsam he immediately commences fishing. For this he turns off the boat’s engine and allows the vessel to passively drift with the surface currents and wind. As the boat drifts he releases his gillnet into the sea. If fish are not spotted in the immediate area, the fisherman deploys temporary fish attracting devices known as “screelers”. A screeler is simply a bundle of sugar cane or coconut fronds attached to the boat by a length of rope. Most often a number of screelers (max of 6) are tied to the same line at roughly 100 m intervals. The fisherman may also then hang a basket containing pieces of fish and offal (called “chum”) over the side of the boat. As the boat rolls with the waves, the basket dips into the water causing the pieces of fish to spill out onto the sea. Once flyingfish are spotted in the area, the fisherman deploys a drifting gillnet. He then pulls the screelers closer to the ship, positioning one behind the net. This action draws the flyingfish into the vicinity of the net and facilitates their capture. At some point during the exercise the fisherman will deploy baited lurk lines to capture any large pelagics in the area (Mahon, 1989 In FAO Fisheries Report No. 613, 1999)[6].
The vast majority of flyingfish were captured with monofilament nylon surface gillnets typically varying from 10 m to 15 m in length 2 m to 4 m in depth. Dayboats carry 2 to 4 gillnets while iceboats may carry up to 12 nets. The modern fleet uses mesh sizes ranging from 4.3 to 4.7 cm (roughly 1?” to 1?”) stretched mesh. Nets made of the smaller mesh are used at the beginning of the season when the fish are generally smaller and are replaced by the nets of the larger mesh later in the season when the fish are generally larger. Launches may have as many as three nets in the water at the same time while iceboats may have up to four. The nets are attached at intervals along the side of the vessel so that they hang vertically and parallel to each other in the water. Each net is hauled in and cleared of flyingfish and spawn and then immediately redeployed. The soak time of the nets depends on the abundance of the fish in the area and may vary from under an hour to several hours. A dipnet may also be used to scoop fish out of the water if they come within the range of the fisherman in the vessel (Willoughby and Leslie, in press). The length of time actually spent fishing largely depends on the time taken to gather a reasonably sized catch. Obviously for dayboats the maximum time allowed will be governed by the time that would be needed for the vessel to return to port.
2. OBJECTIVES
The primary objective of the current analyses were to conduct a preliminary estimation of the status of regional flyingfish stocks through standardized assessments of current trends in total landings, fishing effort and CPUE. Such information is useful for structuring management plans for the fishery.
3. DATA USED
Fish landings have been recorded at the island’s major markets since the early 1950s. Tolls are paid based on the quantity and types of fish landed at the market. At the market, fish are placed into broad taxonomic groupings and weighed for the calculation of the tolls payable. In the case of flyingfish, the number of fish is estimated and the weight calculated by the formula 3 flyingfish = 1lb. The amount of toll payed was recorded in receipt books and values from these books eventually recorded in ledgers maintained by market staff. At the end of each day, the weights of each fish group are totalled and this information, along with the number of boats that landed fish on the day is reported on standardized data summary sheets. The summarized data is then submitted to the Fisheries Division at the end of each month. The summarized data includes daily and monthly totals of fish landed at the sites and the total number of vessels landing the recorded catches. These summaries however, often did not accurately distinguish between the types of vessels landing the catch.
Fishers are not required to pay tolls for the use of the fish sheds located at the secondary landing sites. However, it is part of the responsibilities of the shed keeper, an employee of the Fisheries Division, to record fish landings. At present a data collector employed by the Division collects catch and effort data from 13 tertiary sites that are visited on a rotational basis. From the middle of 1993 to the present, the receipt books are delivered directly to the Fisheries Division where the information is immediately computerized and stored in TIP databases. Catch and effort data from the shed keepers and the tertiary landing sites are also recorded in the TIP database.
Vessel information (type, length, engine power etc.) is first recorded by fishing boat inspectors in the field. The information is then transferred to a card filing system. One of the inspectors is charged with the responsibility of inputting the data in the Licensing and Registration System (LRS). The data entry operator also retains copies of the registration database, but the active database is maintained and updated by the vessel inspectorate on a separate computer. By integration of the two databases (from TIP and LRS), a variety of useful information relevant to fisheries management can potentially be obtained for example catch per unit effort data may be obtained for specific vessels, vessel types, vessel size, engine power etc. Catch and effort data extracted from TIP for the period 1994-2000 were analysed during this workshop. For this study the number of flyingfish trips were defined as trips that landed flyingfish or any species usually associated with flyingfish (dolphin and wahoo).
From data recorded in the ledgers maintained at two of the major landing sites, (Oistins and Speightstown) Mahon (1989) separated catches from dayboats and stored these data in a computerized format. To obtain long-term catch trends, these data were combined with dayboat catch records collected over the period 1994-2000 stored in TIP database.
4. STATISTICAL AND ASSESSMENT ANALYSES
4.1 Exploratory analyses
4.1.1 Objectives
The first suite of analyses were conducted on the untransformed data and were simply aimed at summarising the data to (a) assess the content and where possible, the quality of the database and (b) demonstrate spatial, seasonal and annual trends in the fishery.
4.1.2 Methods
For the first suite of descriptive analyses, all data were summarized and analysed using routines from the Microsoft Excel and SPSS software packages. The dataset was analysed separately by fleet types i.e. Iceboats and Dayboats (Launches). The unit of effort used was a single fishing trip. Landings were recorded by trip and hence this was used as a measure of CPUE. All data were summarized in a format that was considered most suitable for the specific parameter. Formats used included tables, simple bar graphs, frequency histograms and line graphs. Note that for these analyses landing records were grouped into fishing seasons rather than calendar years. The fishing season was defined as stretching from October of one year to September of the following year. For example the 1995 season ran from October 1994 to September 1995.
4.1.3 Results
Table 1 summarizes the number of landings recorded at the three types of landing sites in Barbados. The summary illustrates that the number of records increases in the order tertiary site<secondary site<primary site. Table 2 illustrates that the number of recorded landings varied appreciably between seasons. The disparity is mainly attributable to the number of dayboat records rather than iceboat records. This suggests that dayboat landings may be underrepresented in the the data set, especially in the latter seasons. The summarized data in table 3 shows little variation in the mean values of vessel length and HP within the dayboat and iceboat fleets over the 6 seasons. Although the mean CPUE (based on untransformed data) does differ between seasons although no consistent trend is described.
Figure 1 illustrates a slightly bimodal distribution in the number of iceboats records by vessel length. Figure 2 illustrates a normal distribution in the number of dayboat records by dayboat vessel lengths. Figures 3 and 4 use monthly values combined from all 6 seasons, to illustrate the well documented monthly pattern of flyingfish durng the course of a fishing season (note that in the graphs month 1 = October, see methods section). This seasonality is reflected both in terms of number of recorded landings (Fig. 3) and total catch weights (Fig. 4).
4.1.4 Discussion
The marked decline in the number of records of dayboat catches illustrated in these summaries are quite noticeable and should be examined closer. The decline may be real which suggests that fewer dayboat fishers are landing flyingfish or that fewer trips are being recorded. If the former explanation is correct, then the reasons for the decline in the number of landings need to be investigated i.e. is it because fewer fishers are targetting flyingfish or if fewer are being successful. The latter scenario is effectively that effort has remained constant but catch rate has become lower, which is obviously of great concern from the perspective of the status of the stock. However, if the observed trend is because fewer catches are being recorded, then this must be remedied by strengthening the data recording programme.
It is noteworthy that the number of iceboat landings has not changed appreciably over the same period. This may suggest that because iceboats can adjust there fishing effort both in terms of location of fishing and time fishing, that more iceboat trips are succesful. However, as iceboat catches are generally large it is hard for an iceboat to offload his catch unnoticed. In this case, the problem lies in the data recording programme.
The data indicate that the characteristics of the flyingfish vessels (length and horsepower) have remained quite constant over the period. The slight bimodality observed for the iceboat fleet is expected as many of the first set of iceboats entering the fleet in the 1980s had hull lengths of around 40’ (13m), accounting for the peak in frequency of vessels of these lengths observed in the graph. It was only after iceboats started to gain popularity that owners converted there dayboats to include an icebox. Thus a second set of smaller iceboats falling within the range of conventional dayboat sizes was produced which when added to the original large size iceboat fleet produces the distribution observed. The bimodal pattern should however be noted for future analyses of catch and effort data. The observed trends in effort and landings during the season is well documented and requires no furthur explanation.
4.2 Development and standardization of catch per unit effort time series
4.2.1 Objectives
The second suite of analayses were aimed at determining temporal trends in catch per unit effort, standardized for factors that may have affect the relationships.
4.2.2 Methods
The technique of General linear modelling was used to standardize the catch and effort data. Stem and leaf plots were used to determine the distribution of the catch data for each of the fleets. For the GLMs log-transformed CPUE (catch weight/trip) data were used with season, month and vessel length used as the fixed factor variables. The models were run using the GLM subprogramme of SPSS.. It was noticed that due to the large number of trips during which no flying were taken (i.e. flyingfish catch weight = 0), the model was not normally distributed. As GLM require normally distributed data, the records of “0” catches were left out of the GLM.
The historical monthly summaries of dayboat catches at the Oistins and Speightstown markets, collated by Mahon (1990) were combined and mean CPUEs calculated for each month by dividing total flyingfish landings by the number of dayboats landing the catches. The data were regrouped into fishing seasons as previously described. For comparison with this historic dataset, dayboat landings at primary market sites only (Bridgetown Fisheries Complex, Oistins and Speightstown) were extracted from the current 1994-2000 database, summarized by month and CPUEs calculated in the same way as the Mahon series. The two data sets were combined and a GLM was run on the combined dataset. Log transformed CPUEs were used with season and month used as fixed factor variables.
4.2.3 Results
Residual plots for the GLM models for log tranformed CPUE data for dayboats and iceboats are presented in Figures 5 (a) and (b), respectively. The model used fixed factor variables of season, month and vessel length with interactions between vessel length*season and season*month only. Plots of mean seasonal CPUEs (kg/trip) for the dayboat and iceboat fleets are presented in Figures 6 and 7 respectively. The values plotted are antilogs of the linearized log values estimated by the GLMs. Despite the apparent increase in the calculated mean dayboat CPUEs, the overlap of the long confidence bars indicate that little change in dayboat CPUEs may have occurred over the last six fishing seasons. Iceboat CPUEs increased noticeably between the 1996 to 1997 seasons but probably levelled off over the last four seasons (Fig 7).
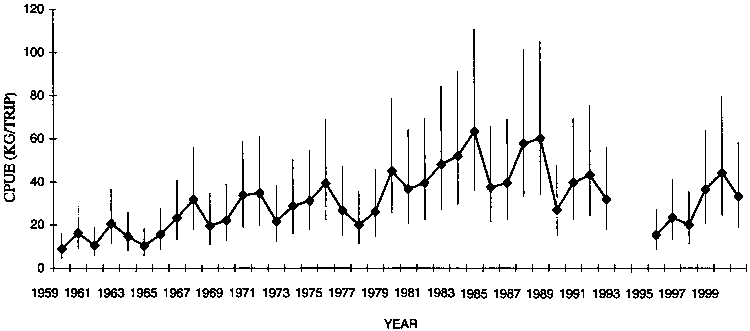
Historical CPUE trends based on summarized monthly data over the 1959 to 2000 fishing seasons are presented in figure 8. Although CPUEs fluctuated considerably over the period a general gradual increase in CPUEs is iluustrated in Figure 8. It is however noteworthy that the values obtained from the most recent dataset (1995-2000) are lower than would be expected based on the increasing trend shown in the previous years.
4.2.4 Discussion
Although GLMs were used to standardize CPUE data in this exercise the CPUEs did not satisfy the criteria of normal distribution. By removing the zero catch values to improve the distribution, the other condition that the samples should be randomly selected was then not satisfied. Future analyses should investigate an alternative GLM in which the error term follows a Poisson Distribution.
However, based on the longer time series (1959-2000) the mean CPUEs for the more recnet data series are genearally lower than the values expected based on the increasing trend shown in the previous years. It seems likely that this is due to differences in the databases although the source of the difference is not immediately clear. However the trend may be realted to a change in landing activities at sites around Barbados, for example the numbers of vessels landing at Speightstown declined from the late 1980s and many vessels moved from many sites around the island to land at the BFC after it commenced operations in 1989. In an effort to capture as much of the landing activities, the recent data set included landings at the BFC. However, a large number of vessels land at this site. It is possible that this range of vessels now includes vessels that traditionally had poorer success rates than the group of vessels landing at Oistins and Speightstown in the past. This would therefore drop the mean CPUE values. The accuracy of recording landings data may also differ between sites accounting for differences in CPUEs when different combinations of sites are used. This long-term dataset is obviously very valuable in assessing long-term trends in the flyingfish fishery, but more work is needed to assess the meaning of the trends suggested by it.
5. RECOMMENDATIONS
The very preliminary assessments of trends in the CPUE of the Barbados flyingfish fishery suggest that despite some inter-annual fluctuations, CPUEs have not shown any consistent downward trends to suggest that the stock is in any immediate danger of collapse. However, given the preliminary nature of these assessments a precautionary approach to increased fishing effort in the region is recommended.
The models used in the analyses must be critically reviewed and models better suited to the dataset used (e.g. a poisson distribution model). While meetings such as this are very useful, much of the analytical work would have to be continued intersessionally with the assistance of a coordinator to ensure that as far as possible, similar methods continue to be used by all countries within the region.
The local landings data collection system in Barbados needs to be carefully reviewed and improved if necessary. For example, the database at present does not allow accurate estimation of the number of truly unsuccesful flyingfish fishing trips. The method used for defining a flyingfish trip for this study i.e. any that landed flyingfish or any species usually associated with flyingfish (dolphin and wahoo) would not have been the most accurate as it would have included those trips during which flyingfish were never targetted. On the other hand no records are kept on the number of truly unsuccesful trips during which no fish are landed. This gap in the database is of serious concerns and data needs to be collected on the number of truly unsuccessful trips. The possible practice of underreporting catches needs to be assessed and rectified if it exists.
Although the number of trips remains the most accessible and therefore most feasible unit of effort for this fishery, the changes in fishing trends over the years (e.g. number of and design of nets, length of time fishing, changes in vessel length and power, fishing range, etc.) all need to be carefully assessed in order to accurately analysis long term time series.
Table 1. Number of recorded landings by site type, month and season
|
Month |
Jan |
Feb |
Mar |
Apr |
May |
Jun |
Jul |
Aug |
Sep |
Oct |
Nov |
Dec |
Total |
|
1995 |
|||||||||||||
|
Primary |
995 |
953 |
961 |
701 |
959 |
741 |
550 |
281 |
243 |
8 |
25 |
87 |
6 504 |
|
Secondary |
630 |
675 |
827 |
625 |
1334 |
1044 |
578 |
162 |
153 |
4 |
1 |
12 |
6 045 |
|
Tertiary |
160 |
126 |
159 |
136 |
177 |
98 |
50 |
5 |
4 |
2 |
0 |
0 |
917 |
|
Total |
1 785 |
1 754 |
1 947 |
1 462 |
2 470 |
1 883 |
1 178 |
448 |
400 |
14 |
26 |
99 |
13 466 |
|
1996 |
|||||||||||||
|
Primary |
1195 |
1348 |
979 |
637 |
918 |
432 |
141 |
16 |
26 |
62 |
507 |
1097 |
7 358 |
|
Secondary |
484 |
762 |
544 |
544 |
816 |
457 |
89 |
7 |
8 |
134 |
163 |
444 |
4 452 |
|
Tertiary |
26 |
8 |
28 |
9 |
15 |
4 |
1 |
1 |
5 |
0 |
0 |
12 |
109 |
|
Total |
1 705 |
2 118 |
1 551 |
1 190 |
1 749 |
893 |
231 |
24 |
39 |
196 |
670 |
1553 |
11 919 |
|
1997 |
|||||||||||||
|
Primary |
745 |
499 |
624 |
457 |
498 |
304 |
86 |
13 |
19 |
22 |
245 |
714 |
4 226 |
|
Secondary |
481 |
278 |
336 |
212 |
437 |
188 |
71 |
5 |
4 |
0 |
61 |
368 |
2 441 |
|
Tertiary |
24 |
2 |
19 |
11 |
9 |
13 |
6 |
0 |
2 |
0 |
42 |
0 |
128 |
|
Total |
1 250 |
779 |
979 |
680 |
944 |
505 |
163 |
18 |
25 |
22 |
348 |
1082 |
6 795 |
|
1998 |
|||||||||||||
|
Primary |
585 |
671 |
759 |
497 |
731 |
473 |
118 |
26 |
42 |
25 |
169 |
356 |
4 452 |
|
Secondary |
327 |
336 |
413 |
279 |
555 |
373 |
21 |
1 |
3 |
11 |
85 |
154 |
2 558 |
|
Tertiary |
4 |
8 |
0 |
13 |
19 |
9 |
2 |
0 |
0 |
0 |
2 |
0 |
57 |
|
Total |
916 |
1 015 |
1 172 |
789 |
1 305 |
855 |
141 |
27 |
45 |
36 |
256 |
510 |
7 067 |
|
1999 |
|||||||||||||
|
Primary |
466 |
502 |
561 |
375 |
374 |
279 |
122 |
1 |
8 |
36 |
130 |
315 |
3 169 |
|
Secondary |
224 |
239 |
408 |
239 |
504 |
324 |
156 |
0 |
0 |
2 |
71 |
200 |
2 367 |
|
Tertiary |
7 |
0 |
16 |
1 |
3 |
29 |
4 |
0 |
0 |
1 |
0 |
3 |
64 |
|
Total |
697 |
741 |
985 |
615 |
881 |
632 |
282 |
1 |
8 |
39 |
201 |
518 |
5 600 |
|
2000 |
|||||||||||||
|
Primary |
332 |
387 |
478 |
358 |
361 |
216 |
106 |
4 |
8 |
15 |
39 |
186 |
2 490 |
|
Secondary |
200 |
282 |
352 |
142 |
331 |
269 |
96 |
2 |
2 |
1 |
7 |
41 |
1 725 |
|
Tertiary |
12 |
8 |
7 |
0 |
12 |
1 |
6 |
0 |
0 |
0 |
0 |
0 |
46 |
|
Total |
544 |
677 |
837 |
500 |
704 |
486 |
208 |
6 |
10 |
16 |
46 |
227 |
4 261 |
Table 2. Number of recorded flyingfish catches for iceboat and dayboat (launch) fleets by season and month
|
SEASON |
1995 |
1996 |
1997 |
1998 |
1999 |
2000 |
||||||||||||
|
MONTH |
ICEBOAT |
LAUNCH |
TOTAL |
ICEBOAT |
LAUNCH |
Total |
ICEBOAT |
LAUNCH |
TOTAL |
ICEBOAT |
LAUNCH |
TOTAL |
ICEBOAT |
LAUNCH |
TOTAL |
ICEBOAT |
LAUNCH |
TOTAL |
|
10 |
9 |
5 |
14 |
21 |
175 |
196 |
16 |
6 |
22 |
15 |
21 |
36 |
31 |
8 |
39 |
12 |
4 |
16 |
|
11 |
15 |
11 |
26 |
104 |
543 |
647 |
100 |
248 |
348 |
90 |
166 |
256 |
98 |
103 |
201 |
26 |
20 |
46 |
|
12 |
77 |
22 |
99 |
252 |
1 267 |
1 519 |
220 |
862 |
1 082 |
153 |
357 |
510 |
185 |
333 |
518 |
136 |
91 |
227 |
|
1 |
202 |
1 583 |
1 785 |
255 |
1 450 |
1 705 |
274 |
976 |
1 250 |
218 |
698 |
916 |
208 |
489 |
697 |
203 |
341 |
544 |
|
2 |
205 |
1 549 |
1 754 |
272 |
1 846 |
2 118 |
228 |
551 |
779 |
233 |
782 |
1 015 |
243 |
498 |
741 |
249 |
428 |
677 |
|
3 |
241 |
1 706 |
1 947 |
288 |
1 263 |
1 551 |
287 |
692 |
979 |
292 |
880 |
1 172 |
304 |
681 |
985 |
272 |
565 |
837 |
|
4 |
211 |
1 251 |
1 462 |
257 |
933 |
1 190 |
249 |
431 |
680 |
273 |
516 |
789 |
244 |
371 |
615 |
225 |
275 |
500 |
|
5 |
248 |
2 222 |
2 470 |
278 |
1 471 |
1 749 |
258 |
686 |
944 |
296 |
1 009 |
1 305 |
236 |
645 |
881 |
238 |
466 |
704 |
|
6 |
230 |
1 653 |
1 883 |
214 |
679 |
893 |
197 |
308 |
505 |
261 |
594 |
855 |
179 |
453 |
632 |
171 |
315 |
486 |
|
7 |
142 |
1 036 |
1 178 |
77 |
154 |
231 |
74 |
89 |
163 |
66 |
75 |
141 |
95 |
187 |
282 |
87 |
121 |
208 |
|
8 |
64 |
384 |
448 |
8 |
16 |
24 |
10 |
8 |
18 |
21 |
6 |
27 |
1 |
0 |
1 |
3 |
3 |
6 |
|
9 |
75 |
325 |
400 |
14 |
25 |
39 |
12 |
13 |
25 |
37 |
8 |
45 |
5 |
3 |
8 |
4 |
6 |
10 |
|
TOTAL |
1 719 |
11 747 |
13 466 |
2 040 |
9 822 |
11 862 |
1 925 |
4 870 |
6 795 |
1 955 |
5 112 |
7 067 |
1 829 |
3 771 |
5 600 |
1 626 |
2 635 |
4 261 |
|
OVERALL TOTAL (ALL SEASONS) |
11 094 |
37 957 |
49 051 |
|||||||||||||||
Table 3. Average vessel characteristics of iceboat and dayboat (launch) fleets and CPUE
|
SEASON |
PARAMETER |
ICEBOAT |
LAUNCH |
|
1995 |
MEAN LOA (M) |
11.2 |
8.5 |
|
MEAN HP |
153.1 |
56.5 |
|
|
MEAN CPUE (KG/TRIP) |
368.1 |
52.4 |
|
|
1996 |
MEAN LOA (M) |
11.1 |
8.5 |
|
MEAN HP |
153.6 |
55.5 |
|
|
MEAN CPUE (KG/TRIP) |
478.0 |
67.5 |
|
|
1997 |
MEAN LOA (M) |
11.2 |
8.5 |
|
MEAN HP |
158.6 |
59.2 |
|
|
MEAN CPUE (KG/TRIP) |
567.5 |
71.5 |
|
|
1998 |
MEAN LOA (M) |
11.0 |
8.4 |
|
MEAN HP |
156.0 |
62.9 |
|
|
MEAN CPUE (KG/TRIP) |
709.2 |
100.0 |
|
|
1999 |
MEAN LOA (M) |
11.2 |
8.2 |
|
MEAN HP |
1.70 |
67.2 |
|
|
MEAN CPUE (KG/TRIP) |
661.8 |
94.7 |
|
|
2000 |
MEAN LOA (M) |
11.3 |
8.5 |
|
MEAN HP |
192.7 |
71.5 |
|
|
MEAN CPUE (KG/TRIP) |
645.8 |
100.3 |
|
|
OVERALL MEAN LOA (M) |
11.2 |
8.5 |
|
|
OVERALL MEAN HP |
163.3 |
59.6 |
|
|
OVERALL MEAN CPUE(KG/TRIP) |
572.1 |
72.7 |
|
Figure 1. Frequency histogram of recorded catches by vessel length (m) for iceboats
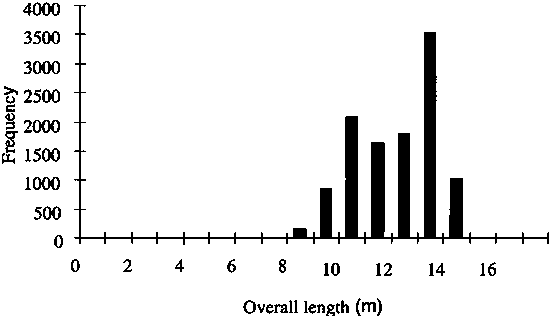
Figure 2. Frequency histogram of recorded landings by vessel length (m) for dayboats (launches)
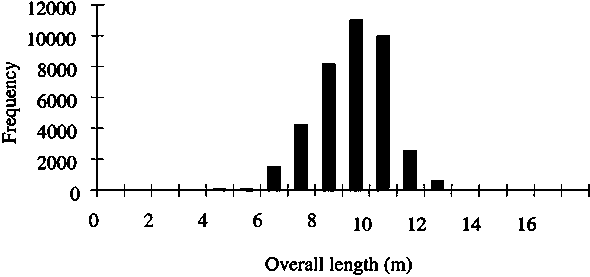
Figure 3. Number of Records by Month (all seasons)
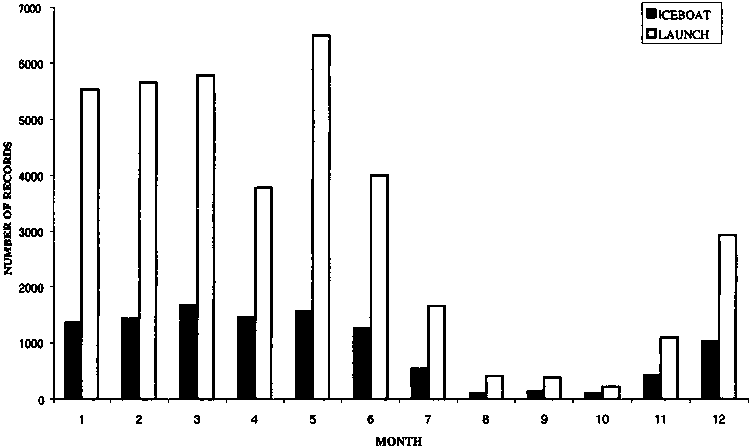
Figure 4. Total Recorded Weight by Month (all seasons)
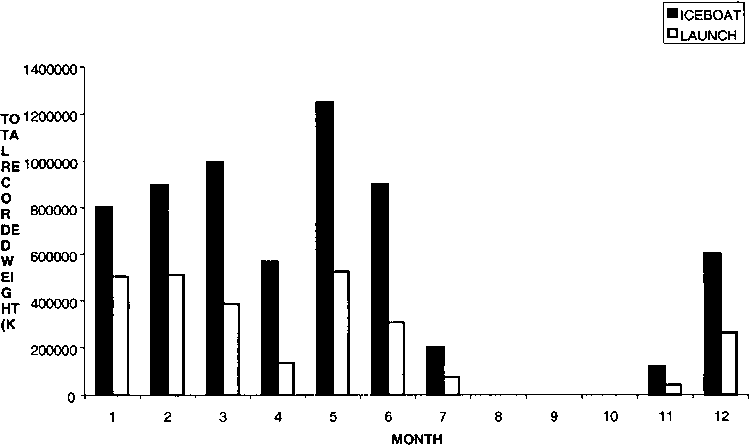
Figure 5 (a). Residuals plots for GLM model of log transformed catch per unit effort data for dayboats. Fixed factor variables included in the model are season, month and vessel length.
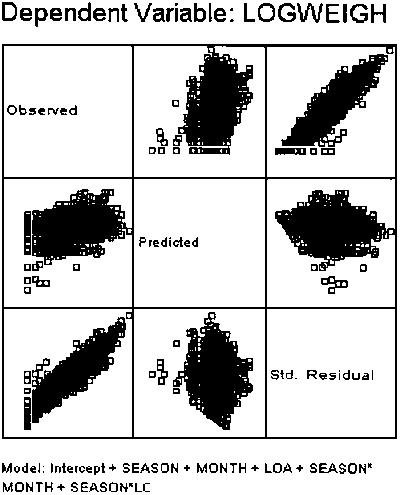
Figure 5 (b). Residuals plots for GLM model of log transformed catch per unit effort data for iceboats. Fixed factor variables included in the model are season, month and vessel length.
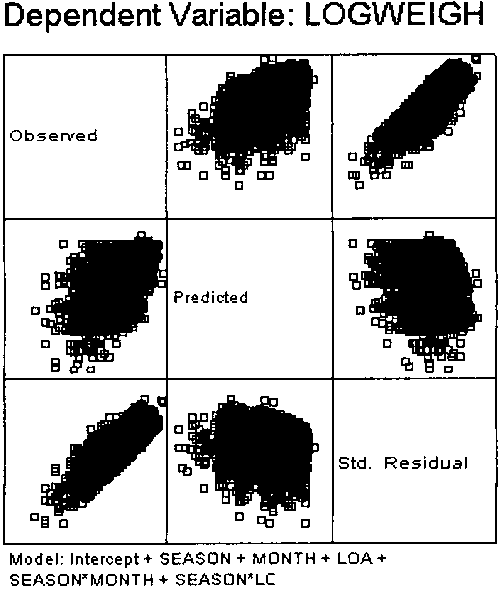
Figure 6. Standardised seasonal mean CPUE (kg/trip) for dayboats.
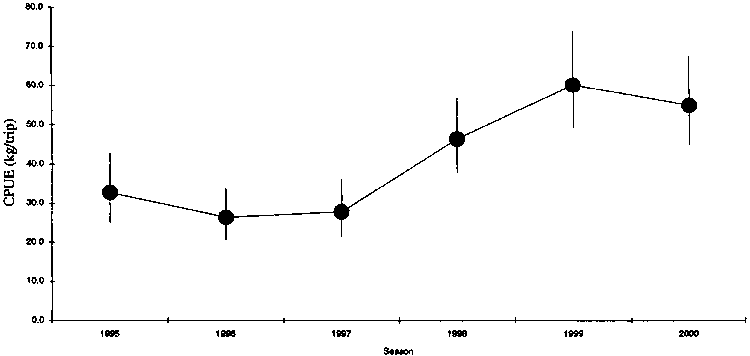
Figure 7. Standardised seasonal mean CPUE (kg/trip) for iceboats.
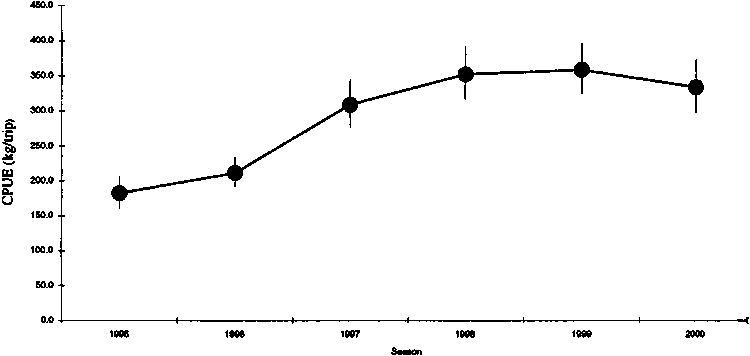
Figure 8. Standardised cpue (kg/trip) for dayboats landing at market sites in Barbados (1959-2000)
|
[6] FAO. 1999. Report of the
First Meeting of the WECAFC Flyingfish Ad Hoc Working Group of the Eastern
Caribbean. Bridgetown, Barbados, 22-24 September 1999. |