


In 2001, Thailand GDP expanded by 1.5 percent, lower than 4.4 percent in 2000 (Source: National Economic and Social Development Board). The world economy slowdown, led by the United States, European Union and Japan, had limited the economic growth of the country.
In 2002, the economy in Thailand is expected to grow by 2 percent. Details by sector are shown below.
Table 1: Outlook by sector in Thailand
Preliminary |
Estimate | |||
1999 |
2000 |
2001 |
2002 | |
GDP (Current prices: billion baht) |
4 615 |
4 900 |
5 057 |
5 259 |
GDP growth rate (1988 price, %) |
4.2 |
4.4 |
1.5 |
2.0 |
Investment (1988 price, %) |
-4.0 |
5.4 |
1.8 |
3.3 |
- Private (1988 price, %) |
-5.0 |
14.6 |
3.0 |
3.5 |
- Public (1988 price, %) |
-2.8 |
-6.1 |
0.0 |
3.0 |
Consumption (1988 price, %) |
3.5 |
4.7 |
2.4 |
3.8 |
- Private (1988 price, %) |
4.0 |
4.3 |
2.5 |
3.0 |
- Public (1988 price, %) |
0.9 |
6.5 |
2.0 |
8.0 |
Export value (billions of US$) |
56.8 |
67.9 |
63.4 |
64.3 |
- Growth rate (%) |
7.4 |
19.6 |
-6.7 |
1.5 |
Import value (billions of US$) |
47.5 |
62.4 |
61.3 |
63.5 |
- Growth rate (%) |
17.0 |
31.4 |
-1.8 |
3.7 |
Inflation (%) |
||||
- Consumer price index |
0.3 |
1.6 |
1.7 |
2.0 |
Source: National Economic and Social Development Board (NESDB), 17 December 2001
Total pulp and paper capacity reached 4 634 450 tonnes: 958 000 tonnes for pulp and 3 676 450 tonnes for paper. These figures have increased by 1 percent from 2000 mainly due to machine modifications and de-bottlenecking programmes. The industry utilization rate moderately improved from last year by 5 percent to 72 percent.
Throughout 2001, the overall consumption of pulp and paper grew by 5 percent, the same level as 2000. Total consumption was 2 920 000 tonnes consisting of 896 000 tonnes for pulp and 2 024 000 tonnes for paper.
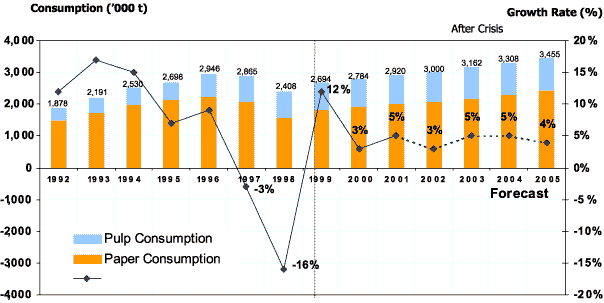
Chart 1: Pulp and paper consumption during 1992-2005
In 2001, import of pulp and paper products decreased by 8 percent, mostly from short fibre and printing and writing paper. Export volume for pulp and paper products went up to 1 114 430 tonnes, a 9 percent increase from the previous year. Total export revenues contributed more than 32 billion baht to the country.
In Thailand, only short fibre pulp can be produced whereas long fibre pulp is imported. Total production capacity for short fibre pulp remained at the same level as of last year, while the use rate substantially improved by 16 percent to 96 percent. The major five pulp producers with capacity are shown in Chart 2.
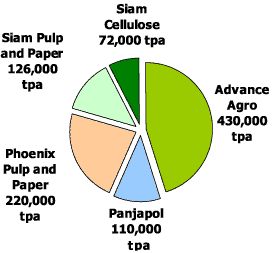
Total Capacity 958 000 t per annum
Chart 2: Major pulp producers with capacity in 2001
For waste-based material in Thailand, total collection of various kinds of used paper was 818 500 tonnes, a 5 percent increase from last year. The recovery was improved to 46 percent, compared to 45 percent in 2000.
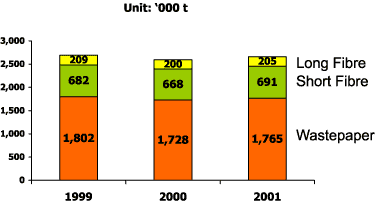
Total domestic fibre consumption was 2 661 000 tonnes, an increase of 65 000 tonnes or 2 percent over 2000. The waste-based material requirement accounted for the biggest portion of approximately 1 765 000 tonnes or 66 percent in proportion. The consumption for short fibre and long fibre were 26 percent and 8 percent respectively (see Chart 3).
In 2001, the short fibre pulp consumption increased by 3 percent from 2000 to 691 000 tonnes, resulted from the growing in paper production level. To fully utilize the mills, the major producers had to export the surplus capacity of 346 930 tonnes, mainly to China, Australia, Republic of Korea and China Taiwan.
In terms of long fibre pulp, demand was 205 000 tonnes, a 2 percent increase from last year. Total long fibre pulp consumption was 100 percent imported, mainly from Canada, Chile, United States and South Africa.
Unit: `000 t
Throughout 2001, 947 500 tonnes of wastepaper was imported, mainly from United States and Japan. Old corrugated containers (OCC), the popular grades, accounted for 75 percent while old newsprint paper (ONP) was 15 percent.
Long Fibre
Short Fibre
Wastepaper
Chart 3: Domestic fibre consumption during 1999-2001
Major event: In November 2001, The Siam Pulp and Paper Public Company Limited (SPPC) purchased a 24.98 percent stake in Phoenix Pulp and Paper Public Company Limited (PPPC) from Janpath Investments and Holdings Ltd, subsidiaries of Ballarpur Industries Group. In early 2002, SPPC also completed the tender offer process with another 36.28 percent share in PPPC, making SPPC a major shareholder with a 61.26 percent stake.
Domestic pulp demand in the next four years is expected to grow by 4 percent per annum from 896 000 tonnes in 2001 to 1 043 000 tonnes in 2005 as a result of the continuously rising demand in the paper industry.
In line with the expected growth in pulp demand, there is a new entry namely "Thai Pulp Paper Industry Co., Ltd" which is expected to come on-stream by July 2003 for 100 000 tonnes per annum of short fibre pulp. Phoenix Pulp and Paper Public Company Limited, however, has delayed a capacity expansion of another 250 000 tonnes per annum to be due for a start-up in 2004 instead of the previously scheduled date of 2003.
The demand and capacity of pulp industry in Thailand would be expected as follows:
Table 2: Demand and capacity of Pulp Industry in Thailand (thousand t)
2000 |
2001 |
2002* |
2003* |
2004* |
2005* | |
Demand |
|
|
|
|
|
|
Capacity |
|
|
|
|
|
|
Surplus
(shortage) |
|
|
|
|
|
|
* estimated
In 2001, total capacity of paper was 3 676 450 tonnes, a 1 percent increase over the previous year due to modifications and de-bottlenecking programmes. The utilization rate improved slightly by 3 percent to the level of 66 percent.
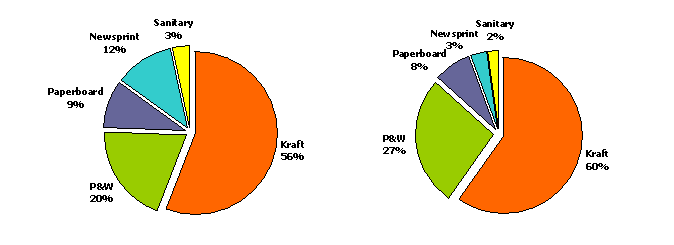
A combined paper capacity of 3 676 450 tonnes could be categorized into 2 199 450 tonnes for kraft paper, 987 000 tonnes for printing and writing paper, 283 000 tonnes for paperboard, 126 000 tonnes for newsprint paper and 81 000 tonnes for household and sanitary paper (see Chart 4).
Domestic Paper Capacity 2001: 3 676 450 t Domestic Consumption 2001: 2 024 000 t
![]()
Total paper demand in 2001 was up to 2 024 000 tonnes, a 6 percent increase from the previous year. This demand growth mainly came from printing and writing paper and household and sanitary paper with 11 percent and 14 percent increase, respectively, while kraft paper, paperboard and newsprint paper grew slightly by 2-4 percent. The domestic paper consumption by grade is shown in Chart 5.
For printing and writing paper, the demand growth in 2001 increased by 11 percent from 363 000 tonnes up to 402 000 tonnes, driven by new publications (both magazines and books), more direct-advertising printing materials by discounted stores/banks and rising export orders from local printing houses. This positively demonstrates that our paper and printing products meet the world standard and quality.
Household and sanitary paper demand rose 14 percent from 57 200 tonnes to 65 000 tonnes.
For kraft paper, domestic demand increased by 4 percent from 1 081 000 tonnes up to 1 129 000 tonnes, while paperboard demand grew by 2 percent from last year, mainly due to a slowing carton demand in electrical parts and electrical appliances.
Newsprint paper consumption slightly increased by 4 percent from 227 000 to 236 000 tonnes due to both additional pages of advertising through newspaper and higher circulation.
In 2001, import of paper decreased by 6 percent from the previous year. The biggest import grade was newsprint paper, mainly due to a shortage in supply. The major paper exporters to Thailand were Japan, United States, Singapore and Indonesia. The import statistics during 1998-2001 by grade are presented in Chart 6.
Unit: '000 t
Unit: `000 t
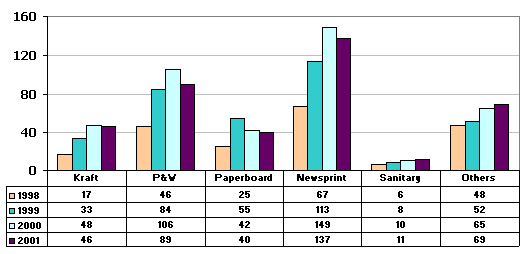
Chart 6: Import statistics of paper during 1998-2001
Major paper and board exporters to Thailand were ranked by import value in the following table.
Table 3: Import value of paper products by country in 2001
Ranking |
Country |
Import value |
1 |
Japan |
5 315 |
2 |
United States |
3 075 |
3 |
Singapore |
3 002 |
4 |
Indonesia |
1 699 |
5 |
China Taiwan |
1 377 |
6 |
Sweden |
914 |
7 |
Germany |
897 |
8 |
China Hong Kong |
862 |
9 |
China |
809 |
10 |
Rep. of Korea |
620 |
11 |
Others |
5 380 |
Total import value |
23 950 | |
Source: The Customs of Thailand. Remark: Total import value included import value of finished product made from paper.
Export of paper and board in 2001 was 767 490 tonnes, slightly decreased by 1 percent from last year, partly due to the recovery in domestic demand. The principal export grades were kraft paper and printing and writing paper at 45 percent and 42 percent, respectively (see Chart 7).
Unit: '000 t
Chart 7: Export statistics of paper during 1998-2001
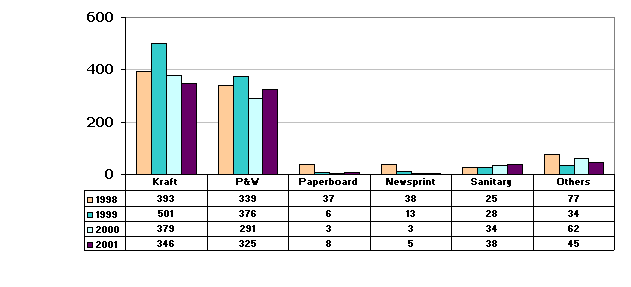
The main export markets ranked by export value were in Asia-Pacific regions such as China, China Hong Kong and China Taiwan as shown in the table below.
Table 4: Export value of paper products by country in 2001
Ranking |
Country |
Export value |
1 |
China |
3 308 |
2 |
China Hong Kong |
3 118 |
3 |
China Taiwan |
3 068 |
4 |
Malaysia |
2 702 |
5 |
Singapore |
1 878 |
6 |
Belgium |
1 658 |
7 |
Australia |
1 555 |
8 |
Philippines |
1 496 |
9 |
Japan |
1 353 |
10 |
United States |
1 305 |
11 |
Others |
5 612 |
Total export value |
27 053 | |
Source: The Customs of Thailand
Remark: Total export value included export value of finished product made from paper
Domestic paper consumption is expected to grow by 5 percent, reaching 2 412 400 tonnes by 2005. Despite the continued oversupply situation, Asia Kraft Paper Co., Ltd has announced a new expansion capacity of another 150 000 tonnes per annum for kraft paper, planned to start up in February 2003 (source: PPI Asia News; 8 May 2001). In addition, small volumes yearly increases could be achieved in all grades through de-bottlenecking programmes.
The paper consumption by grade in the next four years is projected as below.
Table 5: 2002-2005 projected consumption and capacity of paper in Thailand (thousand tonnes)
2000 |
2001 |
2002* |
2003* |
2004* |
2005* | ||
Kraft Paper |
Consumption |
1 081 |
1 129 |
1 151 |
1 208 |
1 269 |
1 332 |
Capacity |
2 197 |
2 199 |
2 218 |
2 413 |
2 525 |
2 525 | |
Surplus (shortage) |
1 116 |
1 070 |
1 067 |
1 205 |
1 256 |
1 193 | |
Printing and writing paper |
Consumption |
363 |
402 |
414 |
436 |
463 |
493 |
Capacity |
983 |
987 |
1 020 |
1 080 |
1 110 |
1 110 | |
Surplus (shortage) |
620 |
585 |
606 |
644 |
647 |
617 | |
Paperboard |
Consumption |
188 |
192 |
196 |
206 |
217 |
227 |
Capacity |
254 |
283 |
293 |
293 |
293 |
293 | |
Surplus (shortage) |
66 |
91 |
97 |
87 |
76 |
66 | |
Newsprint paper |
Consumption |
227 |
236 |
245 |
255 |
265 |
275 |
Capacity |
122 |
126 |
126 |
130 |
130 |
130 | |
Surplus (shortage) |
(105) |
(110) |
(119) |
(125) |
(135) |
(145) | |
Household and sanitary paper |
Consumption |
57 |
65 |
70 |
75 |
80 |
85 |
Capacity |
80 |
81 |
88 |
88 |
100 |
100 | |
Surplus (shortage) |
23 |
16 |
18 |
13 |
20 |
15 | |
Total paper and board |
Consumption |
1 916 |
2 024 |
2 076 |
2 180 |
2 294 |
2 412 |
Capacity |
3 637 |
3 676 |
3 746 |
4 005 |
4 159 |
4 159 | |
Surplus (shortage) |
1 721 |
1 652 |
1 670 |
1 824 |
1 865 |
1 746 | |
Population |
(million man) |
61.9 |
62.3 |
63.0 |
63.5 |
64.0 |
64.5 |
Per capita consumption |
(kg./head) |
30.9 |
32.5 |
33.0 |
34.3 |
35.8 |
37.4 |
* estimated