


Adrian C. Newton and Valerie Kapos
are respectively
programme head and
advisor in the Forests Drylands and
Freshwaters
Programme of the United
Nations Environment Programme's
World
Conservation Monitoring Centre
(UNEP-WCMC), Cambridge,
United Kingdom.
Simplified variables - biodiversity indicators - can be used to draw information on status and trends in forest biodiversity from standard forest inventory data.
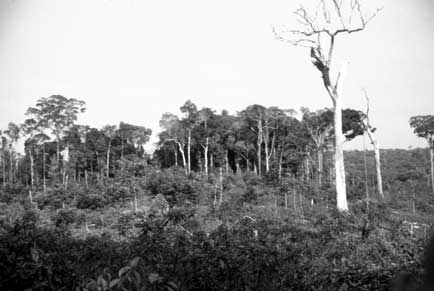
Forest fragmentation - as shown here in central Amazonia - has major effects on the biodiversity of forest ecosystems and can serve as one useful indicator of forest biodiversity status
- V. KAPOS
Assessments of forest biodiversity - the diversity within forest spe- cies, between species and of forest ecosystems - are essential if forest resources are to be effectively conserved and sustainably managed (Hunter, 1999). Assessments are needed to provide information necessary to support biodiversity-related decision-making in forest policy and management. However, assessment of forest biodiversity presents a number of challenges. First, because of the complexity of biodiversity, information about it needs to be assembled and expressed based on simplified variables, typically in the form of indicators (Noss, 1990, 1999). Second, since decisions relating to forests are made at a variety of scales, biodiversity data and indicators need to be aggregated across different scales for monitoring and reporting purposes (Noss, 1990; Turner, 1995).
The Global Forest Resources Assessment 2000 (FRA 2000) incorporated some key indicators intended to contribute towards a better understanding of the status and trends in forest biological diversity, specifically relating to the naturalness, protection status and fragmentation of forest ecosystems. In addition to estimates of forest area and changes in forest cover, FRA 2000 provided statistics on the proportion of forest area incorporated within protected areas, the distribution of forest area by ecological zone and the number of endemic and threatened species for seven species groups. This information provides a useful basis for monitoring future changes in the status of forest ecosystems and associated biodiversity. However, the conclusions to the assessment highlighted the need to monitor not only forest quantity, but also forest quality, and suggested that future action focus on the further development, testing and implementation of indicators related to commonly agreed criteria for sustainable forest management (FAO, 2001c).
This article explores how future global forest assessments might provide more detailed information on status and trends in forest biodiversity, specifically through the use of indicators. Such indicators should be appropriate for use at the local scale, but should provide information that can be readily aggregated at larger scales (FAO, 2001c). To ensure that future assessments are practicable, they should, as far as possible, employ indicators of biodiversity that can be drawn from data collected by standard forest inventories. In addition, the proposed indicators should build on the many international initiatives that have attempted to develop forest biodiversity indicators in recent years. The article first provides an overview of these initiatives, with reference to their policy context. It then considers the various frameworks proposed for indicator development and selection. Finally, it examines the application of forest inventory data to such indicators.
The United Nations Conference on Environment and Development (UNCED) in 1992 recognized the need to develop indicators to enable countries to make informed decisions regarding sustainable development (Chapter 40 of Agenda 21). During the decade following UNCED, many initiatives, including an initiative of the UN Commission on Sustainable Development (CSD), have sought to identify indicators of sustainable development. Relatively few of the indicators presented by CSD relate explicitly to forest biodiversity, but relevant ones include forest area as percentage of land area, area of selected key ecosystems and protected area as percentage of total area (CSD, 2001).
The Convention on Biological Diversity (CBD) provides a more explicit policy context for indicators of biodiversity. Article 7 of the convention requires parties to identify and monitor "components of biological diversity important for its conservation and sustainable use" and to identify processes or activities likely to have adverse effects on biodiversity. The text of the convention also recognizes the role of indicators in assisting parties with monitoring the status of biodiversity and the effects of measures taken for its conservation and sustainable use. To date, CBD has sought to encourage parties and governments to identify appropriate biodiversity indicators for use in managing biological diversity at the local and national levels and in assessing implementation of the convention, and to increase regional cooperation and capacity-building for the development and use of such indicators (CBD, 2001). Decisions of the Conferences of the Parties have emphasized the need to adopt an ecosystem approach in indicator development. Proposals have also been made for a core set of biodiversity indicators suitable for use by parties in compiling their national reports and in evaluating the effectiveness of measures taken (CBD, 1997a). Indicators specifically relating to forest biodiversity have also been proposed (CBD, 1997b).
Chapter 11 of Agenda 21 and the so-called "Forest Principles" call for the identification of criteria and indicators for evaluating progress in national efforts to practice sustainable forest management. As a result, a large number of national, regional and international initiatives have been developed, including the International Tropical Timber Organization (ITTO), Pan-European (or "Helsinki"), Montreal, Tarapoto, Lepaterique, Near East, Dry Zone Asia and Dry Zone Africa processes, which have each generated sets of criteria and indicators (Grayson and Maynard, 1997; FAO, 2001a). Currently, about 150 countries are participating in these processes (FAO, 2001b). While the different processes share similar objectives and overall approach, they differ in structure and specific content (FAO, 2001b). However, all of the ten major processes have identified the conservation of forest biological diversity among the criteria for sustainability, and many of the numerous indicators that relate specifically to the biodiversity criterion are common to more than one process (CBD, 1997b).
A series of field evaluations of criteria and indicators undertaken by the Center for International Forestry Research (CIFOR) in a number of different countries indicated that most, if not all, of the proposed criteria and indicators relating to biodiversity for use at the local level were in some sense deficient (Prabhu et al., 1996). In particular, most of the criteria and indicators addressed compliance with good forest stewardship rather than direct assessment of the impacts of forest management on biodiversity. The study acknowledged that such direct assessment is costly, is limited by data availability and is rarely part of forest management practices. It also recognized the importance of establishing clear links between forest management and biodiversity maintenance before indicators based on management processes can be accepted as appropriate proxies for measurement of management impacts on biodiversity. In response, CIFOR proposed a preliminary list of indicators that could be used to evaluate these impacts, together with a practical framework for applying biodiversity criteria and indicators in field situations (Stork et al., 1997).
In order for meaningful indicators to be developed, some form of framework or conceptual model is required (Holdgate, 1996) that makes explicit both definitions and the relationships among the phenomena of interest and the indicators. The most widely used is the "pressure-state-response" (PSR) framework, which was developed by the Organisation for Economic Co-operation and Development (OECD, 1993) on the basis of the "stress-response" model developed by Friend and Rapport (1979). The PSR framework states that human activities (such as clearance of forest for agriculture) exert pressures on the environment, which can induce changes in the state of the environment (for example, the extent of forest cover). Society may then respond to changes in pressures or state with policies and programmes intended to prevent, reduce or mitigate pressures and thereby reduce environmental damage. Indicators provide tools for elucidating PSR relationships, both at the reporting stage and during policy analysis.
The PSR framework has been widely applied to indicator development; for example, it is explicitly recognized by CBD (CBD, 1997a). CSD has used a variant of this approach, namely the "driving force-state-response" (DSR) framework (CSD, 2001). This framework uses the term "driving force" instead of "pressure" to accommodate social, economic and institutional indicators more accurately and to acknowledge that their impact on sustainable development may be both positive and negative. The European Environment Agency (EEA, 1998) further expanded the PSR scheme to include drivers and impacts, forming the DPSIR framework.
A number of other indicator frameworks have been proposed. Hyman and Leibowitz (2001) suggested that a conceptual model based on ecological principles could make it possible to evaluate the relationships between proposed indicators and assessment "endpoints", such as biodiversity. Noss (1990) presents a hierarchical framework for development of biodiversity indicators, recognizing that three attributes of biodiversity - composition, structure and function - can be considered at a number of different scales or levels of organization. The framework of Stork et al. (1997) is based on a conceptual model of the relationship between anthropogenic activities affecting forests and the processes that influence biodiversity.
Research in this area has been characterized by a high degree of confusion in the terminology adopted and uncertainty about which methods are the most appropriate. For example, the terms "framework" and "conceptual model" are often used interchangeably. The authors support the suggestion of Boyle (1998) that a conceptual model and a framework are both required for indicator development, the former to define the relationship between the indicator and the endpoint, and the latter to categorize the variables and define which are appropriate for assessment.
The many approaches for assessing biodiversity (Groombridge and Jenkins, 1996; Jermy et al., 1995; Heywood, 1995; Beattie, Majer and Oliver, 1993) vary with respect to sampling intensity and requirement for taxonomic expertise, and therefore cost. Where the aim is explicitly to address changes over time, methods are required that are repeatable and that can provide comparable results between sampling events. As resources are often limiting, approaches need to be as efficient and cost effective as possible so that they can be sustained over time.
Biodiversity assessments should be integrated with inventories of other variables carried out to provide the information required for future global forest assessments (which will address other characteristics such as biophysical status and development of forests, forest use and benefits derived from forests) (FAO, 2001c). Biodiversity assessment should also be undertaken in a manner that ensures accordance with the criteria and indicators processes with which a particular country is affiliated, together with international reporting obligations such as those of CBD and CSD.
Forest inventories and biodiversity survey methodologies are similar in many ways, but also have a number of differences (Vanclay, 1998). Methods of forest inventory have principally been developed for estimating the standing volume of wood in forests and for monitoring changes in stand structure and growth with time. They do not generally incorporate measures of other ecosystem components such as animals or non-woody plants (Burley and Gauld, 1995). Quantitative data on forest structure from forest inventories usually take the form of listings of individual trees with diameter (and sometimes height) measurements, or of total numbers of trees in each diameter class. Unfortunately, many traditional forest inventories focus so strongly on the potential for timber harvest that they provide little or no information on the smaller trees or their spatial distribution.
In recent years, there has been an increasing effort to establish temporary and/or permanent sample plots explicitly for the purposes of biodiversity assessment in forests. For example, in 1986, the United Nations Educational, Scientific and Cultural Organization (UNESCO) Man and the Biosphere Programme (MAB) and the Smithsonian Institution began a joint initiative to establish a global network of forest areas under different management regimes, together with protocols for biodiversity monitoring. These protocols have been adopted at nearly 200 research sites in 23 countries (Dallmeier and Comiskey, 1998).
In many countries, however, forest inventories are inadequate or entirely lacking. In addition, a study by Kapos and Jenkins (2002) indicated that existing forest inventories, surveys or networks of permanent plots are often inadequate to provide a representative assessment of forest biodiversity. Biodiversity assessment will therefore often require the design and implementation of an appropriate inventory system. The following section suggests how such an inventory might be designed and implemented in practice, focusing on the use of biodiversity indicators proposed by existing criteria and indicators processes in conjunction with standard forest inventory approaches.
Most of the forest biodiversity indicators that have been proposed to date have been developed for the national level and are not appropriate for use at the forest management unit (FMU) level (Stork et al., 1997). Although national-level indicators are required for the development and updating of national and international policy instruments (Castañeda, 2001), some important changes in biodiversity can only be detected at the local scale. Data collected within the FMU can potentially be aggregated or extrapolated to a larger scale to assist with reporting at the national or regional level (Raison, Flinn and Brown, 2001). Trends in indicators observed at the FMU level could be used to adjust forest management approaches to ensure that national goals are met.

Estimates of the total numbers and conservation status of forest-dependent species - like this Amazonian sloth - are important indicators of forest biodiversity
- V. KAPOS
The selection of indicators for use in any particular assessment will depend on the precise objectives of the assessment (which must be clearly defined) and on the framework for indicator development that has been adopted. In addition, the relationship between selected indicators and endpoints should be analysed using appropriate statistical approaches (Hyman and Leibowitz, 2001). Many indicators of forest biodiversity have been poorly tested and require rigorous validation in order to be interpreted with confidence (Noss, 1999).
Existing and proposed biodiversity indicators that are appropriate for implementation at the FMU level can be divided into eight general groups:
Indicators of genetic variation are not considered here, as they generally require sophisticated laboratory-based analyses (Namkoong et al., 1996; but see Jennings et al., 2001).
Some indicators, such as area of different forest types and protected forest area, are common to all of the criteria and indicator processes and international reporting obligations (see Table). They tend to require both spatial data on forest cover and ground-based inventory data, which help to define forest types. These data can then be combined with mapped data on protected areas and their management status (Iremonger, Ravilious and Quinton, 1997).
Most processes also include indicators relating to forest composition, principally in terms of species richness and the presence of species of particular conservation concern (threatened or endemic species). These indicators clearly require data from forest inventory and other survey types to generate species lists, which can be cross-referenced to national and international assessments of species status such as Red Lists and the appendices to the Convention on International Trade in Endangered Species of Wild Fauna and Flora (CITES) (e.g. Dallmeier and Comiskey, 1998b; Vanclay, 1998; Hawthorne and Juam Musah, 1993).
Other indicators, such as forest fragmentation and rate of forest conversion, are less commonly included, while forest structure and area affected by disturbance are recognized by few of the processes. Indicators relating to forest fragmentation require spatial data on forest cover at the landscape scale and can include measures of the size, shape and connectivity of forest patches, or indices that combine these attributes (e.g. Kapos, Lysenko and Lesslie, 2000).
Structural characteristics of forest stands are relatively easy to assess (Ferris-Kaan, Peace and Humphrey, 1998; Boyle and Sayer, 1995) and are of fundamental importance for biodiversity (Noss, 1990, 1999; Ferris and Humphrey, 1999). Forest stands tend to be structurally heterogeneous, both vertically and horizontally; structural complexity may determine habitat availability and may thus influence diversity of plant, animal and microbial communities (Ferris and Humphrey, 1999). Measures of forest structure that can contribute to indicators include canopy cover, vertical structure of the canopy and size or age distribution of trees.
The incidence and intensity of both natural and anthropogenic disturbance can profoundly influence forest structure and composition, and therefore affect the availability of habitat for different groups of organisms. Disturbances may be caused by small-scale processes such as the senescence and death of individual trees, or large-scale processes such as hurricanes or fire. Assessing disturbance can be difficult, however; indicators of disturbance may need to be developed or adapted at the local level according to the characteristics of the site (Ramírez-Marcial, González-Espinosa and Williams-Linera, 2001).
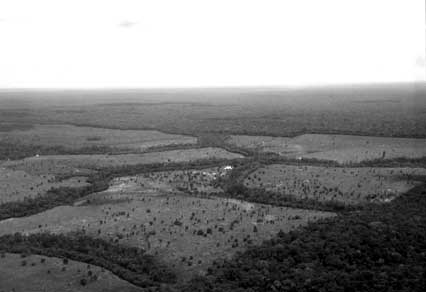
Indicators relating to forest fragmentation require spatial data on forest cover at the landscape scale and can include measures of the size, shape and connectivity of forest patches
- V. KAPOS
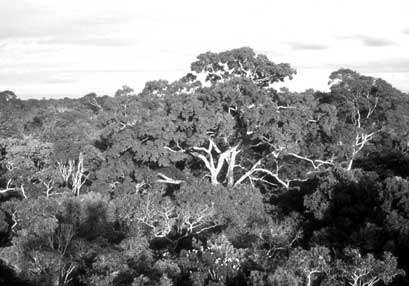
Measures of forest structure that can contribute to biodiversity indicators include canopy cover, vertical structure of the canopy and size or age distribution of trees (shown, central Amazonia)
- V. KAPOS
Inclusion of biodiversity indicators in sets of indicators developed by international criteria and indicators processes, international organizations and the Convention on Biological Diversity
|
General biodiversity indicator |
Montreal |
Pan-European |
Tarapoto |
Dry Zone Africa |
Dry Forest Asia |
Lepaterique |
Near East |
African Timber Organization |
ITTO |
CIFOR |
CSD |
CBDa |
| Forest area by type, and successional stage relative to land area |
x |
x |
x |
x |
x |
x |
x |
|
x |
x |
x |
x |
| Protected forest area by type, successional stage and protection category relative to total forest area |
x |
x |
x |
x |
x |
x |
x |
x |
x |
x |
x |
x |
| Degree of fragmentation of forest types |
x |
|
|
x |
|
x |
|
|
x |
x |
|
x |
| Rate of conversion of forest cover (by type) to other uses |
x |
x |
|
x |
|
|
|
x |
|
x | ||
| Area and percentage of forests affected by anthropogenic and natural disturbance. |
x |
|
|
x |
|
|
|
x |
|
x | ||
| Complexity and heterogeneity of forest structure |
x |
|
|
|
|
x |
|
x |
||||
| Numbers of forest-dependent species |
x |
x |
|
x |
x |
x |
x |
|
|
x |
x |
x |
| Conservation status of forest-dependent species |
x |
x |
|
x |
x |
x |
x |
x |
x |
x |
|
x |
a Refers to a provisional list of forest biodiversity indicators, published but not officially endorsed (CBD, 1997b).
The data required for the biodiversity indicators considered here can largely be provided through traditional forest inventory approaches, supported by the application of remote sensing and geographic information system (GIS) technologies. In some cases, additional field survey techniques may be needed to inventory taxa not usually included in forest inventory. Careful attention needs to be paid to sampling design, stratification and survey methods both within forest inventory and in supplementary studies (Dallmeier and Comiskey, 1998a; Bachmann, Köhl and Païvinen, 1998; Boyle and Boontawee, 1995; Vanclay, 1998). Remote-sensing images can provide a basis for stratifying field sampling efforts as well as for mapping distributions of species that are closely associated with distinctive vegetation types. Although it may provide indications of ecosystem-level diversity as indicated by spatial distribution of different vegetation types, remote sensing cannot yet provide direct information on species-level diversity (Tanner, Kapos and Adams, 1998). Remote sensing and GIS can be used both to generate spatial data, for example on forest cover distribution, and to extrapolate the results of intensive ground studies. GIS can also be used to combine data from a range of sources; for example, spatial data concerning species distributions or protected areas can be laid over maps of forest cover to examine the linkages between them.
Appropriate summary and presentation of data are also critical in the effective use of indicators. To aggregate results of forest inventory at the local scale for reporting at the national scale, and to monitor change over time, data can be summarized by categories and presented in relation to forest area. For example, forest fragmentation as evaluated by an index of spatial integrity can be expressed as forest area belonging to each class of spatial integrity (see Figures 1 and 2). A country might characterize the structural complexity of its forest resources in terms of the total area of forest within different classes of canopy openness, crown depth or numbers of canopy layers. Species richness could similarly be presented as the area of forest possessing more than a certain number of tree species per unit area or per 1 000 individual trees. Such categories could be expressed in qualitative terms determined according to local or national conditions. For example, disturbance classes of high, medium or low timber extraction could be defined based on the frequency of cut stumps encountered in inventory plots.
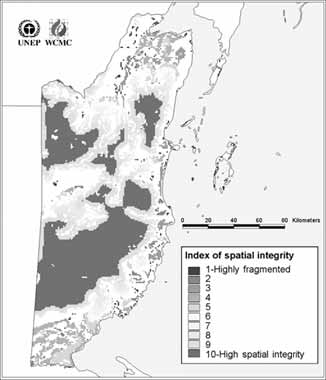
1 - Forest cover of Belize classified by spatial integrity index, which combines measures of patch size, shape and isolation (summarized statistically in Figure 2)
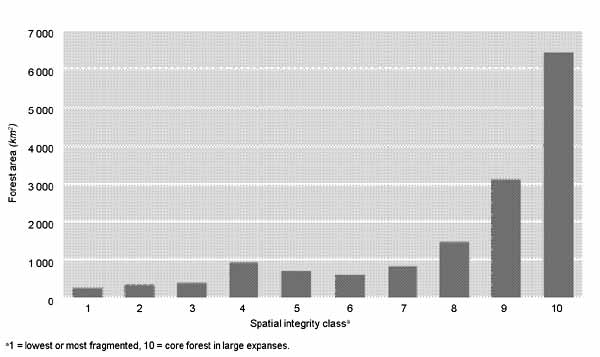
2 - Forest area of Belize by spatial integrity class - statistical summary
A considerable effort has been devoted to the development of indicators for sustainable forest management in recent years, and many of these indicators are related to forest biodiversity. However, little progress has been made in implementing these at the local level or in evaluating their relevance or reliability as a basis for decision-making. Future research and the development of conceptual models concerning the processes influencing forest biodiversity are likely to generate new insights about the relationships between indicators and the variables or processes of interest and about the uncertainty surrounding these relationships.
A variety of different frameworks are available for the development and implementation of biodiversity indicators. Although some of these (notably the pressure-state-response framework) are now in widespread use, future research is likely to produce more refined methods of structuring and organizing indicators. In particular, there is a need to develop practical tools that can assist in the development and application of biodiversity indicators, based on such frameworks. The provision of such tools, together with a programme of capacity building, would help increase the use of indicators among decision-makers and would improve the quality of environmental monitoring. To date, despite the international effort focusing on indicator development, such indicators have only rarely been implemented in a practical way to inform policy development or management interventions.
The eight general indicators for forest biodiversity identified in this article are consistent with those developed by criteria and indicators processes but are amenable to practical implementation at the local level. It may be necessary to adapt each of these indicators to local circumstances and forest characteristics. Methodologies for assessing these variables are available and could be implemented at relatively low cost through integration with standard forest inventory approaches.
Aggregating information collected at the local scale for the purposes of national-level assessment and reporting to international processes and conventions can be achieved by summarizing data in categorical forms and combining them in relation to forest area. While reports to CBD have so far focused principally on response measures undertaken by parties to the convention, it is likely that in future consideration will be given to monitoring the effectiveness of these response options and their impact on biodiversity. The approaches outlined here would provide an appropriate method for evaluating such impacts on biodiversity associated with forest ecosystems.
Bibliography
Bachmann P., Köhl M. & Päivinen R., eds. 1998. Assessment of biodiversity for improved forest planning. Dordrecht, the Netherlands, Kluwer Academic Publishers.
Beattie, A.J., Majer, J.D. & Oliver, I. 1993. Rapid biodiversity assessment: a review. In Rapid biodiversity assessment, p. 4-14. Proceedings of the Biodiversity Assessment Workshop, Sydney, Australia, 3-4 May 1993. Sydney, Australia, Macquarie University.
Boyle, M. 1998. Developing policy performance indicators for Ontario Ministry of Natural Resources. M.Sc. thesis, University of Waterloo, Canada.
Boyle, T.J.B. & Boontawee, B., eds. 1995. Measuring and monitoring biodiversity in tropical and temperate forests. Bogor, Indonesia, Center for International Forestry Research (CIFOR).
Boyle, T.J.B & Sayer, J.A. 1995. Measuring, monitoring and conserving biodiversity in managed tropical forests. Commonwealth Forestry Review, 74: 20-25.
Burley, J. & Gauld, I. 1995. Measuring and monitoring forest biodiversity. A commentary. In T.J.B. Boyle & B. Boontawee, eds. Measuring and monitoring biodiversity in tropical and temperate forests, p. 19-46. Jakarta, Indonesia, CIFOR.
Castañeda, F. 2001. Collaborative action and technology transfer as means of strengthening the implementation of national-level criteria and indicators. In R.J. Raison, A.G. Brown & D.W. Flinn, ed. Criteria and indicators for sustainable forest management, p. 145-163. IUFRO Research Series No. 7, Wallingford, UK, CABI Publishing.
Commission on Sustainable Development (CSD). 2001. Indicators of sustainable development: guidelines and methodologies. New York, USA.
Convention on Biological Diversity (CBD). 1997a. Recommendations for a core set of indicators of biological diversity. UNEP/CBD/SBSTTA/3/Inf.13. Montreal, Canada, CBD Secretariat.
CBD. 1997b. Indicators of forest biodiversity. Working document prepared for the meeting of the liaison group on forest biological diversity. UNEP/CBD/SBSTTA/3/Inf.23. Montreal, Canada, CBD Secretariat.
CBD. 2001. Global biodiversity outlook. Montreal, Canada, CBD Secretariat.
Dallmeier, F. & Comiskey, J.A. 1998. Forest biodiversity assessment, monitoring, and evaluation for adaptive management. In F. Dallmeier & J.A. Comiskey, eds. Forest biodiversity research, monitoring and modeling. Conceptual background and Old World case studies, p. 3-16. Man and the Biosphere Series Vol. 20. Paris, France and Carnforth, UK, UNESCO and Parthenon Publishing Group.
European Environment Agency (EEA). 1998. Europe's environment - the 2nd assessment. Luxembourg, Office for Publications of the European Communities.
FAO. 2001a. Criteria and indicators for sustainable forest management: a compendium. Forest Management Working Papers No. 5. Rome.
FAO. 2001b. State of the World's Forests 2001. Rome.
FAO. 2001c. Global Forest Resources Assessment 2000 - main report. FAO Forestry Paper No. 140. Rome.
Ferris, R. & Humphrey, J.W. 1999. A review of potential biodiversity indicators for application in British forests. Forestry, 72(4): 313-328.
Ferris-Kaan, R., Peace, A.J. & Humphrey, J.W. 1998. Assessing structural diversity in managed forests. In P. Bachmann, M. Köhl & R. Päivinen, eds. Assessment of biodiversity for improved forest planning, p. 331-342. Forestry Sciences Vol. 51. Dordrecht, the Netherlands, Kluwer Academic Publishers.
Friend, A. & Rapport, D. 1979. Towards a comprehensive framework for environment statistics: a stress-response approach. Ottawa, Canada, Statistics Canada.
Grayson, A.J. & Maynard, W.B. 1997. The world's forests - Rio +5: international initiatives towards sustainable forest management. Oxford, UK, Commonwealth Forestry Association.
Groombridge, B. & Jenkins, M.D. 1996. Assessing biodiversity status and sustainability. WCMC Biodiversity Series No 5. Cambridge, UK, World Conservation Press.
Hawthorne, W. & Juam Musah, A. 1993. Forest protection in Ghana. Kumasi, Ghana, Overseas Development Administration (ODA).
Heywood, V.H., ed. 1995. Global biodiversity assessment. Cambridge, UK, United Nations Environment Programme (UNEP) and Cambridge University Press.
Holdgate, M. 1996. From care to action: making a sustainable world. London, UK, World Conservation Union (IUCN) and Earthscan.
Hunter, M.L., ed. 1999. Maintaining biodiversity in forest ecosystems. Cambridge, UK, Cambridge University Press.
Hyman, J.B. & Leibowitz, S.G. 2001. JSEM: a framework for identifying and evaluating indicators. Environmental Monitoring and Assessment, 66: 207-232.
Iremonger, S., Ravilious, C. & Quinton, T. 1997. A statistical analysis of global forest conservation. In S. Iremonger, C. Ravilious & T. Quinton, eds. A global overview of forest conservation - including: GIS files of forests and protected areas, Version 2. CD-ROM. Cambridge, UK, CIFOR and WCMC.
Jennings, S.B., Brown, N.D., Boshier, D.H., Whitmore, T.C. & Lopes J. do C.A. 2001. Ecology provides a pragmatic solution to the maintenance of genetic diversity in sustainably managed tropical rain forests. Forest Ecology and Management, 154: 1-10.
Jermy, C., Long, D., Sands, M., Stork, N. & Winser, S., eds. 1995. Biodiversity assessment: a guide to good practice. London, UK, Department of the Environment.
Kapos, V. & Jenkins, M.D. 2002. Development of effective indicators for monitoring biodiversity in tropical moist forest ecosystems. Final Technical Report, Project R6515. London, UK, Department for International Development (DFID).
Kapos, V., Lysenko, I. & Lesslie, R. 2000. Assessing forest integrity and naturalness in relation to biodiversity. Cambridge, UK, UNEP-WCMC.
Namkoong, G., Boyle, T., Gregorius, H.-R., Joly, H., Savolainen, O., Ratnam, W. & Young, A. 1996. Testing criteria and indicators for assessing the sustainability of forest management: genetic criteria and indicators. CIFOR Working Paper No. 10. Bogor, Indonesia, Center for International Forestry Research (CIFOR).
Noss, R.F. 1990. Indicators for monitoring biodiversity: a hierarchical approach. Conservation Biology, 4(4): 355-364.
Noss, R.F. 1999. Assessing and monitoring forest biodiversity: a suggested framework and indicators. Forest Ecology and Management, 115: 135-146.
Organisation for Economic Co-operation and Development (OECD). 1993. OECD core set of indicators for environmental performance reviews. Environmental Monograph No. 83. Paris, France.
Prabhu, R., Colfer, C.J.P., Venkateswarlu, P., Tan, L.C., Soekmadi, R. & Wollenberg, E. 1996. Testing criteria and indicators for the sustainable management of forests: Phase I. Final report. Jakarta, Indonesia, CIFOR.
Raison, R.J., Flinn, D.W. & Brown, A.G. 2001. Application of criteria and indicators to support sustainable forest management: some key issues. In R.J. Raison, A.G. Brown & D.W. Flinn, ed. Criteria and indicators for sustainable forest management, p. 5-18. IUFRO Research Series No. 7, Wallingford, UK, CABI Publishing.
Ramírez-Marcial, N., González-Espinosa, M. & Williams-Linera, G. 2001. Anthropogenic disturbance and tree diversity in montane rain forests in Chiapas, Mexico. Forest Ecology and Management, 154: 311-326.
Stork, N.E., Boyle, T.J.B., Dale, V., Eeley, H., Finegan, B., Lawes, M., Manokaran, N., Prabhu, R. & Soberon, J. 1997. Criteria and indicators for assessing the sustainability of forest management: conservation of biodiversity. CIFOR Working Paper No. 17. Jakarta, Indonesia, CIFOR.
Tanner, E.V.J., Kapos, V. & Adams, J.B. 1998. Tropical forests - spatial pattern and change with time, as assessed by remote sensing. In D.M. Newbery, H.H.T. Prins, & N.D. Brown, eds. Population and community dynamics, p. 599-615. 37th Symposium of the British Ecological Society. Oxford, UK, Blackwell Scientific Publications.
Turner, S.J. 1995. Scale, observation and measurement: critical choices for biodiversity research. In T.J.B. Boyle & B. Boontawee, eds. Measuring and monitoring biodiversity in tropical and temperate forests, p. 97-111. Bogor, Indonesia, Center for International Forestry Research (CIFOR).
Vanclay, J.K. 1998. Towards a more rigorous assessment of biodiversity. In P. Bachmann, M. Köhl & R. Päivinen, eds. Assessment of biodiversity for improved forest planning, p. 211-232. Forestry Sciences Vol. 51. Dordrecht, the Netherlands, Kluwer Academic Publishers.
