![]()
![]()
![]()
The objective of quantitative livestock modelling is to identify and quantify resources, requirements (livestock numbers, herd composition, feed, etc.) and constraints to the achievement of specified levels and composition of livestock product demand. Quantitative livestock modelling also provides a means of ex ante assessment of the effects of development programmes (health, breed, management or feed) aimed at changing selected parameters of the system in which attempts are being made to raise productivity.
The basis for the application of quantitative models should be the individual livestock production system, because different livestock systems involving the same species place different demands on resources. This approach groups livestock systems facing similar constraints, such as availability of feed, and reveals the productivity and potential for growth of different systems. It also allows for the consideration of any one system in isolation or any combination of systems, thus facilitating both the analysis of system-specific programmes, without the need to involve the whole livestock sector, and the description and analysis of the evolution of the whole sector, which typically involves changes in the balance between the various production systems (Hallam, 1983; Steinfeld and Mack, 1995).
Hallam (1983) provides a detailed review of quantitative models and their application in livestock development. In general the quantitative modelling framework comprises three types of model:
demand-driven models, which quantify the livestock population size and structure necessary to achieve specified production targets on the basis of alternative assumptions concerning productivity;
feed accounting models, which quantify feed requirements associated with production targets and confront these requirements with feed availabilities to obtain balance sheets for each livestock production system; and
herd growth models, which trace the expansion of a herd or flock from a given base year over time and hence investigate predicted population sizes and the feasibility of achieving production targets.
Although the modelling framework focuses on the individual livestock system, it can support any level of disaggregation in system classification provided that sufficiently accurate data can be obtained. However, there is little scope for disaggregation beyond the point where there are no significant differences in the productivity of systems or where the systems do not have significantly different requirements for resources.
Major efforts to develop sub-Saharan Africa’s livestock sector are justified by the fact that the region has witnessed a decline in the per capita consumption of both meat and milk over the past decades, mainly as a result of low and stagnant livestock productivity coupled with rapidly expanding human population. In this study, the offtake of livestock products per animal by livestock production system was estimated, using the Livestock Development Planning System Version 2 (LDPS2). The relative contribution of each system to the overall availability of live-stock products was first quantified, and the total offtake and availability of livestock products in sub-Saharan Africa were then estimated.
LDPS2, developed by FAO (1997), is a quantitative livestock model designed to answer questions related to the capacity for meeting a given demand for meat and milk from various livestock production systems, following the structure of quantitative livestock models described by Hallam (1983). In the current study, the herd growth routine of LDPS2 was used to estimate meat and milk offtake from the traditional rumi-nant production systems and the smallholder dairy systems defined in Figure 1. Offtake from beef and dairy ranches was not estimated, as these systems occur in almost all zones and their distribution is therefore difficult to describe. Modelling was conducted for each system for cattle, sheep and goats. The production parameters used are presented in Appendices 15 to 18 and were obtained from the literature used in the review (Chapter 4).
For cattle, beef and milk, outputs per km2 were then estimated in a geographical information system (GIS) by superimposing a map of AEZs derived from FAO (1999)[12] on the cattle density map for 1994 (FAO, 1999) and multiplying the respective LDPS2 outputs per animal to obtain the production density (output per km2). The offtake per capita was subsequently derived by dividing the figures on the production density map by those on the human density map. The GIS calculations were performed using GIS ArcView Version 3.2.
Table 31 presents, by production system, cattle herd growth rates and annual beef and milk offtake (kg) per animal per year, as estimated by LDPS2, while Table 32 presents total beef and milk offtake by zone. Based on the model, pastoral systems and mixed highland systems have the lowest livestock population growth rates of 0.1 percent and 0.2 percent, mainly owing to high mortality risks in the pastoral systems and low calving rates in the mixed highland systems. Cattle populations in the mixed systems in the subhumid and humid zones are estimated to be growing at 3.0 percent per annum. The weighted growth rate of all systems is 1.4 percent per annum, which is similar to the mean growth rate for sub-Saharan Africa’s cattle population for the period 1979 to 1999, estimated at 1.5 percent (FAOSTAT, 2000). Although smallholder dairy systems are oriented towards milk production, annual beef offtake per animal (18.3 kg) is higher than that in pastoral and mixed systems (6.8 and 12.1 kg). Mixed systems in the highlands (predominantly the Ethiopian highlands) have the lowest annual beef and milk offtake per animal. The estimated annual milk offtake per animal in smallholder dairy systems is 599.8 kg, which is about 15 and 24 times more milk per animal than in pastoral and mixed systems (41.4 kg and 24.8 kg) respectively.
Table 31. Estimated cattle herd growth rates and annual beef and milk offtake (kg) per animal by production system in sub-Saharan Africa
|
System/AEZ |
Herd growth rate (%) |
Beef offtake (kg/animal) |
Milk offtake (kg/animal) |
|
|
Pastoral |
||||
|
|
Arid/semi-arid |
0.1 |
11.8 |
41.4 |
|
Mixed |
||||
|
|
Semi-arid |
1.5 |
10.9 |
40.0 |
|
|
Subhumid |
3.0 |
12.1 |
26.4 |
|
|
Humid (Central and West Africa) |
3.3 |
11.5 |
25.5 |
|
|
Humid (East and southern Africa) |
3.3 |
13.2 |
25.5 |
|
|
Highland mixed |
0.2 |
6.8 |
24.8 |
|
|
Smallholder dairy |
1.7 |
18.3 |
599.8 |
Maps 4 and 5 present annual beef and milk offtake per km2 in sub-Saharan Africa. Offtake patterns in different subregions and zones closely follow the distribution of cattle (Map 2). East Africa has the highest offtake per km2 of both beef and milk, while Central Africa has the lowest, mainly because it lies predominantly within the humid zone. Annual beef and milk offtakes in this subregion are less than 50 kg and 250 kg per km2 respectively. In West Africa, areas of high beef and milk offtake are mainly concentrated in the semi-arid and subhumid zones, while the arid zone and the coastal/humid zone produce less than 50 kg of beef and 250 kg of milk per km2. In southern Africa, areas of relatively low beef and milk offtake occur in parts of Angola, Mozambique and Zambia and in the arid zones of Botswana and Namibia.
According to Table 32, the total beef offtake estimated from LDPS2 and GIS (based on the cattle density map of 1994) is 1.75 million tonnes, which is 19.6 percent less than the 2.18 million tonnes reported in FAOSTAT (1994). For milk, the estimated total offtake is 9.32 million tonnes, which is 1.4 percent less than the 9.46 million tonnes obtained from FAOSTAT (1994). However, the LDPS2 and GIS estimates exclude the contributions from ranching systems, which were omitted on account of the practical difficulties of estimating offtake from such enterprises; these are, however, included in the official statistics that make up FAOSTAT. Although this sector is relatively small in sub-Saharan Africa it achieves higher levels of productivity and this will at least partially account for the difference between the two estimates.
The pastoral and semi-arid mixed systems are estimated to account for 53 percent of total beef offtake and 36 percent of total milk offtake in sub-Saharan Africa (Figure 7). The smallholder dairy system, which accounts for only 4.3 percent of the total cattle population, contributes about 7 percent of total beef offtake and 44 percent of total milk offtake. Furthermore, East Africa, which contains most of the smallholder dairy systems, is estimated to produce about 77 percent of sub-Saharan Africa’s cow milk (Appendices 5 and 19).
Table 33 and Maps 6 and 7 present annual beef and milk offtake per capita by production system in sub-Saharan Africa. Both are low, at 8.5 kg and 35.7 kg respectively. They are lowest in the humid zone, which also has the lowest beef and milk offtake per km2. The smallholder systems, located mainly in the highlands of Kenya and to some extent in the United Republic of Tanzania, have the highest milk and beef offtake per capita, at 824.7 kg and 25.5 kg respectively.[13] As shown in Table 33, pastoral and semi-arid mixed systems achieve higher milk and beef offtake per capita than do subhumid and humid mixed systems.
Table 32. Estimated annual beef and milk offtake by agro-ecological zone in sub-Saharan Africa
|
System/AEZ |
Beef |
Milk |
|||
|
‘000 tonnes |
% |
‘000 tonnes |
% |
||
|
Pastoral |
|
|
|
|
|
| |
Arid |
398.1 |
22.8 |
1 414.7 |
15.2 |
|
Mixed |
|
|
|
|
|
| |
Semi-arid1 |
526.2 |
30.1 |
1 979.6 |
21.2 |
| |
Subhumid |
425.9 |
24.3 |
1 017.2 |
10.9 |
| |
Humid (Central and West Africa) |
50.6 |
2.9 |
112.4 |
1.2 |
| |
Humid (East and West Africa) |
17.8 |
1.0 |
45.8 |
0.5 |
| |
Highland |
209.7 |
12.0 |
774.3 |
8.3 |
| |
Smallholder dairy |
121.6 |
6.9 |
3 979.6 |
42.7 |
|
GIS total2 |
1 749.9 |
100.0 |
9 323.7 |
100.0 |
|
|
FAOSTAT (1994) total |
2 178.2 |
|
9 459.8 |
|
|
|
Percentage difference (%) |
19.7 |
|
1.4 |
|
|
1 The vast majority of cattle in the semi-arid zone are kept in mixed systems. No separate estimate was therefore made for pastoral systems in this zone
2 Based on cattle density map for 1994, FAO (1999)
Figure 7. Relative contribution of different cattle systems to overall beef and milk offtake in sub-Saharan Africa
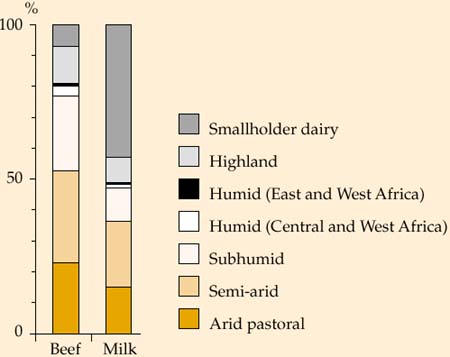
Table 33. Estimated annual beef and milk offtake (kg per capita) by system in sub-Saharan Africa
|
System |
Beef |
Milk |
|
|
Pastoral |
|||
|
|
Arid |
12.3 |
43.2 |
|
Mixed |
|||
|
|
Semi-arid1 |
11.1 |
41.0 |
|
|
Subhumid |
7.0 |
15.5 |
|
|
Humid (Central and West Africa) |
1.9 |
4.2 |
|
|
Humid (East and southern Africa) |
2.1 |
5.0 |
|
|
Highland mixed |
5.7 |
21.0 |
|
|
Smallholder dairy |
25.5 |
824.7 |
|
All |
8.5 |
35.7 |
|
Based on Tables 13 and 19, the use of draught power (including transport), in sub-Saharan Africa was estimated by multiplying the estimated total number of oxen in each system by the mean number of days in a year in which oxen are used for work.[14] Draught power was not estimated for pastoral systems given the relatively small proportion of oxen (Table 10) and the very minor cropping activities found in these systems. The following proportions of oxen in the herd were used to estimate the total number of oxen workdays: 10 percent in the humid and highland smallholder dairy systems and 20 percent in the semi-arid, subhumid and highland mixed systems (for the Ethiopian highlands the latter might be a slight underestimate).
Table 34 and Map 8 show estimated oxen workdays per km2 in sub-Saharan Africa. The highland mixed systems of Ethiopia have the highest mean estimated density of oxen workdays per km2 (1 194.9 oxen workdays per annum), followed by the other highland systems in East Africa (408.3 oxen workdays per annum). For the semi-arid and subhumid mixed systems, the estimates are 107.4 and 154.4 mean annual oxen workdays per km2, while the humid mixed systems have the lowest input of draught power, estimated at 12.4 oxen workdays per km2 in Central and West Africa and 59.8 oxen workdays per km2 in East and southern Africa.
Table 35 presents herd growth and meat and milk offtake per animal for sheep, as estimated using LDPS2. Sheep flock growth rates are highest in semi-arid mixed systems and lowest in pastoral systems. The estimated weighted growth rate for sheep populations in sub-Saharan Africa is 2.5 percent, which is identical to the FAOSTAT figure for the period 1989 to 1999 (FAOSTAT, 2000). However, the weighted meat offtake per animal for sheep is 2.3 kg, which is considerably lower than the 4.2 kg per animal calculated from FAOSTAT (2000) by dividing total production by total sheep population. Nevertheless, the figure of 2.3 kg per sheep is relatively close to the value of 2.7 kg per sheep obtained by using a carcass weight of 12.7 kg (FAOSTAT, 2000) and a mean offtake of 21.0 percent obtained from the literature review.
Table 34. Estimated annual oxen workdays per km2 in sub-Saharan Africa
|
System |
Workdays/km2 |
|
|
Mixed |
||
|
|
Semi-arid1 |
107.5 |
|
|
Subhumid |
154.4 |
|
|
Humid (Central and West Africa) |
12.4 |
|
|
Humid (East and southern Africa) |
59.8 |
|
|
Highland mixed |
1 194.9 |
|
Smallholder dairy1 |
408.3 |
|
1 Assumed to be predominantly in Kenya and the United Republic of Tanzania
Table 35. Estimated sheep flock growth rates and sheep meat and milk offtake per animal by production system in sub-Saharan Africa
|
System |
Growth rate |
Sheep meat offtake |
Sheep milk offtake (kg/animal) |
||
|
Percentage of females milked |
|||||
| |
|
|
1 |
5 |
10 |
|
Arid pastoral |
0.7 |
1.8 |
0.3 |
1.7 |
3.3 |
|
Semi-arid mixed |
5.7 |
2.9 |
0.3 |
1.6 |
3.3 |
|
Subhumid mixed |
3.0 |
2.0 |
0.3 |
1.6 |
3.1 |
|
Humid mixed |
1.5 |
2.1 |
0.2 |
0.8 |
1.6 |
|
Highland mixed |
3.5 |
2.7 |
0.2 |
0.8 |
1.5 |
Table 36 presents herd growth and meat and milk offtake per animal for goats, as estimated using LDPS2. Goat flock growth rates are highest in the highland mixed systems and at lower but similar levels in other systems. The estimated weighted growth rate for the goat population is 4.3 percent, which is higher than the 2 percent figure derived from FAOSTAT (2000) for the period 1989 to 1999. The weighted meat offtake per animal is 2.7 kg, which is again lower than the 3.7 kg per animal calculated from FAOSTAT (2000) by dividing total goat meat production by total goat population. However, the figure of 2.7 kg per goat is slightly higher than the 2.4 kg figure obtained by using a carcass weight of 11.7 kg (FAOSTAT, 2000) and a mean offtake of 21 percent obtained from the literature review.
The total offtake of sheep and goat meat, together with the relative contribution from different zones, is presented in Table 37. Between half and two-thirds of the sheep meat (56 percent) and goat meat (62.5 percent) in sub-Saharan Africa is produced in the arid and semi-arid zones. About a quarter of the sheep meat (24.1 percent) and only 11.1 percent of the goat meat are produced in the highland zone.
Table 36. Estimated goat herd growth rates and goat meat and milk offtake per animal by production system in sub-Saharan Africa
|
System |
Growth rate |
Goat meat offtake |
Goat milk offtake (kg/animal) |
||
|
Percentage of females milked |
|||||
| |
|
|
1 |
5 |
10 |
|
Arid pastoral |
2.5 |
2.3 |
0.2 |
1.0 |
2.0 |
|
Semi-arid mixed |
4.4 |
3.0 |
0.2 |
1.0 |
1.8 |
|
Subhumid mixed |
2.3 |
2.9 |
0.2 |
0.9 |
1.8 |
|
Humid mixed |
7.3 |
2.4 |
0.1 |
0.6 |
1.1 |
|
Highland mixed |
12.5 |
3.1 |
0.1 |
0.5 |
1.0 |
Table 37. Estimated offtake of sheep and goat meat by agro-ecological zone in sub-Saharan Africa
|
AEZ |
Sheep |
Goat |
||||
|
Distribution of population (%) |
Meat offtake (‘000 tonnes) |
Offtake (%) |
Distribution of population (%) |
Meat offtake |
Offtake (%) |
|
|
Arid |
33.7 |
101.6 |
27.5 |
38.2 |
160.0 |
32.9 |
|
Semi-arid |
22.9 |
105.4 |
28.5 |
26.3 |
143.7 |
29.6 |
|
Subhumid |
14.4 |
45.7 |
12.4 |
16.5 |
87.1 |
17.9 |
|
Humid |
8.3 |
27.7 |
7.5 |
9.4 |
41.1 |
8.5 |
|
Highlands |
20.8 |
89.1 |
24.1 |
9.6 |
54.2 |
11.1 |
|
Total |
100.0 |
369.5 |
100.0 |
100.0 |
486.0 |
100.0 |
1 The ratios are derived from Winrock (1992), on the assumption that they have not since changed
|
[12] On the basis of LGP and
rainfall (or temperature, in the case of the highlands) (Winrock,
1992). [13] Smallholder dairy systems in the highlands of Kenya are more intensive than those of the United Republic of Tanzania. Thus, both the total offtake and per capita offtake of milk may have been overestimated for some areas of the United Republic of Tanzania. [14] For the purpose of this study, oxen workdays were defined as the total number of days oxen are used for ploughing, seeding and fertilizing, harvesting, threshing, on-farm and off-farm transport, etc. |
![]()
![]()
![]()