![]()
![]()
![]()
ALTERNATIVE WAYS OF MEASURING VARIABILITY/VOLATILITY
Another measure of assessing variability of prices is by removing the consistent components of the price series and analysing the nature of the residuals. The simplest time series model for such an analysis is made up of an unobservable stochastic trend component, and a random irregular term as follows
|
pt =at + et, |
et : NID (0,se2), t = 1,..., T |
|
at = at-1 + zt, |
zt : NID (0,se2), |
where the irregular and level disturbances, and, respectively, are mutually independent and the notation NID denotes normally and independently distributed. Only pt is observable. The econometric treatment of this type of unobserved component models is based on the state space form. Once the model has been put in this form, the Kalman filter yields estimators of the components based on current and past observations. Signal extraction refers to the estimation of components based on all the information in the sample and runs backwards as recursions from the last observation. Predictions are made by extending the Kalman filter forward. Root mean square errors (RMSEs) can be computed for all estimators (for each sample point) and confidence intervals constructed. The unknown variance parameters are estimated by constructing a likelihood function from the one-step ahead prediction errors produced by the Kalman filter. The likelihood function is maximized by an iterative procedure.
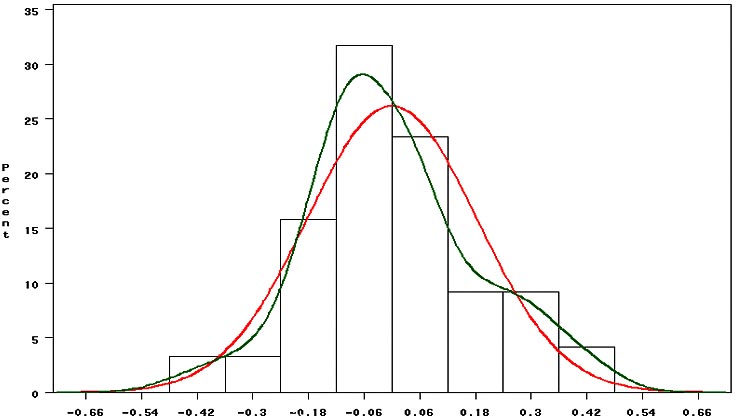
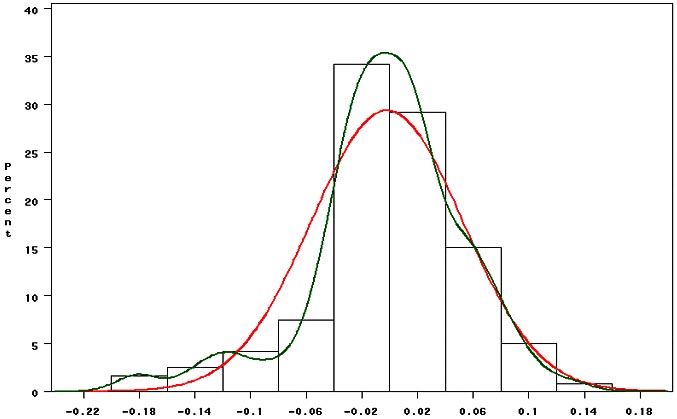
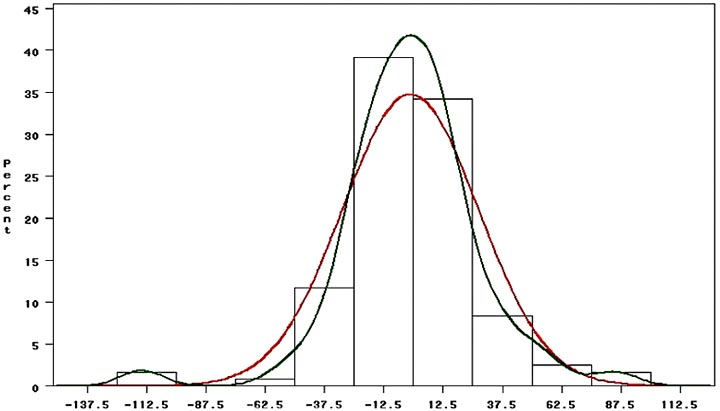
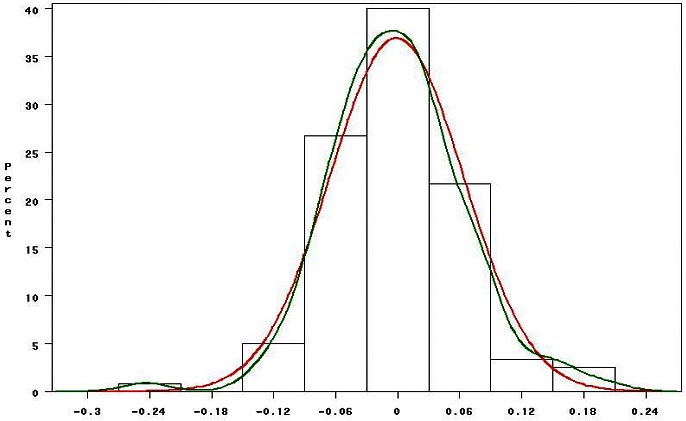
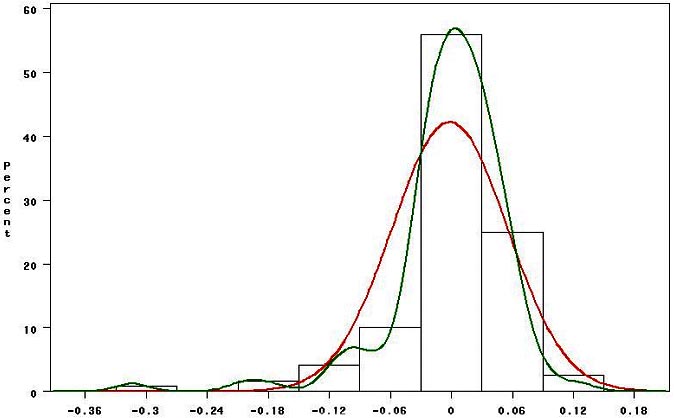
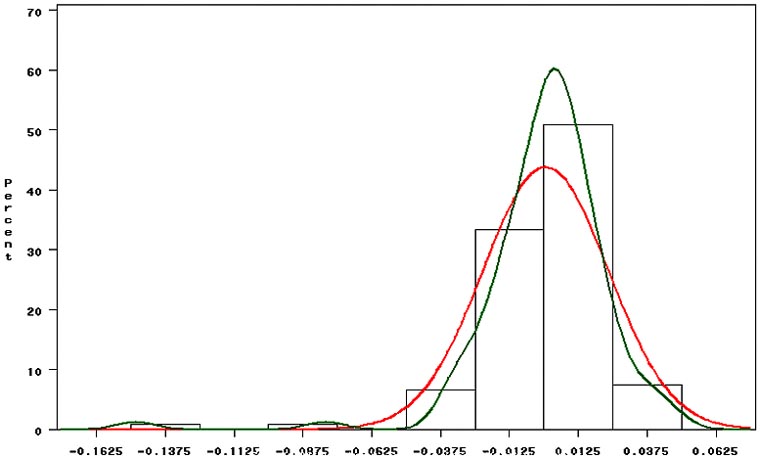
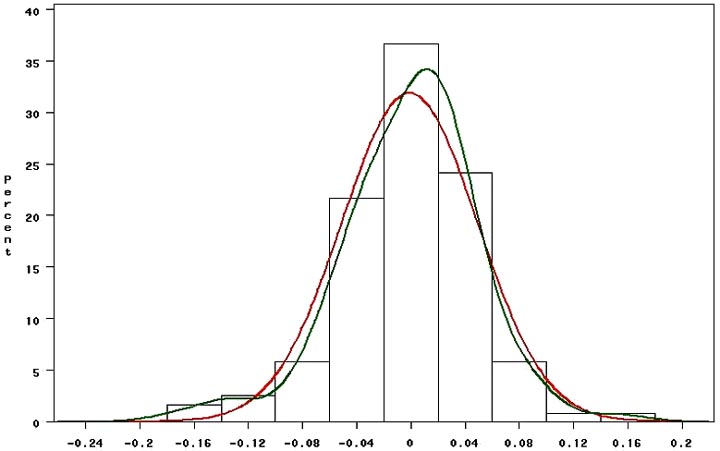
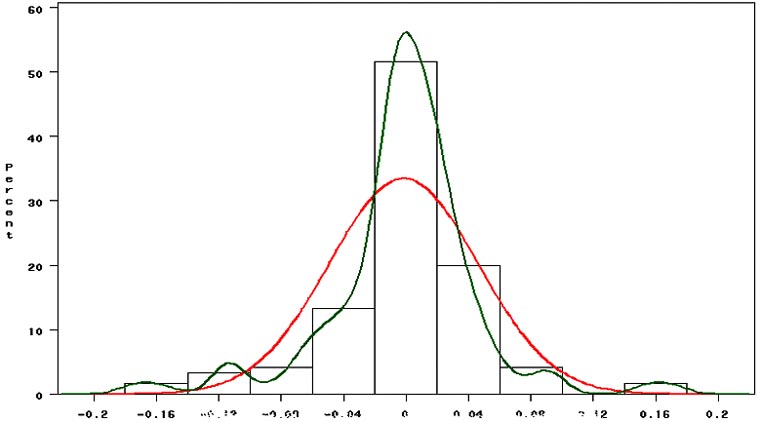
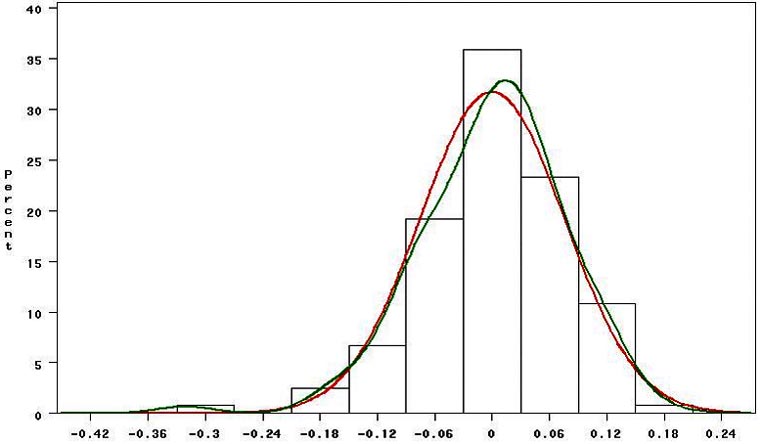
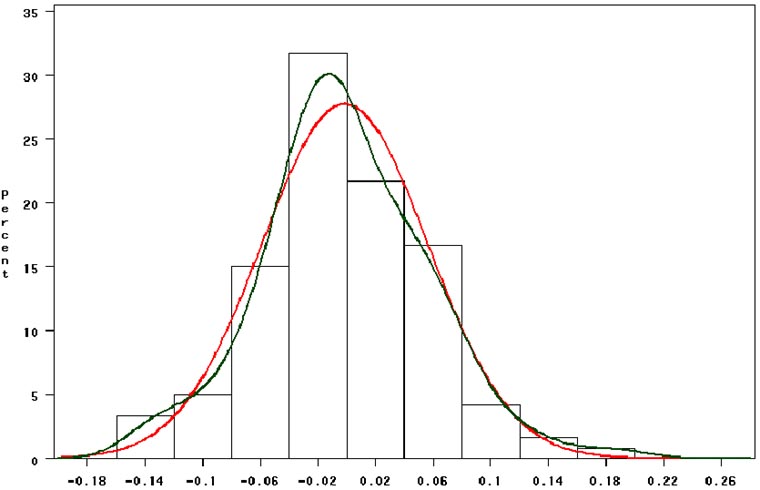
The resulting residuals from the estimated "price trend" model using the procedure outlined above (for each of the 18 commodities) were then used to fit empirical distributions of price volatility using non- parametric kernel densities with specific bandwidths to obtain smooth kernel functions across the observations. The resulting distributions were then compared with kernel functions of a normal density[21]. This approach is very appealing since the whole question of volatility and structural changes are essentially departures from normality. The empirical distribution or kernel smoothing function puts less weight on extreme observations (although they are subject to the bandwidths) and hence are able to map out a better picture of the true empirical structure of the series.
In our test for normality in price volatility we use the Jarque-Bera test statistic. The test measures the difference of the skewness and kurtosis of the series with those from the normal distribution. Under the null hypothesis of a normal distribution, the Jarque-Bera statistic is distributed with 2 degrees of freedom. The reported probability is the probability that a Jarque-Bera statistic exceeds the observed value under the null hypothesis. A small probability value leads to the rejection of the null hypothesis of a normal distribution. In this case, the probability levels can be used to judge whether prices are more or less volatility. Hence, the higher the probability the likelier it is for the series to be close to that of a normal distribution. Table App. VII-1 below presents the results of the tests along with moments of the empirical volatility distribution.
Table App. VI-1: Distributional Statistics and normality test of volatility, by decade
| |
Mean |
Median |
Maximum |
Minimum |
Std. Dev. |
Skewness |
Kurtosis |
Jarque- Bera |
Probability |
|
BANANA_R7080 |
-0.00464 |
-0.00239 |
0.27779 |
-0.27779 |
0.09369 |
-0.19262 |
3.55582 |
2.27 |
0.3218 |
|
BANANA_R8090 |
0.00456 |
0.01312 |
0.32091 |
-0.27638 |
0.13290 |
-0.03362 |
2.34230 |
2.17 |
0.3384 |
|
BANANA_R9000 |
0.00168 |
-0.03200 |
0.46924 |
-0.46964 |
0.18311 |
0.29237 |
3.10228 |
1.75 |
0.4174 |
|
COCOA_R7080 |
-0.00119 |
-0.01028 |
0.19567 |
-0.25135 |
0.07508 |
0.02993 |
3.59365 |
1.77 |
0.4137 |
|
COCOA_R8090 |
-0.00412 |
-0.00868 |
0.24639 |
-0.14319 |
0.06261 |
0.76644 |
4.90858 |
29.71 |
0.0000 |
|
COCOA_R9000 |
-0.00296 |
-0.00389 |
0.12796 |
-0.17416 |
0.05405 |
0.05161 |
3.33273 |
0.60 |
0.7402 |
|
COFFEE_R7080 |
-0.00151 |
-0.00993 |
0.36960 |
-0.22226 |
0.07352 |
1.40112 |
8.79881 |
205.67 |
0.0000 |
|
COFFEE_R8090 |
-0.00564 |
0.00371 |
0.21373 |
-0.35138 |
0.06943 |
-0.94722 |
8.08796 |
146.15 |
0.0000 |
|
COFFEE_R9000 |
-0.00234 |
-0.00764 |
0.34106 |
-0.25315 |
0.08634 |
0.71380 |
5.32868 |
36.99 |
0.0000 |
|
COTTON_R7080 |
0.00219 |
-0.00619 |
0.13063 |
-0.11764 |
0.04009 |
0.41722 |
4.02247 |
8.64 |
0.0133 |
|
COTTON_R8090 |
-0.00106 |
-0.00115 |
0.30666 |
-0.13790 |
0.05371 |
1.37230 |
11.39435 |
386.74 |
0.0000 |
|
COTTON_R9000 |
-0.00018 |
-0.00385 |
0.13836 |
-0.14334 |
0.04591 |
0.17063 |
4.01247 |
5.66 |
0.0590 |
|
JUTE_R7080 |
-0.00505 |
-0.00704 |
0.36023 |
-0.16942 |
0.05667 |
2.18164 |
17.81245 |
1182.30 |
0.0000 |
|
JUTE_R8090 |
-0.00040 |
0.00145 |
0.19873 |
-0.30880 |
0.05800 |
-0.87473 |
10.53618 |
296.78 |
0.0000 |
|
JUTE_R9000 |
-0.00090 |
-0.00438 |
0.34788 |
-0.20682 |
0.07097 |
0.88571 |
8.67366 |
175.17 |
0.0000 |
|
MAIZE_R7080 |
-0.26990 |
-0.79143 |
39.74047 |
-43.97789 |
15.20777 |
0.15270 |
3.73373 |
3.13 |
0.2089 |
|
MAIZE_R8090 |
-0.00132 |
-0.00692 |
0.29712 |
-0.26000 |
0.06200 |
0.69900 |
9.57820 |
224.25 |
0.0000 |
|
MAIZE_R9000 |
-0.00205 |
-0.00089 |
0.13090 |
-0.18133 |
0.05459 |
-0.70445 |
4.43591 |
20.07 |
0.0000 |
|
PALMOIL_R7080 |
-0.00066 |
-0.01137 |
0.29591 |
-0.25961 |
0.08673 |
0.35280 |
4.47416 |
13.24 |
0.0013 |
|
PALMOIL_R8090 |
-0.00367 |
-0.00972 |
0.39393 |
-0.19813 |
0.09535 |
0.79241 |
5.35432 |
39.94 |
0.0000 |
|
PALMOIL_R9000 |
-0.00196 |
0.00735 |
0.14234 |
-0.47108 |
0.07598 |
-2.17270 |
14.05109 |
699.17 |
0.0000 |
|
RAPESEED_R7080 |
-0.00169 |
-0.00161 |
0.32680 |
-0.15334 |
0.07841 |
0.97261 |
5.68146 |
54.41 |
0.0000 |
|
RAPESEED_R8090 |
-0.00411 |
-0.00597 |
0.31503 |
-0.58443 |
0.09444 |
-1.51201 |
15.43198 |
811.67 |
0.0000 |
|
RAPESEED_R9000 |
-0.00150 |
0.00466 |
0.12551 |
-0.31321 |
0.05697 |
-2.05845 |
11.02167 |
403.09 |
0.0000 |
|
RICE_R7080 |
-0.00037 |
-0.00302 |
0.17857 |
-0.15695 |
0.05860 |
0.38336 |
3.89420 |
6.88 |
0.0321 |
|
RICE_R8090 |
-0.00162 |
-0.00405 |
0.34047 |
-0.15977 |
0.05968 |
1.45944 |
11.23714 |
378.67 |
0.0000 |
|
RICE_R9000 |
-0.00058 |
-0.00070 |
0.20021 |
-0.24299 |
0.06503 |
0.04879 |
4.41934 |
10.04 |
0.0066 |
|
RUBBER_R7080 |
0.00059 |
0.00006 |
0.32507 |
-0.20225 |
0.07091 |
0.59691 |
6.52427 |
68.65 |
0.0000 |
|
RUBBER_R8090 |
-0.00174 |
-0.00734 |
0.47527 |
-0.11204 |
0.05813 |
4.88868 |
40.23262 |
7347.58 |
0.0000 |
|
RUBBER_R9000 |
0.00051 |
0.00309 |
0.04826 |
-0.14810 |
0.02278 |
-2.54889 |
17.67530 |
1196.70 |
0.0000 |
|
SISAL_R7080 |
0.00560 |
0.00406 |
0.17125 |
-0.34462 |
0.06310 |
-1.29845 |
10.65399 |
323.91 |
0.0000 |
|
SISAL_R8090 |
-0.00230 |
-0.00005 |
0.09590 |
-0.11208 |
0.02600 |
-0.21529 |
7.08875 |
83.81 |
0.0000 |
|
SISAL_R9000 |
-0.00151 |
0.00005 |
0.17048 |
-0.17456 |
0.04788 |
-0.31211 |
6.55849 |
64.72 |
0.0000 |
|
SOYBEAN_R7080 |
-0.00100 |
-0.00565 |
0.33280 |
-0.37889 |
0.08743 |
0.46129 |
8.22174 |
139.42 |
0.0000 |
|
SOYBEAN_R8090 |
-0.00180 |
-0.00583 |
0.26258 |
-0.11658 |
0.05626 |
2.15481 |
11.05030 |
413.43 |
0.0000 |
|
SOYBEAN_R9000 |
-0.00127 |
0.00505 |
0.15392 |
-0.17295 |
0.05018 |
-0.44349 |
4.47207 |
14.65 |
0.0007 |
|
SOYMEAL_R7080 |
-0.00094 |
-0.00228 |
0.35157 |
-0.27299 |
0.08410 |
0.36668 |
6.02858 |
48.15 |
0.0000 |
|
SOYMEAL_R8090 |
-0.00242 |
-0.00871 |
0.34359 |
-0.16915 |
0.06054 |
2.21371 |
13.41806 |
635.35 |
0.0000 |
|
SOYMEAL_R9000 |
0.00542 |
0.00727 |
0.13803 |
-0.19741 |
0.05105 |
-0.30017 |
4.13867 |
8.22 |
0.0164 |
|
SUGAR_R7080 |
0.00363 |
-0.01554 |
0.38108 |
-0.40706 |
0.12728 |
0.22140 |
4.20049 |
8.12 |
0.0173 |
|
SUGAR_R8090 |
-0.00005 |
-0.01234 |
1.55114 |
-0.23885 |
0.18108 |
5.33211 |
46.44346 |
9921.92 |
0.0000 |
|
SUGAR_R9000 |
0.00065 |
0.00281 |
0.22215 |
-0.17308 |
0.07008 |
0.26210 |
3.37517 |
2.06 |
0.3569 |
|
SUNFLMEAL_R7080 |
-0.00211 |
-0.01357 |
0.38994 |
-0.23749 |
0.08986 |
0.72773 |
6.23991 |
62.55 |
0.0000 |
|
SUNFLMEAL_R8090 |
-0.00223 |
-0.00856 |
0.39441 |
-0.18192 |
0.07677 |
1.36749 |
9.07943 |
220.35 |
0.0000 |
|
SUNFLMEAL_R9000 |
-0.00050 |
0.00807 |
0.17440 |
-0.32078 |
0.07558 |
-0.68649 |
4.76412 |
24.78 |
0.0000 |
|
TEA_R7080 |
-0.00077 |
-0.00641 |
0.52424 |
-0.27426 |
0.07586 |
2.61777 |
22.17611 |
1959.21 |
0.0000 |
|
TEA_R8090 |
-0.00215 |
-0.00255 |
0.26590 |
-0.22198 |
0.07587 |
0.19931 |
4.77312 |
16.38 |
0.0003 |
|
TEA_R9000 |
0.00217 |
0.00083 |
0.22353 |
-0.20081 |
0.07137 |
-0.11579 |
3.38728 |
1.01 |
0.6036 |
|
WHEAT_R7080 |
-0.00116 |
-0.00997 |
0.52669 |
-0.21300 |
0.07857 |
2.60864 |
19.21006 |
1437.85 |
0.0000 |
|
WHEAT_R8090 |
-0.00162 |
-0.00184 |
0.16564 |
-0.12065 |
0.03945 |
0.27681 |
5.72567 |
38.36 |
0.0000 |
|
WHEAT_R9000 |
-0.00096 |
-0.00252 |
0.18846 |
-0.13802 |
0.05767 |
0.20029 |
3.62566 |
2.74 |
0.2545 |
The probability values for the 5% level of significance
Distribution of volatility in real banana prices, 1990-2000
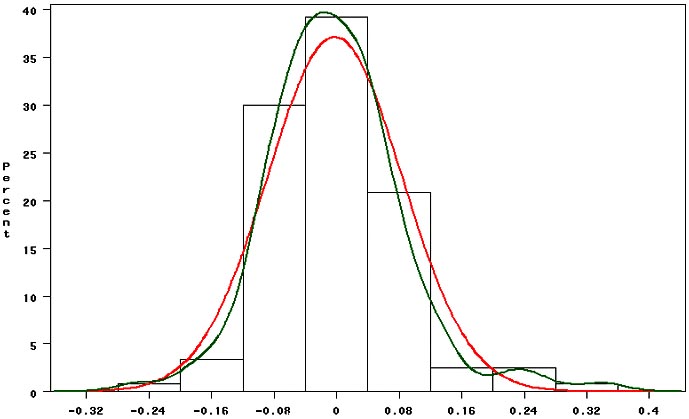
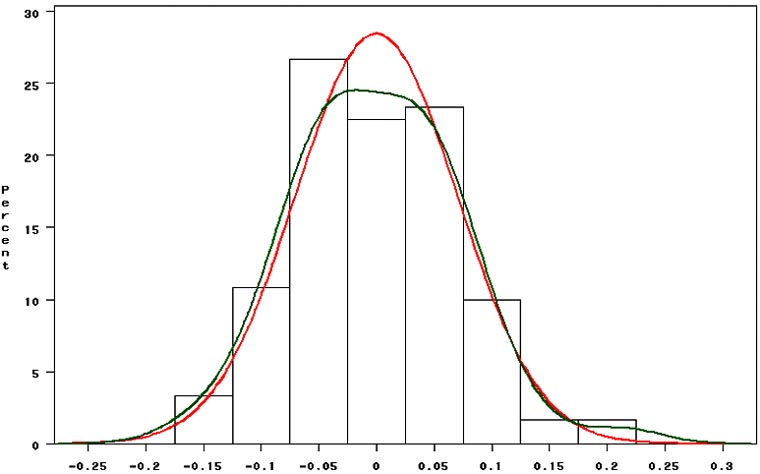
Distribution of volatility in real coffee prices, 1900-2000
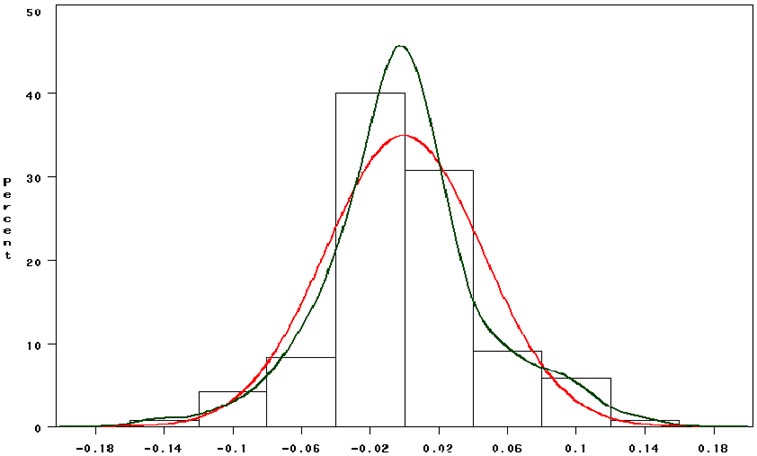
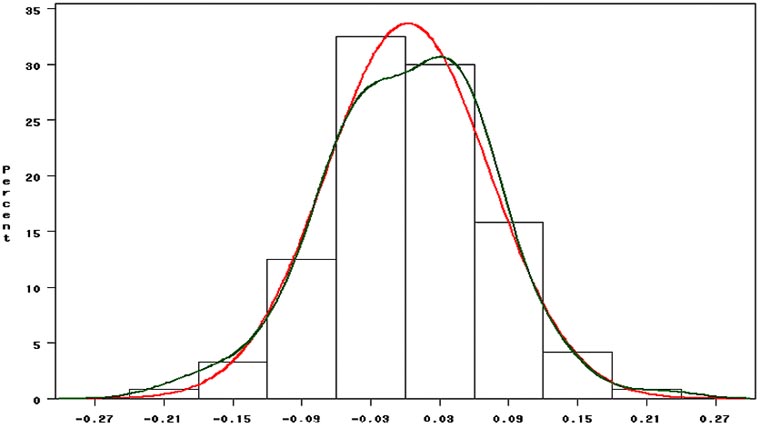
Distribution of volatility in real cotton prices, 1900-2000
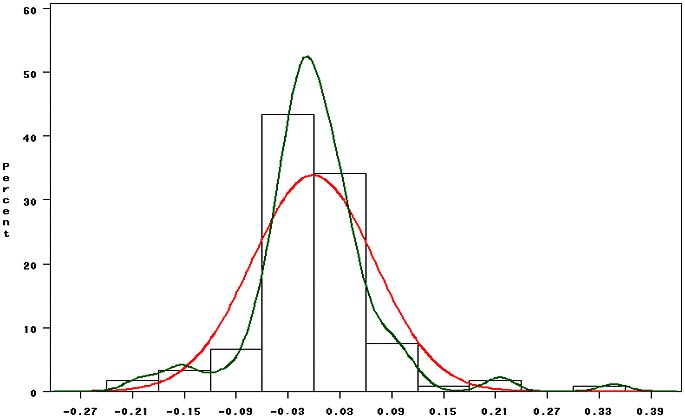
Distribution of volatility in real jute prices, 1900-2000
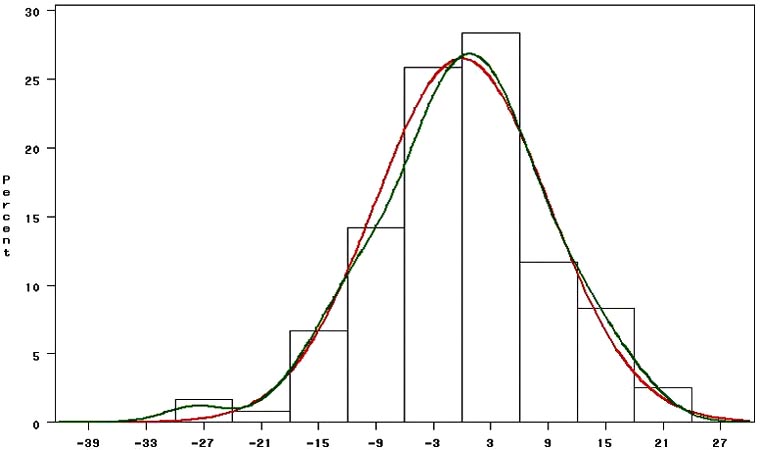
Distribution of volatility in real maize prices, 1900-2000
Distribution of volatility in real palmoil prices, 1990-2000
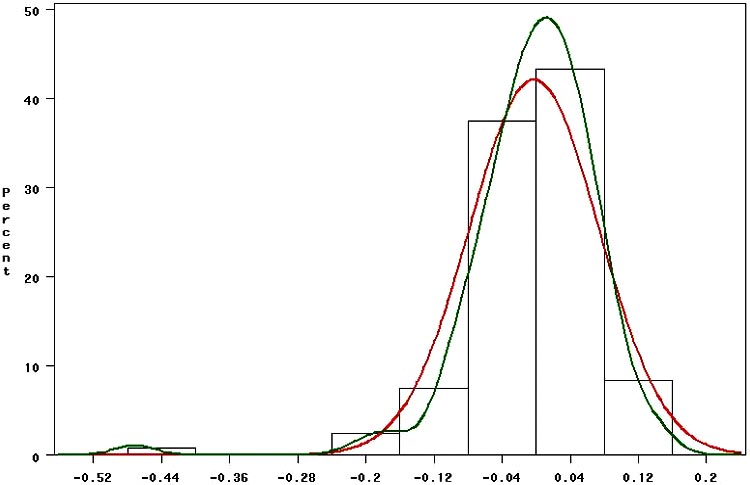
Distribution of volatility real rape oil prices, 1990-2000
Distribution of volatility in real rice prices, 1990-2000
Distribution of volatility in real rapeseed prices, 1990-2000
Distribution of volatility in real rubber prices, 1990-2000
Distribution of volatility in real soybeans prices, 1990-2000
Distribution of volatility in real sisal prices, 1990-2000
Distribution of volatility in real soymeal prices, 1990-2000
Distribution of volatility in real sunflower meal prices, 1990-2000
Distribution of volatility in real sugar prices, 1990-2000
Distribution of volatility in real tea prices, 1990-2000
Distribution of volatility in real wheat prices, 1990-2000
|
[21] For details about this,
see Applied non-parametric regression, Econometric Society Monographs No.
19. |
![]()
![]()
![]()