![]()
![]()
![]()
After several decades of continued increase in the global landings of tuna, production stabilized in the early 1990s, and remained at about the same average level for 7 years. Landings increased during 1998, and stayed high through 2000, but the increases were due to greater catches of one species, skipjack (Figures 1 and 2). Although there is no comprehensive information on the levels of fishing mortality during those years, studies for some of the important fisheries (Hampton, Lewis and Williams, 2000 and IATTC, 2001) suggest that it increased as a result of increased fleet carrying capacity and increased efficiency of the vessels in the fishery. Ideally, if estimates of fleet size were available for the global tuna fleet over the last several decades, it would be possible to examine in detail the relationship between catch and fishing capacity on a global basis, and to examine the possibility that there was more carrying capacity than needed to make the observed harvests. But, as was discussed above, adequate time series of such data are not available, although an estimate of the size of the current global purse seine fleet is presented
Because a long time series of data on fleet carrying capacity is available only for the eastern Pacific Ocean (EPO), a detailed examination of fleet carrying capacity and tuna production for that area is presented, and it can be used to demonstrate how data for other areas can be examined. Table 2 and Figure 7 show data on purse-seine fleet carrying capacity and the catches of tuna made during 1961 to 2000. The trends presented in Figure 7 show an interesting pattern of fluctuations in fleet carrying capacity and tuna catches that highlight the point raised earlier in this document concerning the need for fleet capacity limitations, particularly with respect to yellowfin. As fleet carrying capacity increases the limited quantity of fish available must be shared with increasingly more vessels, and the catch per vessel decreases. Continued fleet growth eventually results in management action to limit the total catch, but as fleets continue to increase, and catches per vessel continue to decrease, the fishing industry tends to resist controls on the catch and may apply pressure on the various governments to loosen or eliminate those controls. This is the classic situation of a “regulated open access fishery” first defined by Homans and Wilen (1997) and discussed more recently by Gréboval and Munro (1999), i.e. a fishery with poorly-defined property rights, coupled with regulations to control the levels of harvest. This scenario is played out fairly clearly in the data presented in Figure 7. In 1966 member governments of the IATTC implemented a conservation programme for yellowfin in the EPO, in the form of an annual total allowable catch. When the catch of yellowfin reached this limit, minus the amounts held in reserve for special allocations, unrestricted fishing for yellowfin in the regulatory area would cease. During the early years of the programme the conservation measures were very successful from a biological point of view, in that the stock of yellowfin was maintained at a high level of abundance. However, fleet carrying capacity began to increase rapidly as a result of high tuna abundance and correspondingly high catch rates. In 1970 the carrying capacity was about 60 000 tonnes, and the catch of yellowfin was about 150 000 tonnes. The demand for tuna for canning and the prices paid to fishermen were increasing. This stimulated the building of new vessels, and the carrying capacity of the fleet increased to about 160 000 tonnes by 1976, and about 180 000 tonnes by 1981. Prior to 1975 the average weight of fish in the catch was about 12 kg. The catch peaked in 1976, but the fleet continued to grow.
As the fleet grew and competition for the fish increased, many vessels increasingly began to target small fish by fishing on schools associated with floating objects, such as logs and marine debris (In fact, a California law prohibiting the landing of fish less than 7.5 pounds was repealed at this time at the behest of the tuna processing industry). These small fish had previously not been heavily fished. Between 1977 and 1983 the size of fish in the catch decreased by one half, to about 6 kg. This decrease in average size reduced the yield per recruit and the total potential yield of the yellowfin population in the EPO. The lower yield from the fishery and the increased fleet size resulted in the closure to unrestricted fishing coming progressively earlier each year. It also resulted in lower annual catches and earnings per vessel. Because of the dire economic situation facing the vessels, many vessel owners pressured their governments to ease the conservation regulations. Because of these pressures, by 1978 it became impossible for the governments to reach agreement to close the fishery in time to stay within the recommended catch limits, and by 1980 the conservation programme had failed completely. By 1982 the catch had declined by more than half, to the low levels of the mid-1960s, when the conservation programme was first implemented, even though during the early 1980s fishing effort was the highest it had ever been. Because of the poor catches in the eastern Pacific vessels began to leave the EPO for newly developed fishing grounds in the western Pacific. Others stayed in port because catch rates were so low, due to lower abundance coupled with a very strong El Niño event that made yellowfin less available to the fishery, so it was not profitable for them to go fishing. From 1983 to 1985, fishing effort stayed low and, the yellowfin stock recovered to considerably higher levels of abundance.
After 1985 vessels began to return from the western Pacific to fish for yellowfin tuna in the EPO, and many of the vessels that had been inactive resumed fishing. Fishing success was very good, the yellowfin catch reaching the highest levels in the history of the fishery during 1986 through 1996; the fleet during that period averaged about 110 000 tonnes of capacity, much less than its previous peak. The size of fish in the catch was large, averaging more than 12 kg, because most of the fishing was done on schools of large tuna associated with dolphins. Because of the good fishing, and apparently high profits, the fleet began to grow through new construction, reactivation of vessels, and transfers from other fisheries. Fleet carrying capacity continues to grow and is currently about 180 000 tonnes. Because of concern over dolphins, increasingly more fishing effort has been applied to non-dolphin schools of fish, particularly fish associated with floating objects, thus decreasing the average size of fish in the catch and possibly the yield per recruit of yellowfin. Most of this non-dolphin associated fishing is done on man-made fish-aggregating devices (FADs). The situation is similar to that during the mid to late 1970s with respect to yellowfin tuna. Even though there are restrictions on the fishery, the fleet continues to grow. This situation has caused concern among the governments of the region over the possibility of repeating the detrimental overfishing and economic events of that earlier period caused by too large a fleet. This concern has resulted in steps to limit fishing capacity in the region.
Figure 7. Trends in the catch of yellowfin tuna, yellowfin, skijack and bigeyecombined, and carrying capacity of purse-seine vessels in the eastern Pacific Ocean
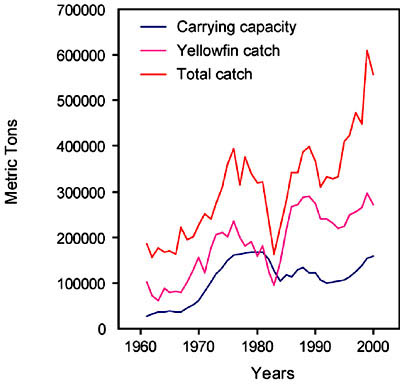
There is, however, one major difference between the situation in the 1970s and early 1980s and the present situation. As explained earlier, fishing on floating objects captures mostly skipjack tuna, with much lesser amounts of small bigeye and yellowfin. Because of opposition to fishing for tuna associated with dolphins, most of the new fishing capacity has concentrated on fishing on FADs, which has substantially increased the catch of skipjack. From 1986 to 1991 skipjack catches averaged about 65 000 tonnes. The catches of this species began to increase when floating-object fishing started to expand in 1992, and by 1999 it had reached an all time high of nearly 270 000 tonnes. It has already been pointed out that the stock of skipjack in the EPO is not fully exploited and can probably sustain increased yields, while yellowfin and bigeye are fully exploited and subject to catch restrictions. The problem is reverting once again to that of a regulated open-access fishery: if the fleet is allowed to continue to increase because of potentially greater skipjack catches, the maintenance of the yellowfin and bigeye conservation programmes will be placed in jeopardy. This same scenario is playing itself out in other fisheries, notably those of the Atlantic and Indian Oceans.
In addition to the conservation problems brought about by having a fishing capacity greater than needed to harvest the available catch (excess capacity), serious economic problems are also created (Bertignac et al, 2001 and 1998). Although it is not the object of this paper to discuss economic problems in the tuna fisheries, the subject is mentioned because it will ultimately affect the success of any tuna management programmes entered into by the nations involved in these matters. The expansion of FAD fishing that was just described for the eastern Pacific is a worldwide phenomenon. World catches of skipjack reached the highest level in the history of the fishery during 1998 (Figure 2). The western Pacific fishery alone produced more than 200 000 tonnes in excess of what it had been producing in previous years. Skipjack catches during 1997 and 1998 were at record highs in the EPO, and the other ocean areas also produced high catches of skipjack. Production of skipjack during 1999 was high again, with that of the EPO reaching an all-time high. The pattern of concentrating fishing effort on FADs and high catches of skipjack prevailed once again during 2000. Coupled with these increased catches of skipjack, nearly all of which is destined for canning, has been a sharp drop in price paid to the vessels. From the beginning of 1998, to the end of that year, the ex-vessel price of skipjack dropped by nearly half. Price continued to decline during 1999, 2000, and early 2001 reaching its lowest level in more than 30 years. Many vessels are fishing at below operating costs and accumulating debt. Some vessels have been de-activated, and others are directing more effort to fishing for yellowfin, because of the slightly higher price. This pressure on yellowfin and bigeye too, creates conservation problems for species that are already heavily exploited, and exacerbates the economic problems caused by the high production of skipjack. Skipjack is a species that has shown great year-to-year variability in catch. This variability appears to be independent of the effects of fishing, and is most likely attributable to changing environmental features that alter abundance. Although the tendency has been towards increasing trends in catch of skipjack, there will continue to be a high level of year-to-year variability in these catches.
It seems obvious that any solutions to the problem of excess capacity will have to ultimately deal with the sort of economic problems mentioned above if there is to be a long-term, rational solution to the problem of excess capacity. Even though there are a number of economic studies dealing with this issue (Morrison, 1985, Squires 1987, Fare, Grosskopf and Kokkelenberg, 1989, Segerson and Squires 1990 and 1993, and Berndt and Fuss, 1989), just how they will be dealt with is a bit uncertain, since the problem of “overcapitalization in fisheries is in fact considerably more complex than that encountered in standard industrial organization economics” (Gréboval and Munro, 1999), and to get governments to focus on the economic problems related to overcapitalization has proven to be very difficult, at best.
The definitions developed by the FAO working groups on capacity have been primarily technical definitions, not economic ones. There is an urgent need to develop such economic definitions as well as quantitative approaches to evaluate overcapitalization and excess capacity in world tuna fisheries. In fact, the FAO meeting on fishing capacity held in Mexico City in 1999 attempted to deal with the issue of overcapitalization, but ended up dealing with the issue of overcapacity in terms of optimal fleet sizes for harvesting target catch levels (TCL), and examined a number of quantitative approaches that could be applied to the problem of determining whether excess capacity exists in certain tuna fisheries. The group concluded that two techniques, Peak-to-Peak and Data Envelopment Analysis, should be applied to a variety of case studies in order to evaluate more fully their benefits and limitations. Because of the availability of a time series of data on fleet carrying capacity and catch, and in keeping with the recommendation of the working group in Mexico City, data for the eastern Pacific tuna fishery have been analyzed by the Data Envelopment Analysis (DEA) approach. The DEA approach was chosen over the Peak to Peak, because the former utilizes more information on the fishery including biological and environmental data and provides more detailed results with which to examine the capacity problem, whereas the latter is more parsimonious with respect to both the data used and the results. Data Envelopment Analysis is also theoretically consistent with economics, whereas Peak-to-Peak is more ad hoc in nature.
Table 2: Carrying capacity of purse-seine vessels, catch of yellowfin, and total catch of yellowfin, skipjack, bigeye and bluefin taken by purse-seine vessels in the Eastern Pacific Ocean, 1961-2001 (mt tonnes)
|
Year |
Capacity |
Yellowfin |
TOTAL |
|
1961 |
27 250 |
102 643 |
184 996 |
|
1962 |
31 163 |
71 452 |
156 210 |
|
1963 |
36 550 |
62 028 |
176 717 |
|
1964 |
36 631 |
88 650 |
167 456 |
|
1965 |
38 728 |
78 898 |
168 961 |
|
1966 |
36 304 |
80 611 |
164 082 |
|
1967 |
36 650 |
79 959 |
222 075 |
|
1968 |
46 012 |
102 016 |
194 293 |
|
1969 |
51 807 |
128 858 |
201 323 |
|
1970 |
61 246 |
155 626 |
226 185 |
|
1971 |
80 668 |
122 839 |
250 643 |
|
1972 |
102 022 |
177 128 |
240 793 |
|
1973 |
119 735 |
205 253 |
274 139 |
|
1974 |
133 449 |
210 364 |
309 620 |
|
1975 |
148 667 |
202 142 |
360 274 |
|
1976 |
160 197 |
236 327 |
394 275 |
|
1977 |
162 294 |
198 816 |
314 327 |
|
1978 |
164 252 |
180 534 |
377 005 |
|
1979 |
167 016 |
189 674 |
340 094 |
|
1980 |
167 855 |
159 425 |
319 800 |
|
1981 |
167 862 |
181 813 |
322 177 |
|
1982 |
152 270 |
125 084 |
235 888 |
|
1983 |
127 640 |
94 256 |
163 741 |
|
1984 |
103 929 |
145 061 |
222 947 |
|
1985 |
117 738 |
216 992 |
280 394 |
|
1986 |
112 606 |
268 274 |
341 208 |
|
1987 |
130 240 |
272 247 |
342 285 |
|
1988 |
133 819 |
288 074 |
388 279 |
|
1989 |
121 277 |
289 375 |
398 340 |
|
1990 |
123 220 |
273 329 |
367 934 |
|
1991 |
106 365 |
239 121 |
309 799 |
|
1992 |
99 971 |
239 849 |
333 408 |
|
1993 |
101 434 |
232 071 |
329 394 |
|
1994 |
104 411 |
219 223 |
333 528 |
|
1995 |
106 019 |
223 776 |
409 050 |
|
1996 |
113 396 |
250 076 |
423 559 |
|
1997 |
125 319 |
256 676 |
473 778 |
|
1998 |
137 946 |
264 426 |
448 152 |
|
1999 |
154 454 |
295 773 |
610 400 |
|
2000 |
158 000 |
272 000 |
557 000 |
|
2001 |
185 000 |
350 000 |
540 000 |
The Data Envelopment Analysis (DEA) approach is a linear programming technique, which utilizes a variety of inputs, developed by economists to consider the issue of inefficiency of business enterprises. The methodology has been adapted to fisheries to examine the issue of overcapacity. Kirkley and Squires (1999b) applied this methodology, using the approach of Fare, Grosskop and Kokkelenberg (1989), and Fare, Grosskop and Lovell (1994) to the fishery for mid-Atlantic sea scallop, Placopecten magellanicus. The methodology can be applied to fisheries for which various levels of data are available. The 1999 FAO Mexico City meeting on Fishing Capacity, discussed the application of this technique at four different levels of data availability: Level 1 - total landings and number of vessels; Level 2 - data on vessel sizes and time spent fishing, plus Level-1 data; Level 3 - catch by species, size structure and vessel type, CPUE, effort, and price, plus Level-2 data; Level 4 - biomass estimates, cost and earnings data, efficiency estimates, plus Level-3 data.
The data used for the analysis of the EPO purse-seine fishery was between Level 3 and Level 4. A time series of data, grouped by vessel size classes, was analysed for 1971 through 2000. Seven size classes, based on metric tonnes of carrying capacity, were used: Class 1 (1-181), Class 2 (182-363), Class 3 (364-726), Class 4 (727-1088), Class 5 (1089-1451), Class 6 (1452-1814) and Class 7 (>1814). Classes 1 and 2 have the lowest catchability coefficients (q) among the seven groups. Classes 3-7 have similar catchability coefficients, but because of size their economic efficiency varies considerably. Catch data, expressed in metric tonnes, were available by years for each of the major species, skipjack, yellowfin, and bigeye, taken in the fishery. Effort for each year was expressed in days fishing; days spent at sea running to and from the fishing grounds, drifting, or not actively fishing were not included in the estimates of days fishing. Catch and effort data computed from individual vessel logbook information, were provided by Dr. Michael Hinton of the IATTC. Biomass estimates of yellowfin and bigeye were provided by Mr. Patrick Tomlinson of the IATTC. Biomass estimates for skipjack were not available. Sea-surface temperature data for the EPO were from Dr. Gary D. Sharp (http://faculty.csumb.edu/SharpGary/world/).
Because individual vessel data were unavailable, the analysis used aggregate data to estimate fishing capacity; therefore it was not possible to examine variation among vessels. Fishing capacity, discussed earlier in this paper, is the maximum amount of fish that can be caught by the purse-seine fleet over a period of time, when fully utilizing its variable inputs under normal operating conditions, given the biomass of the stock being fished, the environmental characteristics of the area fished (temperature in this case), and harvesting technology. The estimates of fishing capacity from the linear model are based on the highest observed catches in a year, and take into account yearly changes in stock biomass and sea-surface temperature. There were two separate outputs from the analysis, one for yellowfin only and the other for yellowfin, bigeye and skipjack combined.
The DEA estimates of fishing capacity are shown in Figure 8 with the observed annual catches of yellowfin tuna and the carrying capacity (hold capacity) of the fleet summed over all size classes. The estimated fishing capacity was relatively low during the early 1970s, climbed rapidly to a peak in 1976, and then declined to a low during 1983; it rose again to a second peak in 1986 and stayed relatively high until the end of the time series. In every year of the series the estimated fishing capacity is well in excess of the observed carrying capacity of the fleet. For the combined fleet, capacity utilization (CU) is less than 1 in every year, indicating that carrying capacity of the purse-seine fleet operating in the EPO is underutilized with respect to yellowfin tuna. The extent of underutilization is not proportional to the values of CU, since the biological average maximum sustainable yield (AMSY) for yellowfin in the EPO is much less than the estimated fishing capacity. The AMSY for yellowfin in the EPO appears to be somewhere around 300 000 tonnes, while the estimate of fishing capacity for yellowfin is above 400 000 tonnes in 25 out of 30 years. If the model used to compute fishing capacity incorporated a function describing sustainable fishing, including the AMSY, into the analysis this would have acted as a constraint on the upper limit of the estimates. Regardless of the apparent overestimation of fishing capacity, it is clear that if the vessels in the fishery were utilized more fully, carrying capacity in the EPO purse-seine tuna fishery could be substantially reduced without reducing the corresponding catch.
The second analysis examined fishing capacity for all species combined. The results are shown in Figure 9. Once again, estimated fishing capacity exceeds observed catch by a large margin in every year. The ratio of observed catch over fishing capacity is shown in Figure 10. CU is also less than one in every year. It would appear once again that fishing capacity is overestimated because the estimation was done without constraining the potential catch of yellowfin and bigeye by their respective yield curves. The results are further confounded by the fact that a sustainable yield curve has not been estimated for skipjack in the EPO. However, the same conclusion drawn for the yellowfin analysis regarding too much carrying capacity in the EPO tuna fleet can be drawn for the combined-species results.
Figure 8. DEA estimated fishing capacity for yellowfin tuna, catch of yellowfin tuna, and carrying capacity of purse-seine vessels in the eastern Pacific Ocean
Figure 9. DEA estimated fishing capacity for the combined catch of yellowfin, bigeye and skipjack tunas, combined catch of yellowfin, skipjack and bigeye, and carrying capacity of purse-seine vessels in the eastern Pacific Ocean
Figure 10. The ratio of total annual catch of tunas to DEA estimated fishing capacity for purse-seine vessels in the eastern Pacific Ocean
Examination of CU by vessel classes provides an opportunity to determine whether all size vessels are underutilized in the fishery. The CUs for the seven vessel classes are:
|
Vessel Size Class |
CU |
|
1 |
1.000 |
|
2 |
1.000 |
|
3 |
1.000 |
|
4 |
0.287 |
|
5 |
0.553 |
|
6 |
1.000 |
|
7 |
1.000 |
On one hand, the estimated CUs for Classes 1, 2, 3, 6, and 7 are equal to one (1), indicating that these vessel classes are fishing at full capacity and no matter how their fishing strategy might be altered, they cannot be expected to produce more tuna than they are currently producing. On the other hand, Classes 4, and 5, have estimated CUs of less than one (1), indicating that they are not fishing at full capacity. In fact, vessel Classes 4 and 5 are the major sources of excess capacity, as reflected in Figures 8 and 9. The source of this excess seems to derive from the number of days fishing. To be fully utilized Classes 4 and 5 would have to increase substantially the number of days they fish during the year.
The conclusion that can be drawn from this DEA is that there are too many purse-seine vessels operating in the tuna fishery of the EPO, and that the carrying capacity of the fleet can be substantially reduced without a corresponding reduction in catch. However, because no upper limit on the estimation of fishing capacity was introduced by the inclusion of a yield curve for yellowfin and bigeye, it is difficult to provide a realistic estimate of just how much the fleet can be reduced.
These results demonstrate the need for further analysis, using data for individual vessels, so that more detailed information concerning the variation among vessels can be evaluated, and the incorporation of information on yield curves for the species being harvested so that the estimates of fishing capacity do not go unrestrained. It would appear that owing to the fact purse-seine vessels may fish in both the EPO and WPO during a single year, future analyses should be done on a Pacific-wide basis.
With the exception of the above DEA for the EPO there are no other published quantitative analyses addressing the issue of capacity in other tuna fisheries. Certainly the present analysis is very limited in scope and does not provide very detailed nor comprehensive results, but it does however, demonstrate that fishing capacity in the tuna purse-seine fishery of the EPO is most likely not fully utilized, and it further demonstrates that the DEA approach provides a useful tool for examining the issue of fishing capacity in tuna fisheries. Although there has been no quantitative analysis conducted for the other fisheries, inferences can be drawn for the other fisheries by comparing their fishing success with the results of the DEA for the EPO purse-seine fleet. For example, if the catch of tunas per ton of carrying capacity of purse-seine vessels for each of the fisheries (EPO, WPO, IND, ATL) is compared with the ratio of fishing capacity estimated by DEA for the EPO (which represents the maximum catch the EPO fleet can make when fully utilized) to the capacity ton of purse-seine vessels, an indication can be gained of whether the fleets of areas other than the EPO are fully utilized. In every comparison the catch per capacity ton is much less than the EPO estimate of fishing capacity per ton of carrying capacity. Catch rates for the various fisheries ranged between 2.5 and 4.0 tonnes of tuna per ton of carrying capacity while the ratio of estimated fishing capacity to carrying capacity was near 8.0. These numbers tend to suggest that, like the fleet in the EPO, the fleets in the other regions are not fully utilized, indicating that the catch of tuna in those areas could be taken be a smaller fleet than currently exists.
![]()
![]()
![]()