![]()
![]()
![]()
Low domestic production of fertilizers and imports limited by scarce foreign exchange have restricted the availability and consumption of fertilizers. Consumption has fallen considerably compared with pre-1990 years. Fertilizer consumption from 1997 to 2000 is shown in Table 1.
Fertilizer consumption in the various provinces is shown in Table 2. North Pyongan, South Hwanghae, South Pyongan, North Hwanghae, South Hamgyong and Kangwon are the major fertilizer consuming provinces.
The average consumption of fertilizers per ha for the two major crops of DPR Korea, main crop rice and maize, in the various provinces is shown in Tables 3 and 4.
Average fertilizer consumption by both the crops is well below the recommended rates for obtaining high yields.
Fertilizer recommendations for spring barley and wheat, as determined by the Academy of Agricultural Sciences (AAS), are given in Table 5.
Domestic fertilizer nitrogen and phosphate requirements were met previously by the national fertilizer industry. However, the shortage of foreign exchange to buy the required feedstock and the raw materials has put constraints on domestic fertilizer production. Installed capacities have been affected also by technological obsolescence, ageing plants, difficulties in the replacement of old equipment and the provision of spares.
|
Table 1 |
|||
|
Year |
N |
P205 |
K2O |
|
1997 |
127.7 |
24.6 |
22.8 |
|
1998 |
92.8 |
18.2 |
7.2 |
|
1999 |
134.0 |
24.9 |
28.0 |
|
2000 |
110.9 |
19.9 |
32.3 |
|
Table 2 |
||||
|
Province |
Averages 1998 to 2000 |
|||
|
N |
P2O5 |
K2O |
Total |
|
|
Pyongyang |
6 |
1 |
2 |
8 |
|
South Pyongan |
16 |
3 |
3 |
22 |
|
North Pyongan |
21 |
4 |
4 |
29 |
|
Jagang |
5 |
1 |
1 |
7 |
|
South Hwanghae |
22 |
6 |
5 |
34 |
|
North Hwanghae |
10 |
2 |
3 |
15 |
|
Kangwon |
8 |
1 |
1 |
10 |
|
South Hamgyong |
11 |
1 |
2 |
14 |
|
North Hamgyong |
6 |
1 |
1 |
7 |
|
Ryanggong |
2 |
0.2 |
0.5 |
3 |
|
Kaesong |
2 |
0.4 |
0.5 |
3 |
|
Nampo |
3 |
0.5 |
1 |
5 |
|
Total |
112 |
21 |
23 |
157 |
|
Table 3 |
||||
|
Province |
N |
P2O5 |
K2O |
Total |
|
Pyongyang |
100 |
16 |
2 |
118 |
|
South Pyongan |
87 |
14 |
3 |
104 |
|
North Pyongan |
96 |
16 |
4 |
116 |
|
Jagang |
76 |
11 |
1 |
88 |
|
South Hwanghae |
90 |
21 |
5 |
116 |
|
North Hwanghae |
72 |
15 |
3 |
90 |
|
Kangwon |
82 |
11 |
1 |
94 |
|
South Hamgyong |
80 |
8 |
2 |
90 |
|
North Hamgyong |
83 |
7 |
1 |
91 |
|
Ryanggong |
50 |
0 |
0,5 |
51 |
|
Kaesong |
78 |
20 |
0,5 |
98 |
|
Nampo |
80 |
19 |
1 |
100 |
|
Average |
81 |
13 |
2 |
96 |
|
Table 4 |
||||
|
Province |
N |
P2O5 |
K2O |
Total |
|
Pyongyang |
66 |
15 |
16 |
97 |
|
South Pyongan |
61 |
14 |
14 |
89 |
|
North Pyongan |
64 |
14 |
17 |
95 |
|
Jagang |
67 |
13 |
10 |
90 |
|
South Hwanghae |
65 |
18 |
19 |
101 |
|
North Hwanghae |
50 |
13 |
14 |
76 |
|
Kangwon |
56 |
9 |
5 |
70 |
|
South Hamgyong |
54 |
11 |
11 |
76 |
|
North Hamgyong |
51 |
9 |
6 |
67 |
|
Ryanggong |
68 |
5 |
5 |
78 |
|
Kaesong |
66 |
16 |
15 |
97 |
|
Nampo |
71 |
17 |
16 |
104 |
|
Average |
58 |
12 |
11 |
81 |
|
Table 5 |
||
|
Nutrient |
Rate (kg/ha) |
Timing |
| |
|
|
|
Nitrogen |
100 |
Split application at basal, tillering and panicle initiation stages with 50%, 20% and 30% respectively. |
|
Phosphorus |
30 |
Basal Application |
|
Potash |
30 |
Basal Application |
Nitrogenous fertilizers are produced at three major units, located at Hungnam, Namhueng and Undok County. Urea, ammonium nitrate and ammonium sulphate are the three main types of fertilizer produced by these units. Urea plants located at Namhueng and Hungnam use naphtha and coal as feedstock. Ammonium nitrate production at Hungnam is based on water electrolysis. The July 7 Complex at Undok county uses fuel oil as feedstock. The production capacity of the units is given in Table 6. The capacity utilization of these plants is low.
|
Table 6 |
||||
|
Production Unit |
Product |
Capacity '000 MT |
|
|
|
Product |
N |
|||
|
Hungnam |
Urea |
170 |
78 |
|
|
Amm. nitrate |
180 |
61 |
||
|
Amm. sulphate |
170 |
35 |
||
|
Namhueng |
Urea |
360 |
161 |
|
|
Amm. sulphate |
4 |
0.8 |
||
|
July 7 Chemical Complex, Undok |
Amm. nitrate |
80 |
27 |
|
Single superphosphate (SSP) is produced domestically. Low-grade rock phosphate reserves are mined at several locations. Sulphuric acid requirements are met through imports. Some quantities are also available through fractionation of crude naphtha at the refineries.
DPR Korea has no known reserves of potash and depends on imports to meet its potash requirements.
Domestic fertilizer production in 1998/99 and 1999/2000 is given in Table 7.
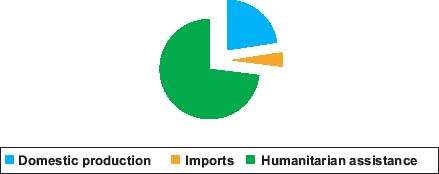
Table 8 shows the availability of total fertilizer nutrients from different sources and Table 9 the individual nutrients from different sources.
It can be seen from these tables that humanitarian assistance has played a significant role in providing the support for the agricultural production programme.
There was a substantial decrease in fertilizer availability from domestic production during the year 1999/2000 (July to August) compared with the previous year. The imports also were also lower. Although availability through humanitarian assistance improved compared with the previous year, it was not sufficient to fill the overall gap.
|
Table 7 |
||||
|
Year |
N |
P2O5 |
K2O |
Total |
|
1998/99 |
79.6 |
4.4 |
9.0 |
93.0 |
|
1999/2000 |
33.2 |
0.8 |
3.5 |
37.5 |
|
Table 8 |
|||
|
Source/Year |
1998/99 |
1999/2000 |
2000/01* |
|
Production & imports |
115 (51%) |
45 (27%) |
24 (15%) |
|
Humanitarian assistance |
110 (49%) |
121 (71%) |
130 (82%) |
|
Carry over |
0 |
4 (2%) |
6 (4%) |
|
Total |
225 |
170 |
160 |
|
* 2000/2001: fi gures for ten months. |
|||
|
Table 9 |
||||
|
Item |
N |
P2O5 |
K2O |
Total |
|
Domestic production |
33.2 |
0.8 |
3.5* |
37.5 |
|
Imports |
7.8 |
nil |
nil |
7.8 |
|
Humanitarian assistance |
79.8 |
18.9 |
22.5 |
121.2 |
|
Carried over from 1999 |
3.6 |
nil |
nil |
3.6 |
|
Application in agriculture |
111.0 |
20.0 |
27.0 |
158 |
|
Stocks (as of September 2000) |
3.2 |
0.5 |
0.2 |
3.9 |
|
* Manufactured from imported material |
||||
Figure 3 Fertilizer supplies from different sources, 1999/2000 ('000 tonnes of nutrients)
![]()
![]()
![]()