

1. GENERAL ECONOMIC SITUATION - 2002
The Thai economy grew by 5.2 percent in 2002 compared to 1.9 percent in 2001. The continual growth was supported by domestic demand, particularly private consumption and private investment, as well as export volume, which increased significantly in the second quarter. Low interest rates and government measures to revive demand for real estate were the main factors to stimulate domestic demand.
Thailand's economic outlook for 2002
1999 |
Preliminary |
Estimate (as of 17.03.03) | ||
2000 |
2001 |
2002 | ||
GDP (Current prices: billion baht) |
4 637 |
4 917 |
5 123 |
5 431 |
GDP growth rate (1988 price, %) |
4.4 |
4.6 |
1.9 |
5.2 |
Investment (1988 price, %) |
-3.2 |
5.3 |
0.9 |
6.3 |
Private (1988 price, %) |
-3.3 |
16.8 |
4.7 |
13.3 |
Public (1988 price, %) |
-3.1 |
-9.7 |
-5.5 |
-6.8 |
Consumption (1988 price, %) |
4.1 |
4.5 |
3.6 |
4.1 |
Private (1988 price, %) |
4.3 |
4.9 |
3.7 |
4.7 |
Public (1988 price, %) |
3.2 |
2.6 |
2.9 |
0.5 |
Export value (Billions of US$) |
56.8 |
67.9 |
63.2 |
66.9 |
Growth rate (%) |
7.4 |
19.5 |
-6.9 |
5.7 |
Import value (Billions of US$) |
47.5 |
62.4 |
60.7 |
63.4 |
Growth rate (%) |
17.0 |
31.3 |
-2.8 |
4.6 |
Inflation (%) - Consumer price index |
0.3 |
1.5 |
1.6 |
0.7 |
Source: National Economic and Social Development Board, March 17, 2003
2. PERFORMANCE OF THE PULP AND PAPER INDUSTRY - 2002
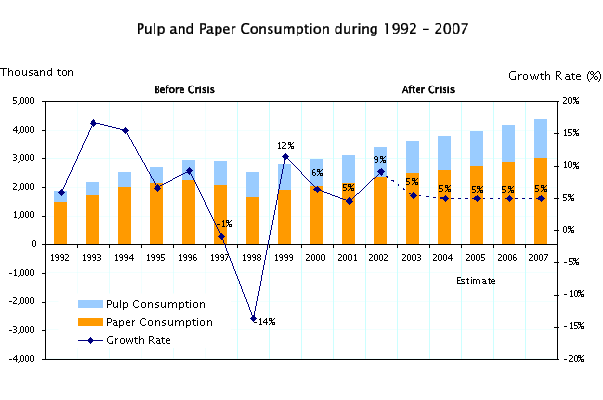
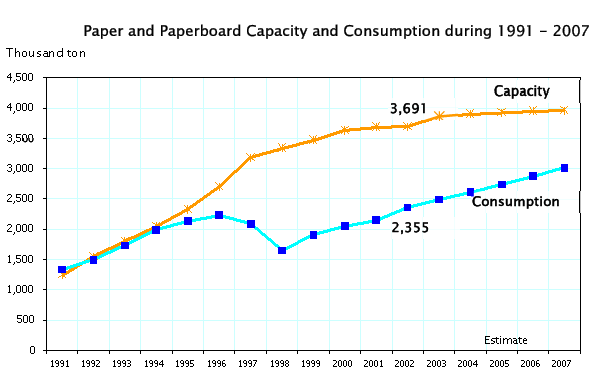
As a result of the economic recovery, the pulp and paper consumption in Thailand grew by 9 percent over the last year. The consumption of pulp reached 1.0 million tonnes whereas paper and paperboard consumption was 2.4 million tonnes.
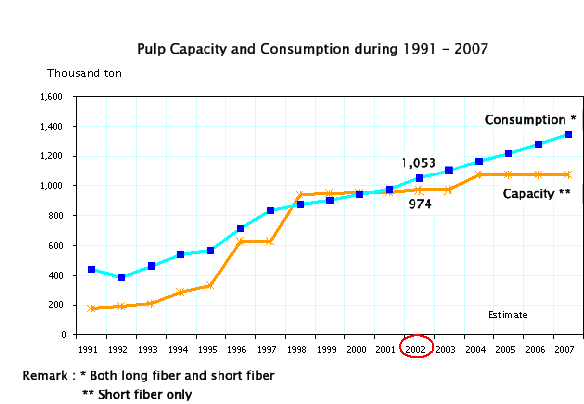
Total pulp and paper production capacity was 4.7 million tonnes in 2002: 1.0 million tonnes for short fibre pulp and 3.7 million tonnes for paper and paperboard. The overall industry utilization rate improved slightly by 2 percent from last year to 78 percent.
Performance of the industry
Product |
Consumption |
Production |
Capacity |
Utilization |
Pulp |
1 053 |
953 |
974 |
98% |
Paper and Paperboard |
2 355 |
2 698 |
3 691 |
73% |
Pulp and Paper |
3 408 |
3 651 |
4 665 |
78% |
Year 2002, unit: thousand tonne

THE PULP INDUSTRY
a. Consumption, production and trade
Domestic pulp production capacity totalled 974 000 tonnes. Bleached Eucalyptus pulp of 842 000 tonnes accounted for 86 percent of total capacity while other grades (bagasse, bamboo, kenaf and chemithermomechanical) had a combined capacity of 132 000 tonnes. Without long fibre production in the country, Thailand relied on the import of long fibre pulp for its papermaking requirement.
The machine utilization rate was 98 percent. Most of the outputs were to supply the domestic paper mills while the balance was exported.
Production capacity of the five major producers (`000 tonnes)
Producer |
Capacity |
Grade |
1. Advance Agro |
457 |
Eucalyptus |
2. Phoenix Pulp and Paper |
220 |
Eucalyptus, Bamboo, Kenaf |
3. Panjapol Pulp |
110 |
Eucalyptus |
4. Siam Pulp and Paper |
107 |
Bagasse, CTMP |
5. Siam Cellulose |
80 |
Eucalyptus |
Total |
974 |
Domestic pulp consumption was up 8 percent from last year, reaching 1 053 000 tonnes, of which 790 000 tonnes were short fibre and 263 000 tonnes long fibre. The rising pulp demand was driven by growing consumption of paper, particularly in printing and writing paper and kraft paper.

In 2002, the imports of pulp were 392 000 tonnes, up 21 percent from the previous year. Long fibre accounted for 93 percent of the total of import of pulp. Major exporting countries to Thailand were Canada, the United States, Sweden, Chile, Russia and South Africa.
Pulp export decreased from 347 000 tonnes to 191 000 tonnes due mainly to the rebound in domestic demand for paper. Main export markets were China, Korea, Australia, Indonesia, Taiwan and Malaysia.
Import and export of pulp
Year |
Long Fibre |
Short Fibre | ||
Import |
Export |
Import |
Export | |
2000 |
328 |
- |
31 |
254 |
2001 |
307 |
- |
16 |
347 |
2002 |
363 |
- |
29 |
191 |
Unit: thousand tonne
Recovered paper
Recovered paper consumption, used mostly in kraft paper, paperboard and newsprint paper production, rose from last year by 5 percent to 1.8 million tonnes. Recovery rate improved to 53 percent, up 7 percent from last year. Total collected volume in the country reached 972 000 tonnes, resulting from an environmental protection campaign and a better collection promotion program by government.
Thailand is a net exporter of paper, resulting in insufficient recovered paper to supply the local paper producers. In 2002, total imports were 879 000 tonnes, a decrease of 7 percent from last year. The largest imported grade was old corrugated carton (73%) in proportion, followed by 14 percent mixed waste and 13 percent old newspaper. The imports were mainly from the United States, Japan, and Singapore.
Recovered paper
Year |
Consumption |
Import |
Export |
Collected |
Recovery Rate (%) |
2000 |
1 728 |
952 |
- |
776 |
45 |
2001 |
1 765 |
947 |
1 |
819 |
46 |
2002 |
1 848 |
879 |
3 |
972 |
53 |
Unit: thousand tonne
b. Outlook for the future
The industry demand in the next five years is projected to rise by 0.9 million tonnes, for an average annual growth rate of 5 percent. Growth in the industry continues to be driven largely by the growth in domestic consumption and the export sector.
For the pulp industry, domestic consumption is estimated to grow by 5 percent, as a result of continual growth in demand in the paper industry. A new bagasse pulp mill is planned to start operation in the next two years with an annual capacity of 100 000 tonnes. Consequently, the capacity of short fibre production will be increased to 1.1 million tonnes.
Demand for recovered paper is projected to rise by 4 percent in line with the estimated growth in kraft paper industry. Although the domestic collected volume has continuously increased and pushed the recovery rate up to 53 percent in 2002, however, the country still has to import recovered paper as well as high quality old corrugated carton.
Outlook
Year |
2001 |
2002 |
2003* |
2004* |
2005* |
2006* |
2007* |
Demand |
|||||||
Short Fibre |
620 |
790 |
830 |
871 |
915 |
960 |
1 008 |
Long Fibre |
356 |
263 |
276 |
290 |
305 |
320 |
336 |
S. Total |
976 |
1 053 |
1 106 |
1 161 |
1 220 |
1 280 |
1 344 |
Recovered paper |
1 765 |
1 848 |
1 922 |
1 999 |
2 079 |
2 162 |
2 249 |
Total Fibre |
2 741 |
2 901 |
3 028 |
3 160 |
3 299 |
3 442 |
3 593 |
Capacity |
|||||||
Short Fibre |
958 |
974 |
974 |
1 074 |
1 074 |
1 074 |
1 074 |
Long Fibre |
- |
- |
- |
- |
- |
- |
- |
Surplus (Shortage) |
|||||||
Short Fibre |
338 |
184 |
144 |
203 |
159 |
114 |
66 |
Long Fibre |
(356) |
(263) |
(276) |
(290) |
(304) |
(320) |
(336) |
* estimated
Unit: thousand tonne
THE PAPER INDUSTRY
a. Consumption, production and trade
The production capacity of paper slightly increased due mainly to modernization and debottlenecking programs of paper mills. Total capacity was 3.7 million tonnes. Kraft paper has the biggest share of capacity at 60 percent, followed by 27 percent of printing & writing paper.
In 2002, the utilization rate improved slightly by 3 percent from 70 to 73 percent, resulting from an increase in paper consumption.
Consumption, production and trade by grade
Grade |
Consumption |
Production |
Capacity |
Utilization | |||
Volume |
% of total |
Volume |
% of total |
Volume |
% of total | ||
Kraft |
1 260 |
54 |
1 473 |
55 |
2 196 |
60 |
67% |
P&W |
575 |
24 |
811 |
30 |
1 003 |
27 |
81% |
Paperboard |
205 |
9 |
197 |
7 |
283 |
8 |
70% |
Newsprint |
245 |
10 |
126 |
5 |
126 |
3 |
100% |
Household & Sanitary |
70 |
3 |
91 |
3 |
83 |
2 |
100% |
Total |
2 169 |
100 |
2 698 |
100 |
3 691 |
100 |
73% |
Year 2002 Unit: thousand tonne
In 2002, total paper consumption went up to 2.3 million tonnes, a growth of 10 percent over that of the previous year. Per capita consumption of paper was 37 kg, up 3 kg from last year.
The paper consumption growth was driven mainly by an increase in the export sector and a continuing growth in domestic demand. Kraft paper grew significantly by 12 percent while growth in paperboard was up 7 percent. For printing and writing paper, domestic consumption increased by 9 percent as a result of the continual economic recovery which led to higher demand for printing and advertising materials especially in direct mail business.

The import of paper was 462 000 tonnes, an increase of 17 percent compared to that of last year. Newsprint paper, the biggest imported grade with 156 000 tonnes, accounted for 34 percent of total imports due to a shortfall in capacity and inventory building up from some publishers. Major exporters to Thailand were Japan, the United Kingdom, Singapore, Indonesia, Germany and Sweden.
Export was used as a means to balance the surplus production over the domestic demand. Export volume totalled 683 000 tonnes. Kraft paper accounted for 45 percent while printing and writing paper accounted for 44 percent of total export volumes. Main export markets were in Asia-Pacific regions such as China, Hong Kong, Malaysia, Taiwan, Philippines and Singapore.
Import
Import |
Kraft Paper |
P&W Paper |
Paperboard |
Newsprint |
Sanitary |
Others |
2000 |
48 |
106 |
42 |
149 |
10 |
65 |
2001 |
46 |
89 |
40 |
137 |
11 |
69 |
2002 |
92 |
113 |
12 |
156 |
12 |
77 |
Unit: thousand tonne
Export
Export |
Kraft Paper |
P&W Paper |
Paperboard |
Newsprint |
Sanitary |
Others |
2000 |
379 |
291 |
3 |
3 |
34 |
62 |
2001 |
346 |
325 |
8 |
5 |
38 |
45 |
2002 |
304 |
299 |
4 |
9 |
34 |
33 |
Unit: thousand tonne
b. Outlook for the future
For the paper industry, the consumption of paper is expected to increase by 6 percent, reaching 2.5 million tonnes in 2003. The additional capacity from Asia Kraft Paper of 150 000 tonnes of kraft paper has already started a trial run in the Samut Sakorn province (PPI Asia News, March 11, 2003). In addition, 10 000 tonnes of newsprint paper will be added up within 2003. If those projects would be completed as planned, total paper production capacity will reach 3.8 million tonnes in 2003.
Outlook by type
Year |
2001 |
2002 |
2003* |
2004* |
2005* |
2006* |
2007* | |
Kraft paper |
Consumption |
1 129 |
1 260 |
1 323 |
1 389 |
1 458 |
1 531 |
1 607 |
Capacity |
2 196 |
2 196 |
2 346 |
2 346 |
2 346 |
2 346 |
2 346 | |
Surplus (shortage) |
1 067 |
936 |
1 023 |
957 |
888 |
815 |
739 | |
Printing & writing paper |
Consumption |
536 |
575 |
621 |
652 |
685 |
719 |
755 |
Capacity |
998 |
1 003 |
1 003 |
1 043 |
1 063 |
1 073 |
1 083 | |
Surplus (shortage) |
462 |
428 |
382 |
391 |
378 |
354 |
328 | |
Paperboard |
Consumption |
192 |
205 |
215 |
225 |
236 |
247 |
259 |
Capacity |
283 |
283 |
283 |
283 |
283 |
283 |
283 | |
Surplus (shortage) |
91 |
78 |
68 |
58 |
47 |
36 |
24 | |
Newsprint |
Consumption |
236 |
245 |
255 |
265 |
275 |
285 |
295 |
Capacity |
126 |
126 |
136 |
136 |
136 |
136 |
136 | |
Surplus (shortage) |
(119) |
(119) |
(119) |
(129) |
(139) |
(149) |
(159) | |
Household & sanitary paper |
Consumption |
65 |
70 |
75 |
80 |
85 |
90 |
95 |
Capacity |
81 |
83 |
87 |
91 |
96 |
108 |
108 | |
Surplus (shortage) |
16 |
13 |
12 |
11 |
11 |
18 |
13 | |
Total paper and board |
Consumption |
2 148 |
2 355 |
2 489 |
2 611 |
2 739 |
2 872 |
3 011 |
Capacity |
3 684 |
3 691 |
3 855 |
3 899 |
3 924 |
3 946 |
3 956 | |
Surplus (shortage) |
1 536 |
1 336 |
1 366 |
1 288 |
1 185 |
1 074 |
945 | |
Population (million) |
62.3 |
63.0 |
63.5 |
64.0 |
64.5 |
65.0 |
65.5 | |
Per capita consumption (kg/person) |
34 |
37 |
39 |
41 |
42 |
44 |
46 | |
Unit: thousand tonne