![]()
![]()
![]()
| Table A.3. Comparison between probit and spatial probit in the headcount index and in the percentage of poor people at county level, urban sample | ||||||
|
County |
Total poor |
Total pop. |
% poor |
Difference [((b-a)/b)*100] |
||
|
Bigman (a) |
Spatial p. (b) |
Bigman (a) |
Spatial p. (b) |
|||
|
Cuenca |
23 672 |
26 660 |
194 981 |
12.1 |
13.7 |
11.208 |
|
Gualaceo |
4 111 |
4 393 |
8 572 |
48.0 |
51.2 |
6.423 |
|
Guaranda |
4 566 |
5 029 |
15 730 |
29.0 |
32.0 |
9.198 |
|
Azogues |
7 830 |
8 462 |
21 060 |
37.2 |
40.2 |
7.468 |
|
Cañar |
6 412 |
6 810 |
11 179 |
57.4 |
60.9 |
5.851 |
|
La Troncal |
14 510 |
14 944 |
22 730 |
63.8 |
65.7 |
2.905 |
|
Tulcan |
16 040 |
17 245 |
37 069 |
43.3 |
46.5 |
6.993 |
|
Montufar |
5 849 |
6 276 |
11 973 |
48.9 |
52.4 |
6.804 |
|
Latacunga |
11 880 |
12 533 |
39 882 |
29.8 |
31.4 |
5.204 |
|
La Mana |
5 077 |
5 293 |
8 900 |
57.0 |
59.5 |
4.074 |
|
Pujili |
1 274 |
1 366 |
5 305 |
24.0 |
25.7 |
6.704 |
|
Salcedo |
2 220 |
2 394 |
7 582 |
29.3 |
31.6 |
7.249 |
|
Riobamba |
19 657 |
21 753 |
94 505 |
20.8 |
23.0 |
9.635 |
|
Alausi |
2 526 |
2 739 |
5 399 |
46.8 |
50.7 |
7.793 |
|
Guano |
3 251 |
3 480 |
6 584 |
49.4 |
52.9 |
6.584 |
|
Machala |
41 533 |
42 799 |
144 197 |
28.8 |
29.7 |
2.959 |
|
Arenillas |
4 836 |
5 055 |
11 586 |
41.7 |
43.6 |
4.347 |
|
El Guabo |
5 743 |
5 929 |
11 103 |
51.7 |
53.4 |
3.151 |
|
Huaquillas |
17 349 |
17 848 |
27 632 |
62.8 |
64.6 |
2.791 |
|
Pasaje |
16 024 |
17 069 |
34 849 |
46.0 |
49.0 |
6.124 |
|
Piñas |
3 732 |
3 958 |
10 162 |
36.7 |
38.9 |
5.718 |
|
Portovelo |
2 271 |
2 371 |
5 684 |
40.0 |
41.7 |
4.242 |
|
Santa Rosa |
16 261 |
17 149 |
36 387 |
44.7 |
47.1 |
5.181 |
|
Zaruma |
2 298 |
2 472 |
7 397 |
31.1 |
33.4 |
7.020 |
|
Esmeraldas |
41 221 |
45 619 |
112 831 |
36.5 |
40.4 |
9.640 |
|
Quininde |
11 871 |
12 096 |
18 647 |
63.7 |
64.9 |
1.865 |
|
San Lorenzo |
8 050 |
8 375 |
11 230 |
71.7 |
74.6 |
3.881 |
|
Guayaquil |
333 578 |
493 451 |
1 535 393 |
21.7 |
32.1 |
32.399 |
|
Alfredo Baquerizo Moreno |
4 009 |
4 303 |
5 979 |
67.1 |
72.0 |
6.832 |
|
Balao |
4 792 |
4 992 |
6 548 |
73.2 |
76.2 |
4.002 |
|
Balzar |
14 416 |
15 517 |
22 883 |
63.0 |
67.8 |
7.096 |
|
Daule |
13 076 |
13 829 |
25 590 |
51.1 |
54.0 |
5.446 |
|
Duran |
29 086 |
32 004 |
82 359 |
35.3 |
38.9 |
9.119 |
|
El Empalme |
14 791 |
15 807 |
26 362 |
56.1 |
60.0 |
6.433 |
|
El Triunfo |
10 275 |
10 601 |
17 311 |
59.4 |
61.2 |
3.072 |
|
Milagro |
39 938 |
42 203 |
93 637 |
42.7 |
45.1 |
5.365 |
|
Naranjal |
15 084 |
14 745 |
15 998 |
94.3 |
92.2 |
-2.302 |
|
Naranjito |
7 688 |
8 155 |
17 121 |
44.9 |
47.6 |
5.724 |
|
Palestina |
3 012 |
3 191 |
5 308 |
56.7 |
60.1 |
5.628 |
|
Pedro Carbo |
13 037 |
13 715 |
19 980 |
65.3 |
68.6 |
4.940 |
|
Salinas |
12 425 |
13 037 |
27 132 |
45.8 |
48.1 |
4.694 |
|
Samborondon |
6 051 |
6 709 |
17 471 |
34.6 |
38.4 |
9.808 |
|
Santa Elena |
38 401 |
40 159 |
59 672 |
64.4 |
67.3 |
4.377 |
|
Santa Lucia |
4 186 |
4 310 |
6 530 |
64.1 |
66.0 |
2.878 |
|
Urbina Jado |
5 265 |
5 536 |
7 206 |
73.1 |
76.8 |
4.890 |
|
Yaguachi |
9 486 |
10 061 |
16 245 |
58.4 |
61.9 |
5.714 |
|
Playas |
11 167 |
11 636 |
19 544 |
57.1 |
59.5 |
4.032 |
|
Lomas De Sargentillo |
6 336 |
6 569 |
9 205 |
68.8 |
71.4 |
3.546 |
|
La Libertad |
31 389 |
32 763 |
53 108 |
59.1 |
61.7 |
4.193 |
|
General Antonio Elizalde (Bucay) |
2 172 |
2 373 |
5 078 |
42.8 |
46.7 |
8.499 |
|
Ibarra |
35 140 |
37 695 |
80 991 |
43.4 |
46.5 |
6.779 |
|
Antonio Ante |
7 146 |
7 769 |
14 030 |
50.9 |
55.4 |
8.028 |
|
Cotacachi |
2 669 |
2 787 |
6 051 |
44.1 |
46.1 |
4.217 |
|
Otavalo |
9 542 |
9 948 |
21 548 |
44.3 |
46.2 |
4.076 |
|
Loja |
25 907 |
27 755 |
94 305 |
27.5 |
29.4 |
6.660 |
|
Calvas |
4 114 |
4 478 |
10 106 |
40.7 |
44.3 |
8.134 |
|
Catamayo |
8 251 |
8 692 |
13 458 |
61.3 |
64.6 |
5.076 |
|
Macara |
5 654 |
6 186 |
11 032 |
51.3 |
56.1 |
8.600 |
|
Paltas |
2 397 |
2 556 |
5 555 |
43.2 |
46.0 |
6.208 |
|
Babahoyo |
20 220 |
21 291 |
56 731 |
35.6 |
37.5 |
5.031 |
|
Montalvo |
2 276 |
2 430 |
7 455 |
30.5 |
32.6 |
6.356 |
|
Quevedo |
32 225 |
34 638 |
88 306 |
36.5 |
39.2 |
6.968 |
|
Urdaneta |
3 158 |
3 274 |
6 740 |
46.8 |
48.6 |
3.561 |
|
Ventanas |
12 665 |
13 587 |
23 217 |
54.6 |
58.5 |
6.786 |
|
Vinces |
8 839 |
9 797 |
17 512 |
50.5 |
55.9 |
9.779 |
|
Buena Fe |
9 774 |
10 253 |
19 478 |
50.2 |
52.6 |
4.678 |
|
Valencia |
4 207 |
4 468 |
7 913 |
53.2 |
56.5 |
5.854 |
|
Mocache |
3 031 |
3 301 |
5 373 |
56.4 |
61.4 |
8.170 |
|
Portoviejo |
29 543 |
31 300 |
139 493 |
21.2 |
22.4 |
5.613 |
|
Bolivar (De Manabi) |
4 537 |
4 872 |
12 122 |
37.4 |
40.2 |
6.880 |
|
Chone |
14 188 |
15 088 |
41 437 |
34.2 |
36.4 |
5.961 |
|
El Carmen |
12 908 |
13 570 |
25 291 |
51.0 |
53.7 |
4.882 |
|
Jipijapa |
18 434 |
19 180 |
33 115 |
55.7 |
57.9 |
3.894 |
|
Manta |
43 404 |
46 247 |
128 115 |
33.9 |
36.1 |
6.148 |
|
Montecristi |
13 399 |
14 203 |
22 425 |
59.7 |
63.3 |
5.665 |
|
Pajan |
3 320 |
3 503 |
5 489 |
60.5 |
63.8 |
5.219 |
|
Rocafuerte |
3 476 |
3 725 |
8 844 |
39.3 |
42.1 |
6.679 |
|
Santa Ana |
2 218 |
2 362 |
6 368 |
34.8 |
37.1 |
6.083 |
|
Sucre |
16 865 |
18 141 |
37 637 |
44.8 |
48.2 |
7.033 |
|
Tosagua |
3 050 |
3 243 |
7 412 |
41.1 |
43.8 |
5.981 |
|
Pedernales |
3 160 |
3 280 |
5 449 |
58.0 |
60.2 |
3.656 |
|
Puerto Lopez |
5 548 |
5 745 |
8 043 |
69.0 |
71.4 |
3.443 |
|
Jaramijo |
5 182 |
5 412 |
7 726 |
67.1 |
70.1 |
4.261 |
|
Morona |
2 996 |
3 160 |
8 246 |
36.3 |
38.3 |
5.169 |
|
Tena |
2 052 |
2 225 |
7 873 |
26.1 |
28.3 |
7.774 |
|
Pastaza |
2 520 |
2 848 |
14 438 |
17.5 |
19.7 |
11.505 |
|
Quito |
98 089 |
144 878 |
1 201 954 |
8.2 |
12.1 |
32.296 |
|
Cayambe |
4 132 |
4 204 |
17 090 |
24.2 |
24.6 |
1.707 |
|
Mejia |
2 312 |
2 397 |
9 379 |
24.6 |
25.6 |
3.574 |
|
Rumiñahui |
5 704 |
6 507 |
37 595 |
15.2 |
17.3 |
12.347 |
|
Sto Domingo De Los Colorados |
34 305 |
35 769 |
122 564 |
28.0 |
29.2 |
4.092 |
|
Ambato |
18 040 |
20 220 |
124 166 |
14.5 |
16.3 |
10.781 |
|
Baños |
2 919 |
3 085 |
9 501 |
30.7 |
32.5 |
5.362 |
|
Pelileo |
1 221 |
1 273 |
5 954 |
20.5 |
21.4 |
4.091 |
|
Pillaro |
1 033 |
1 111 |
5 146 |
20.1 |
21.6 |
7.006 |
|
Zamora |
2 405 |
2 579 |
8 048 |
29.9 |
32.1 |
6.776 |
|
Orellana |
3 551 |
3 781 |
7 805 |
45.5 |
48.4 |
6.098 |
|
Total |
1 497 815 |
1 771 445 |
5 597 559 |
26.7 |
31.6 |
15.506 |
Figure A.4. Percentage of poor people per county, urban sample
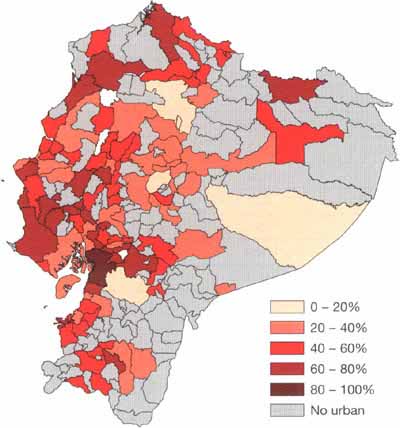
Figure A.5. Comparison between probit method and spatial probit at county level, urban sample
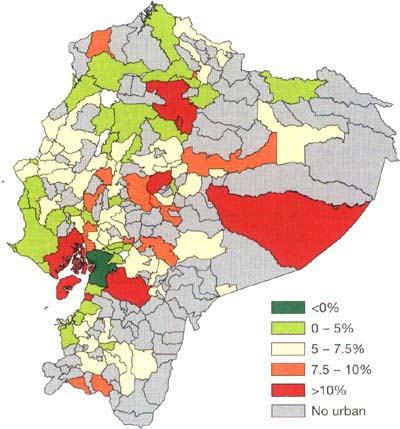
Figure A.6. Comparison between probit method and spatial probit at province level, total sample
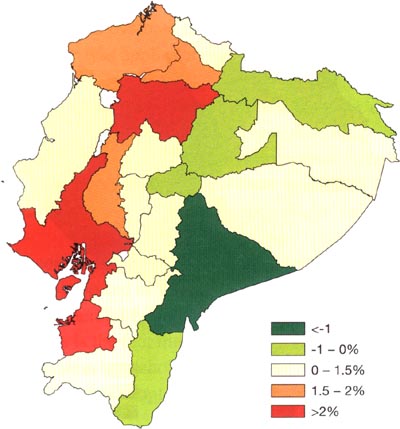
Figure A.7. Percentage of poor people per province, rural sample
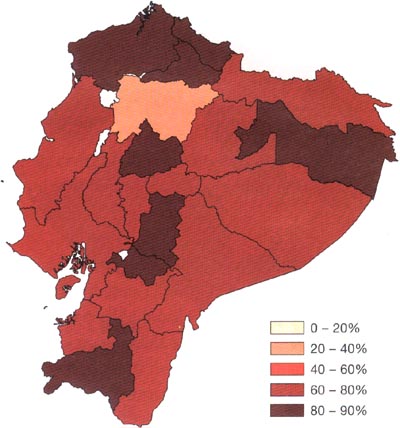
Figure A.8. Comparison between probit method and spatial probit at province level, rural sample
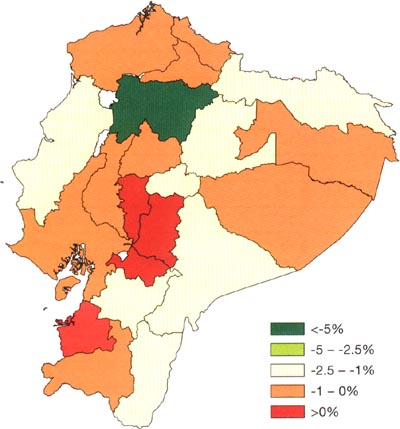
Figure A.9. Percentage of poor people per province, urban sample
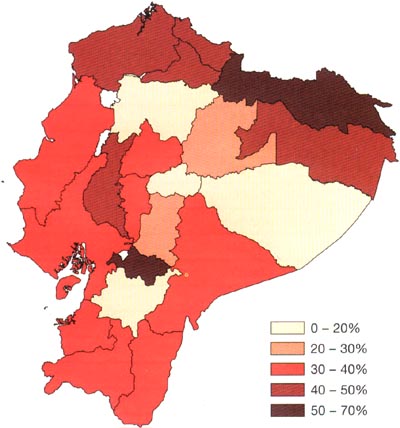
Figure A.10. Comparison between probit method and spatial probit at province level, urban sample
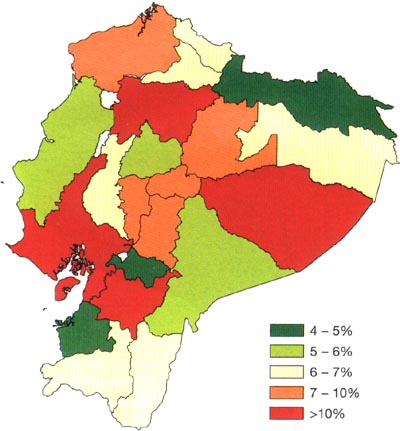
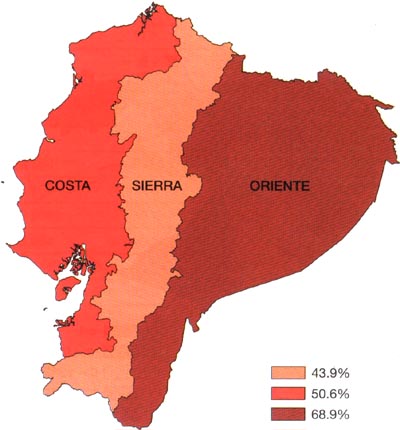
Figure A.11. Percentage of poor people per region
![]()
![]()
![]()