![]()
![]()
![]()
Because of the high market demand for tuna and the increasing levels of fishing effort exerted to fill this demand, nearly all of the world's major stocks of tuna are fully exploited, and some, such as the Atlantic bluefin (Thunnus thynnus thynnus) and southern bluefin (Thunnus maccoyii) tunas, are severely overexploited. The only region which might support a significant expansion of tuna fishing is the western and central Pacific Ocean, where scientists report that skipjack tuna (Katsuwonus pelamis) could sustain greater catches. In other areas tuna fleets are apparently larger than needed to take the available harvest. In most of these fully-exploited areas approximately the same amount of fish could be harvested with less fishing capacity, resulting in lower costs of production, greater economic returns, and lower prices for consumers.
If the stocks of tunas are to be managed and conserved in a rational manner, governments must seek ways to effectively limit the level of fishing mortality applied to the various stocks. To accomplish this over the long term, the number of vessels that can participate in a fishery would need to be limited to a level compatible with the capability of the stock to sustain the desired levels of fishing mortality. Many governments with fleets fishing for tunas are aware of this situation, and have been participating in the FAO initiative to seek means of limiting access to fisheries.
The situation in the tuna fishery of the Eastern Pacific Ocean (EPO) is much the same as in the rest of the world. All of the stocks, with the exception of skipjack, are fully exploited. The international tuna fleet has been growing, and the member governments of the Inter-American Tropical Tuna Commission (IATTC) have taken the first steps to limit the size of the fleet that can fish for tuna in the EPO. This paper reviews activities of the IATTC in this regard.
The fishery for tunas in the EPO, which accounts for about 20 percent of the world production of tuna, occurs between the mainland of the Americas and 150°W from 40°N to 40°S. Yellowfin tuna (Thunnus albacares) is the most important species taken in terms of volume of catch, followed by skipjack, bigeye (T. obesus), albacore (T. alalunga) and bluefin (T. thynnus orientalis). Vessels from some 16 nations participate in the fishery, and all types of fishing gear are used, but purse seines accounts for about 85 to 90 percent of the catch. Purse-seine sets on tunas associated with dolphins catch medium to large yellowfin, whereas small yellowfin, skipjack, and small bigeye are taken together in sets on floating objects and on unassociated schools of tunas. Longline vessels catch large bigeye and yellowfin.
The member governments of the IATTC have adopted limits on the purse-seine catches of both yellowfin and bigeye tuna; there are no limits on the catches of bluefin tuna, but the scientific staff of the IATTC has advised that if small bluefin were not harvested, the total catch of that species could be increased. Only skipjack tuna is considered capable of supporting increased yields in the EPO, but to what extent is uncertain.
The IATTC also monitors the catch of marine mammals captured incidentally during tuna-fishing operations. There is an annual limit on the incidental mortality of dolphins, divided among qualified vessels in the form of Dolphin Mortality Limits (DMLs) assigned to individual vessels.
From 1966 through 1979, annual catch limits were set for yellowfin tuna, but in subsequent years the conservation programme lapsed, and as a result the stock was overfished during the late 1970s and early 1980s. A large portion of the fleet left the fishery during the early 1980s, which, together with favourable environmental conditions, permitted the stock to recover by 1985. Between 1985 and 1998, the fishing effort generated by the international fleet did not exceed the level necessary to harvest the average maximum sustainable yield (AMSY) of yellowfin. For yellowfin, the fishing effort required to harvest the AMSY when the population is at its optimum size is about 20 000 to 22 000 standard days[75]. At that size there would be no need to implement catch limits as long as the effort does not exceed that level. Since 1989, the effort has ranged between 20 000 and 27 000 standard days, and the purse-seine catch of yellowfin has averaged approximately 250 000 tonnes[76]. In 1997 the total catch of all tunas taken by the purse-seine fleet reached 470 000 tonnes. The 1999 catch, as of November 8, was about 570 000 tonnes, the highest level in the history of the fishery. The effort generated to achieve the 1997 catch was about 24 000 standard days, a little above the optimum for yellowfin, but the stock was slightly above the level that would produce the AMSY at the beginning of the year. During 1998, fishing effort increased, and in late November the yellowfin fishery in the Commission's Yellowfin Regulatory Area (CYRA)[77] was closed to unrestricted fishing for the rest of the year.
When the fishery for yellowfin in the CYRA is restricted, fishing for that species must cease in the restricted areas, and when the limit for bigeye is reached, all fishing for tunas associated with floating objects is prohibited throughout the EPO. Only vessels with DMLs have the option of fishing in offshore areas for large yellowfin associated with dolphins; other vessels have to either fish for small yellowfin not associated with dolphins or floating objects, which are not abundant in the unrestricted offshore area, or fish for skipjack, or transfer to areas outside the EPO. Unrestricted fishing for skipjack is complicated by the fact that much of the catch is mingled with yellowfin and bigeye; transferring effort to other areas would cause problems because the stocks of tunas in those areas, with the possible exception of skipjack in the western and central Pacific, are all fully exploited.
As the fleet in the EPO grows, and the need to restrict fishing effort increases, it will become more and more difficult to implement effective limits on fishing. Prompted by increasing demand for fish and falling catch rates, the fishing industry will likely pressure governments to not impose limits on its ability to fish. This has happened before in many fisheries throughout the world, and has led to the overexploitation of a number of important fish stocks.
Almost the same situation occurred previously in the tuna fishery of the EPO. In 1966, the governments with vessels participating in the fishery implemented a conservation programme for yellowfin in the EPO, in the form of an annual total allowable catch. The programme was quite successful in maintaining a high abundance of yellowfin until the mid-1970s, when the growing size of the fleet began to cause problems. In 1970, the capacity of the international purse-seine fleet[78] in the EPO was about 60 000 tonnes, and the catch of yellowfin averaged about 100 000 tonnes. The demand for tuna for canning and the prices paid to fishermen were increasing. This stimulated the building of new vessels, and the capacity of the fleet increased to about 160 000 tonnes by 1976, and 170 000 tonnes by 1981 (Figure 1). Prior to 1975, the fleet had been concentrating on large yellowfin associated with dolphins, and the average weight of the fish in the catch was about 12 kg. After peaking at 240 000 tonnes in 1976, the catch began to decline.
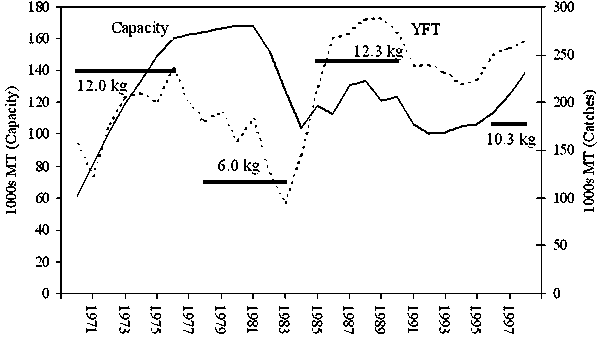
Figure 1. Total capacity of purse seine vessels, and catch and average weight of yellowfin (YFT).
As the capacity of the fleet grew and competition for fish increased, vessels concentrated increasingly on tuna not associated with dolphins, and the size of fish in the catch declined, averaging about six kg between 1977 and 1983. This decrease in the average size of yellowfin taken in the fishery caused a decrease in the yield per recruit and a corresponding decrease in the population abundance and productivity of the stock. With the increasing size of the fleet the recommended closure date for unrestricted fishing came earlier in the year, and as the catch declined further, it became more and more difficult for the governments to reach agreement on closing the fishery to unrestricted fishing. By 1980, the catch had declined to 160 000 tonnes, and by 1982 to 125 000 tonnes, even though fishing effort was at its highest level ever, at nearly 38 000 standard days. In 1982, because of the poor catches, vessels began to leave the EPO for the western Pacific, while others stayed in port because catch rates were so low that it was not profitable for them to go fishing. Fishing effort was much lower between 1983 and 1985, allowing the yellowfin stock to recover to greater levels of abundance.
From 1986 to 1996 the capacity of the purse-seine fleet in the EPO averaged about 110 000 tonnes; catches of yellowfin were high, averaging about 260 000 tonnes, and the size of the fish in the catch averaged about 12 kg (Figure 1). However, during the mid-1990s the fleet once again began to grow, through the construction of new vessels and the transfer of vessels from other regions. By the end of 1997, the fleet reached 139 000 tonnes of capacity. Fishing on tunas not associated with dolphins began to increase, and the average size of yellowfin in the catch declined. The situation was reminiscent of that of the late 1970s and early 1980s, and created concern among the governments with fleets operating in the EPO. This concern led to a resolution, adopted at the 61st meeting of the IATTC in June 1998, establishing a working group to examine options for limiting the growth in capacity of the international tuna purse-seine fleet operating in the EPO. In formulating its recommendations for any such measures, both interim and long-term, the working group was instructed to take into account the legitimate interests and rights of coastal states and the operational capacity of each fleet then operating in the EPO, with due consideration of historical participation in the fishery.
In September 1998, the working group recommended a series of measures for limiting the growth in the capacity of the fleet in the EPO. On the basis of these recommendations, at its 62nd meeting in October of that year, the IATTC approved a second resolution establishing limits on the capacities of national fleets operating in the EPO during 1999 (Annex 1).
This second resolution set limits, measured in tonnes of carrying capacity, on the size of the tuna fleet that each participating nation could operate in the EPO. The preamble to the resolution states that "the limit established for each state takes into account various factors including: the catch of national fleets during the period 1985-1998; the amount of catch historically taken within the zones where each state exercises sovereignty or national jurisdiction; the landings of tuna in each nation; the contribution of each state to the IATTC conservation programme, including the reduction of dolphin mortality; and other factors." The capacity of the national fleets during 1985-1998 was apparently the factor given most weight. In paragraphs 3 and 4 of the resolution, special provisions were made for certain states in the process of developing their tuna fisheries, particularly with reference to their legitimate rights under international law.
This resolution applied for 1999 only. However, the governments of the IATTC agreed that the working group should continue its work, and it met in October 1999 and will hold its next meeting on January 26-28, 2000, in San Jose, Costa Rica. In preparation for this meeting, information on the characteristics of the fishery is being compiled by the IATTC staff for the working group to use in its efforts to arrive at a means of effectively controlling growth in the fishery. Some of this information is presented below.
Catch limitations, such as quotas and area and season closures, have been commonly used to manage tuna fisheries in the past. Their success has been limited in some cases because there have been no controls on the number of vessels that could share in the quota or fish in an area or season. The consequence has often been unchecked fleet growth, resulting from the desire of individuals or nations to take greater shares of the available catch. As fleets grow and competition among vessels increases, creating economic problems for the vessel owners, there is greater pressure to weaken conservation controls. This can lead to the failure of conservation programmes, as in the case of the EPO fishery in the 1980s. If quotas and season and area closures are to be effective, they need to be coupled with restrictions on the number of vessels that can operate in the fishery. Indeed, in some situations, if fleet size is adequately controlled, other restrictions such as quotas and seasons may not be needed.
There is unfortunately little actual experience to refer to regarding limiting the size of a fishing fleet operating in a multinational fishery. However, the two most important points that must be taken into account when formulating ways of limiting fishing capacity are legal and technical considerations.
As regards legal considerations, international law or customary practice regarding the ocean and its resources provide little practical guidance on how to deal with the problem of limiting fishing capacity or catches in a multinational fishery. The United Nations Convention on the Law of the Sea (UNCLOS), in particular Article 62, outlines some of the rights and responsibilities of coastal states, particularly with respect to their ability to utilize the resources within their jurisdictions. If a coastal state cannot utilize the total allowable catch (TAC) within waters under its jurisdiction, then it shall, under certain conditions, provide access to other nations to utilize the surplus. Article 64, which deals with highly migratory species, calls on nations to work jointly in the scientific study and management of these species. The drafters of the Convention realized that the migratory nature of the tuna and tuna-like species meant that they could not be effectively managed by any one nation, but that all coastal and distant-water fishing nations which participated in the fishery for tunas would have to work together to ensure the rational utilization and conservation of the species. Likewise, the 1995 United Nations "Agreement for the Implementation of the Provisions of the United Nations Convention on the Law of the Sea of 10 December 1982 Relating to the Conservation and Management of Straddling Fish Stocks and Highly Migratory Fish Stocks" outlines a number of rights and responsibilities regarding the exploitation and management of tuna and tuna-like species, and defines a number of important points regarding the sharing of marine resources, but does not specifically define the rights of coastal and distant-water states in allocating those resources.
As regards technical considerations, the first priority is to determine the desired objective. This may be to optimize sustainable catches by constraining the amount of fishing mortality that can be exerted on a stock of fish, as in the case of the IATTC conservation programme, but it could also be to optimize economic returns from the fishery.
Fishing mortality, along with natural mortality, affects the abundance of the species being exploited, but it is difficult both to estimate and to control. Fishing mortality is defined as the product of fishing effort and a numerical constant representing the proportion of a population being exploited which is removed by a defined unit of fishing effort. This numerical constant, the fishing power of the vessel, is affected by the influence of the environment on the behaviour of the fish, which complicates efforts to limit fishing mortality by controlling fleet size. Fishing power is also affected by improvements in fishing gear and techniques, and can vary with the size and characteristics of the vessel. In the tuna purse-seine fishery of the EPO, vessels with different characteristics are standardized to one type of vessel, and it is therefore theoretically possible to quantify the amount of fishing mortality a particular sized fleet could generate. However, it is also necessary to monitor the efficiency of a fleet through time to quantify any changes in fishing power.
Because fishing mortality is so difficult to measure, a vessel's fish-carrying capacity, which is considered to be proportional to fishing mortality, is often used as a substitute. This is the approach used by the member governments of the IATTC, and in other fisheries in which attempts to limit fishing mortality have been made. There are different definitions of a vessel's capacity - the term can refer to displacement tonnage, net registered tonnage, gross tonnage, fish-carrying capacity, or the tonnage of fish it can carry in its freezing wells - but is usually related in some way to the size of the vessel.
As is evident from the IATTC resolution on limiting fleet capacity, any system for limiting the size of the international fleet in the EPO will probably, but not necessarily, involve some form of partitioning the total limit among nations. There are many ways of doing this, from limiting the capacity of the fleet to its present level and distributing that capacity among nations, to partitioning fleets among nations according to some measure related to the economic level of the nations. However, there are many possible approaches to the allocation of capacity limits: for instance, a mechanism similar to that used for DMLs, which are assigned to vessels and remain with the vessel if it changes flag, could be used. In its efforts to resolve this problem, the IATTC has been examining a variety of data related to fishery and the nations involved; some of the information being examined by the working group and the member governments is discussed in the following paragraphs.
3.2.1 Catches and landings
The catches, by species and flag, and landings, by species and country or region, of tunas from the EPO by surface fishing vessels for 1998 are shown in Table 1. Similar data are available in IATTC records dating back more than fifty years. The catches represent the fish captured by and loaded aboard surface-fishing vessels (purse-seiners, baitboats, and other types of gear other than longlines) in the EPO in that year. Landings are the catches unloaded in that year, and may include fish caught in the previous year. The country or region of unloading is the destination for consumption or final processing (e.g. canning) of the fish. It is clear from this table that significant quantities of tuna are unloaded and canned or processed into loins in nations with small fleets or no fleets. In other cases, nations have large catches but no landings, indicating that none of the fish is processed in that nation but is sold in other nations for processing. Some nations have both large catches and large landings, demonstrating the importance of the fishery to their economies.
3.2.2 Processing capacity
It is apparent from Table 1 that some nations only catch tuna in the EPO, others only process tuna caught in the EPO, and others do both. Information on the number of tuna canneries in each nation is listed in Table 2. This information, although incomplete, gives some idea of the relative importance of the fisheries for some states. Information on the amount of tuna from that EPO processed at each cannery and the number of persons employed in each cannery, which would be very useful for evaluating the importance of the fishery to a state's economy, is not available in IATTC records, but could be obtained.
Table 1. Estimates, in metric tonnes, of catches by species and flag, and landings, by species and country or region, of tunas caught by surface gear in the eastern Pacific Ocean, 1998.
|
Flag |
Yellowfin |
Skipjack |
Bigeye |
Bluefin |
Bonito |
Albacore |
Black skipjack |
Other tunas |
Total |
|
Catches |
|
|
|
|
|
|
|
|
|
|
Belize |
3 144 |
3 997 |
1 145 |
- |
- |
- |
- |
- |
8 286 |
|
Colombia |
14 329 |
4 109 |
553 |
- |
- |
- |
- |
- |
18 990 |
|
Cyprus |
19 |
293 |
101 |
- |
- |
- |
- |
- |
413 |
|
Ecuador |
39 435 |
68 797 |
20 203 |
- |
- |
- |
261 |
23 |
128 719 |
|
El Salvador |
1 330 |
317 |
- |
- |
- |
- |
- |
- |
1 648 |
|
Honduras |
869 |
629 |
142 |
- |
- |
- |
- |
- |
1 639 |
|
México |
108 082 |
18 208 |
135 |
1 |
412 |
8 |
85 |
61 |
126 993 |
|
Panamá |
5 114 |
1,990 |
54 |
- |
- |
- |
9 |
- |
7 167 |
|
Spain |
5 594 |
19 199 |
5 462 |
- |
- |
- |
- |
- |
30 255 |
|
Taiwan |
21 |
57 |
32 |
- |
- |
- |
- |
- |
111 |
|
United States |
5 917 |
8 761 |
3 432 |
1 842 |
924 |
116 |
75 |
11 |
21 078 |
|
Unknown |
194 |
604 |
267 |
- |
- |
- |
- |
- |
1 066 |
|
Vanuatu |
18 496 |
11 318 |
3 590 |
- |
- |
- |
7 |
- |
33 410 |
|
Venezuela |
63 500 |
6,074 |
236 |
- |
- |
- |
72 |
9 |
69 891 |
|
Total |
266 044 |
144 354 |
35 352 |
1 843 |
1 336 |
124 |
510 |
104 |
449 668 |
|
Landings |
|
|
|
|
|
|
|
|
|
|
Colombia |
48 629 |
14 118 |
2 900 |
- |
- |
- |
- |
20 |
65 667 |
|
Costa Rica |
27 225 |
2 891 |
443 |
- |
- |
- |
- |
- |
30 561 |
|
Ecuador |
53 209 |
88 057 |
26 629 |
- |
- |
- |
268 |
22 |
168 188 |
|
México |
96 862 |
16 929 |
79 |
34 |
412 |
8 |
85 |
61 |
114 472 |
|
Nicaragua |
- |
- |
- |
- |
25 |
- |
- |
- |
26 |
|
Panamá |
3 617 |
982 |
316 |
- |
- |
- |
- |
- |
4 915 |
|
Perú |
936 |
21 |
- |
- |
- |
- |
- |
9 |
966 |
|
Spain |
5 858 |
4 905 |
1 956 |
- |
- |
- |
- |
- |
12 720 |
|
United States |
3 915 |
6 006 |
1 785 |
1 694 |
757 |
105 |
75 |
10 |
14 351 |
|
Unknown |
1 032 |
165 |
- |
114 |
141 |
8 |
- |
- |
1 461 |
|
Venezuela |
27 250 |
1 861 |
88 |
- |
- |
- |
- |
- |
29 199 |
|
Total |
268 536 |
135 938 |
34 199 |
1 843 |
1 336 |
123 |
429 |
123 |
442 530 |
Table 2. Number of principal tuna canneries, by country
|
Country |
Number |
|
Colombia |
6 |
|
Costa Rica |
4 |
|
Ecuador |
18 |
|
El Salvador |
1 |
|
France |
12 |
|
México |
17 |
|
United States |
5 |
|
Venezuela |
15 |
3.2.3 Capacity of fishing fleets
The IATTC considers a vessel's carrying capacity to be the maximum tonnage of tuna it can hold in its freezing wells, and the total carrying capacity of a fleet to be the sum of the carrying capacities of all of the vessels in that fleet. The total carrying capacity of the international purse-seine fleet in the EPO tuna fishery in 1992 was about 100 000 tonnes. By 1997, carrying capacity had increased to about 125 000 tonnes. This increased again in 1998 and 1999 to 139 000 tonnes and 153 000 tonnes respectively.
The IATTC staff uses the following methods to determine the carrying capacity of individual vessels or fleets of vessels. When a new or recently reconstructed vessel first joins the EPO fleet, its initial total carrying capacity is determined from information obtained from the shipyard that constructed or most recently modified the vessel or, more frequently, from the vessel owner or crew; this may be an estimate based on shipyard rated capacity or on previous unloadings in other ocean areas. Once the vessel is included in the EPO fleet, its unloading records are examined at the end of each year. If an unloading record exceeds the initial or current carrying capacity, that unloading record becomes the new carrying capacity of the vessel. The total capacity of the fleet for a particular year is computed by summing the capacity of all vessels that have made at least one unloading in that year of yellowfin and/or skipjack and/or bluefin and/or bigeye from a single trip in the EPO.
The tonnage that a vessel carries depends upon how densely the fish are packed in the vessel's freezing wells, which, in turn, is dependent on the size of the fish in the catch and on market demands for type and quality of the frozen product. This flexibility may lead to situations where vessels with identical well volumes have different "fishing capacities" in the EPO fleet. For example, the owner of vessel A, with a shipyard-rated capacity of 1 200 tonnes, might choose to always load less fish than the vessel is rated to carry, to ensure that the fish are maintained in optimum condition during the loading, freezing, and unloading process. The owner of an identical vessel, vessel B, might decide on one occasion to load the maximum possible quantity of fish, resulting in a landing of 1 200 tonnes. In this example, when unloading data are examined at the end of the year, the capacity of vessel B would continue to be 1 200 tonnes, while that of vessel A would be revised to 1 000 tonnes. This system has proved useful for estimating the "fishing capacity" of the fleet fishing for yellowfin, skipjack, and bigeye, but these variations have caused some problems in computing the assessments paid by vessels participating in the IATTC's observer programme, and would also cause problems in the future if the system were used as a basis for the management of fleet capacity. To avoid this difficulty, the governments decided to use the more objective value of well volume, measured in cubic meters and converted to carrying capacity in tonnes, using an agreed ratio of cubic meters/ton, as a basis of vessel assessments. There would be advantages to using well volume, rather than unloading weights, to compute carrying capacity for the purposes of fleet limitation as well. Data on individual vessel characteristics, including carrying capacity and cannery unloading weights, are available in IATTC records dating back to the early days of the fishery.
3.2.4 Catches within Exclusive Economic Zones
The annual catches of tunas, by species, taken by surface fishing vessels within the Exclusive Economic Zones (EEZs) of states bordering the EPO are available in IATTC records dating back to 1960. For each state, the catch of each species and of all species combined taken in that state's EEZ, and that catch expressed as a percentage of the total catch taken in the EPO, averaged for 1994-1998 are shown in Table 3. These data were compiled by the IATTC staff, using the information currently available on EEZ boundaries, but some boundaries are unresolved.
There are several important points to consider when examining these data. First, there is a high degree of annual variability in the catch of tuna made within the EEZ of any particular nation: for some nations the catches may vary by as much as a factor of five. Second, there has been a downward trend in the percentage of the total catch of tunas taken within the combined EEZs of the EPO and a corresponding upward trend in the catch from international waters, mostly due to the development of the fishery on fish-aggregating devices (FADs) in the offshore area. Third, the catches shown in Table 3 recorded as taken inside the EEZ of a coastal state represent catches made by the international fleet fishing in that zone, rather than just vessels of the corresponding coastal state. In order for the fleet of the coastal state to make those catches in its EEZ, it would have to be capable of generating fishing effort equivalent to that generated by the components of the international fleet fishing in that EEZ.
Table 3. Estimated average annual catches by surface gear, in metric tonnes, of tunas species within the Exclusive Economic Zones (EEZs) of states bordering the EPO during 1994-1998.
| |
Yelowfin |
Skipjack |
Bigeye |
Bluefin |
All species |
|||||
|
EEZ |
Catch |
% EPO |
Catch |
% EPO |
Catch |
% EPO |
Catch |
% EPO |
Catch |
% EPO |
|
Colombia |
5 007 |
2.1 |
5 227 |
4.1 |
393 |
1.0 |
0 |
0.0 |
10 561 |
2.5 |
|
Costa Rica |
14 313 |
5.9 |
1 344 |
1.1 |
40 |
0.1 |
0 |
0.0 |
15 689 |
3.8 |
|
Ecuador |
15 438 |
6.4 |
14 754 |
11.7 |
4 467 |
10.9 |
0 |
0.0 |
34 676 |
8.4 |
|
El Salvador |
2 918 |
1.2 |
39 |
0.0 |
0 |
0.0 |
0 |
0.0 |
2 941 |
0.7 |
|
France |
7 434 |
3.1 |
940 |
0.7 |
22 |
0.1 |
0 |
0.0 |
8 388 |
2.0 |
|
Guatemala |
3 311 |
1.4 |
3 |
0.0 |
0 |
0.0 |
0 |
0.0 |
3 312 |
0.8 |
|
México |
54 673 |
22.5 |
11 569 |
9.2 |
2 |
0.0 |
847 |
28.5 |
67 465 |
16.3 |
|
Nicaragua |
1 200 |
0.5 |
5 |
0.0 |
0 |
0.0 |
0 |
0.0 |
1 203 |
0.3 |
|
Panamá |
6 293 |
2.6 |
2 707 |
2.1 |
123 |
0.3 |
0 |
0.0 |
9 105 |
2.2 |
|
Perú |
5 675 |
2.3 |
3 561 |
2.8 |
306 |
0.7 |
0 |
0.0 |
9 481 |
2.3 |
|
United States |
549 |
0.2 |
523 |
0.4 |
5 |
0.0 |
1 695 |
57.0 |
3 010 |
0.7 |
|
Within EEZs |
116 813 |
48.1 |
40 653 |
32.2 |
5 174 |
12.6 |
2 542 |
85.5 |
165 832 |
40.0 |
|
Total EPO |
243 039 |
|
126 341 |
|
40 963 |
|
2 973 |
|
414 347 |
|
Notes: Catch: catch within EEZ; % EPO: percentage of the total EPO catch taken in that EEZ; All species: all species caught. Based on data available 27 September 1999.
3.2.5 Demographics
There are wide differences in the populations and economic status of the various states involved in the tuna fishery in the EPO. Some of these differences are apparent from Table 4, which shows data for 1990-1995 on human population, per capita gross domestic product (GDP), and growth rates for each of the states bordering the EPO or with fleets fishing for tunas in the area. GDP is expressed in United States dollars and at constant 1990 prices; growth rates are obtained by dividing the GDP of a year by the GDP of the preceding year. The data were obtained from United Nations and World Bank sources.
Table 4. Population (millions), per capita gross domestic product (GDP), and growth rates of states bordering the EPO or with fleets fishing for tunas in the area.
| |
1990 |
1991 |
1992 |
1993 |
1994 |
1995 |
|
Belize |
|
|
|
|
|
|
|
· Population |
0.19 |
0.19 |
0.20 |
0.20 |
0.21 |
0.21 |
|
· GDP - per capita |
2 120 |
2 242 |
2 376 |
2 451 |
2 459 |
2 569 |
|
· Growth rate |
9.3 |
4.2 |
7.2 |
9.8 |
6.0 |
3.7 |
|
Chile |
|
|
|
|
|
|
|
· Population |
13.15 |
13.37 |
13.59 |
13.82 |
14.00 |
14.21 |
|
· GDP - per capita |
2 320 |
2 582 |
3 156 |
3 314 |
3 728 |
4 736 |
|
· Growth rate |
3.3 |
7.3 |
11.0 |
6.3 |
4.2 |
8.5 |
|
Colombia |
|
|
|
|
|
|
|
· Population |
33.32 |
34.10 |
34.88 |
35.68 |
35.68 |
36.40 |
|
· GDP - per capita |
1 236 |
1 241 |
1 302 |
1 463 |
1 914 |
2 215 |
|
· Growth rate |
\4.3 |
2.0 |
4.0 |
5.2 |
5.8 |
5.2 |
|
Costa Rica |
|
|
|
|
|
|
|
· Population |
3.04 |
3.11 |
3.19 |
3.27 |
3.32 |
3.39 |
|
· GDP - per capita |
1 881 |
1 811 |
2 111 |
2 300 |
2 485 |
2 696 |
|
· Growth rate |
3.6 |
2.3 |
7.7 |
6.3 |
4.5 |
2.5 |
|
Cyprus |
|
|
|
|
|
|
|
· Population |
0.70 |
0.71 |
0.72 |
0.73 |
0.73 |
0.73 |
|
· GDP - per capita |
8 162 |
8 286 |
9750 |
9 086 |
9 924 |
11 459 |
|
· Growth rate |
7.3 |
0.6 |
9.7 |
1.7 |
6.0 |
5.0 |
|
Ecuador |
|
|
|
|
|
|
|
· Population |
10.26 |
10.49 |
10.73 |
10.98 |
11.38 |
11.63 |
|
· GDP - per capita |
1 041 |
1 119 |
1 178 |
1 303 |
1 480 |
1565 |
|
· Growth rate |
3.0 |
5.0 |
3.6 |
2.0 |
4.3 |
2.3 |
|
El Salvador |
|
|
|
|
|
|
|
· Population |
5.17 |
5.29 |
5.40 |
5.52 |
5.39 |
5.48 |
|
· GDP - per capita |
1 059 |
1 034 |
1 133 |
1 290 |
1 463 |
1 660 |
|
· Growth rate |
(3.3) |
3.6 |
7.5 |
7.4 |
6.0 |
6.5 |
|
France |
|
|
|
|
|
|
|
· Population |
56.74 |
57.06 |
57.37 |
57.65 |
57.90 |
58.15 |
|
· GDP - per capita |
21 077 |
21 063 |
23 107 |
21 717 |
22 963 |
26 444 |
|
· Growth rate |
2.5 |
0.8 |
1.3 |
(1.5) |
2.7 |
2.2 |
|
French Polynesia |
|
|
|
|
|
|
|
· Population |
0.20 |
0.21 |
0.21 |
0.22 |
0.22 |
0.22 |
|
· GDP - per capita |
14 872 |
14 729 |
15 849 |
16 565 |
16 581 |
19 766 |
|
· Growth rate |
4.0 |
3.9 |
1.5 |
2.0 |
3.5 |
2.5 |
|
Guatemala |
|
|
|
|
|
|
|
· Population |
9.20 |
9.47 |
9.74 |
10.03 |
10.76 |
11.06 |
|
· GDP - per capita |
832 |
994 |
1 071 |
1 137 |
1 256 |
1 392 |
|
· Growth rate |
3.1 |
3.7 |
4.8 |
4.0 |
4.0 |
4.9 |
|
Honduras |
|
|
|
|
|
|
|
· Population |
4.88 |
5.03 |
5.18 |
5.34 |
5.30 |
5.45 |
|
· GDP - per capita |
625 |
610 |
660 |
657 |
622 |
697 |
|
· Growth rate |
0.1 |
3.3 |
5.6 |
6.2 |
(1.5) |
3.6 |
|
México |
|
|
|
|
|
|
|
· Population |
84.51 |
86.27 |
88.06 |
90.03 |
91.59 |
93.32 |
|
· GDP - per capita |
2 932 |
3 380 |
3 812 |
4 114 |
4 145 |
2 700 |
|
· Growth rate |
4.4 |
3.6 |
2.8 |
0.6 |
3.5 |
(6.9) |
|
Nicaragua |
|
|
|
|
|
|
|
· Population |
3.68 |
3.82 |
3.96 |
4.11 |
4.06 |
4.19 |
|
· GDP - per capita |
621 |
475 |
489 |
506 |
462 |
464 |
|
· Growth rate |
0.0 |
(0.2) |
0.4 |
(0.4) |
3.3 |
4.2 |
|
Panamá |
|
|
|
|
|
|
|
· Population |
2.40 |
2.44 |
2.49 |
2.54 |
2.57 |
2.61 |
|
· GDP - per capita |
2 248 |
2 422 |
2 682 |
2 799 |
2 870 |
2 934 |
|
· Growth rate |
7.4 |
7.9 |
7.2 |
4.1 |
3.7 |
3.0 |
|
Peru |
|
|
|
|
|
|
|
· Population |
21.59 |
22.01 |
22.44 |
23.89 |
24.05 |
24.56 |
|
· GDP - per capita |
1 674 |
1 940 |
1 873 |
1 770 |
2 164 |
2 497 |
|
· Growth rate |
(5.4) |
2.8 |
(1.4) |
6.4 |
13.1 |
7.0 |
|
United States |
|
|
|
|
|
|
|
· Population |
249.95 |
252.64 |
255.38 |
258.09 |
260.60 |
263.40 |
|
· GDP - per capita |
21 604 |
22 033 |
22 890 |
23 888 |
25 127 |
26 037 |
|
· Growth rate |
1.2 |
(0.5) |
2.5 |
3.4 |
4.1 |
2.0 |
|
Vanuatu |
|
|
|
|
|
|
|
· Population |
0.15 |
0.15 |
0.16 |
0.16 |
0.17 |
0.17 |
|
· GDP - per capita |
1 026 |
1 124 |
1 153 |
1 122 |
1 206 |
1 289 |
|
· Growth rate |
5.2 |
4.1 |
0.8 |
3.8 |
3.0 |
3.2 |
|
Venezuela |
|
|
|
|
|
|
|
· Population |
19.33 |
19.80 |
20.27 |
20.71 |
21.14 |
21.56 |
|
· GDP - per capita |
2 492 |
2 676 |
2,955 |
2 871 |
2 719 |
3 496 |
|
· Growth rate |
6.5 |
9.7 |
6.1 |
0.3 |
(2.9) |
3.4 |
Note: GDP is expressed in US dollars and at constant 1990 prices; growth rate is obtained by dividing the GDP of that year by the GDP of the preceding year.
One of the primary considerations of the member governments of the IATTC for limiting the size of the fleet is that, without such limits, the catches per vessel will decline and the economic pressures on individual vessels will be so great that it would be politically very difficult to sustain an effective conservation programme. It is difficult to determine the size to which a fleet should be limited: ideally, it should be no more than a size that can take the desired harvest from the fishery, while at the same time ensuring the sustainability of each stock. As noted earlier, in the EPO tuna fishery catches of yellowfin and bigeye need to be controlled, whereas skipjack can most likely sustain increased catches. For yellowfin the optimum level of effort (that which could harvest the AMSY with the current distribution of fishing modes) is about 20 000 to 22 000 standard days. This level of effort could also take the maximum recommended catch of bigeye for the surface fishery. It is not possible to estimate the optimum effort for skipjack. However, in 1997, the total catch of all species combined was at an historical maximum, with an effort of about 24 000 standard days. In 1998 effort was greater, but the catches were less than those of 1997; however, as noted above, the 1999 catch of skipjack is already the greatest on record. Although it is still too early to estimate the total fishing effort for 1999, it will probably not be much different from that of 1998. Based on these observations, it would seem prudent to keep the fleet at a size which could generate between 20 000 and 25 000 standard days of effort. At current population sizes, that amount of effort could easily be generated by a purse-seine fleet of no more than 135 000 tonnes of carrying capacity, and most likely significantly less. This assumes that the size composition of the individual vessels in the fleet does not change much; if it did, the effort the fleet could generate would also change because of the differences in fishing power of vessels of different sizes.
Similarly, the efficiency of vessels of any size can be increased by improving fishing equipment and techniques. For example, if a fleet of 100 000 tonnes of capacity (100 vessels of 1 000 tonnes each) capable of generating 22 000 standard days of effort were to improve its efficiency at catching fish by ten percent, the same 100 vessels could generate approximately 24 000 standard days of effort in about the same time it took to generate 22 000 days before the increase in efficiency. Additionally, problems can arise which are related to limitation of size of the fleet. Typically, in the EPO a 600-tonne vessel and a 1 200-tonne vessel have similar fishing power and spend, on average, the same number of days at sea fishing during a year. If a national fleet consisting of ten vessels, each of 1 200 tonnes of capacity, is replaced with a fleet of 20 600-tonne vessels, its capacity remains the same but its fishing power is doubled. Such a situation would defeat the objective of limiting fishing mortality by limiting fleet size. It is, therefore, of utmost importance that in any scheme to limit fleet size the efficiency of vessels be monitored and any change in efficiency be incorporated into the programme.
As mentioned above, there are a number of ways of measuring the size of a fishing fleet, but the method most often used by the IATTC is carrying capacity. An FAO technical working group on the management of fishing capacity which met in La Jolla during April 1998 defined fishing capacity as "the maximum amount of fish over a period of time (year, season) that can be produced by a fishing fleet if fully utilized, given the biomass and age structure of the fish stock and the present state of the technology. Fishing capacity is the ability of a vessel or fleet of vessels to catch fish". If the purpose of limiting the size of a fishing fleet is to keep it in balance with the optimum productivity of the populations of fish being harvested, then the ideal approach would be to limit the fleet to a size at which it could generate the optimum annual fishing mortality when all vessels in the fleet fished all year. Doing this for the tuna fishery in the EPO is complicated by the fact that some stocks of fish are fully exploited while others are not. Accordingly, the optimum effort may be different for each stock.
The limits established on fleet size in 1999 by the IATTC resolution (Annex 1) were based on data on carrying capacity, which are available from the earliest days of the fishery. At the time these limits were set, the fleet capacity was about 138 000 tonnes, and the permissible capacity under the resolution was 158 837 tonnes, not including the exceptions listed in paragraphs 2 and 3. The current fleet capacity is 153 000 tonnes and, as noted above, a fleet of 135 000 tonnes of capacity would be capable of harvesting yellowfin and bigeye at recent levels of total catch. The problem facing the Commission is how to reduce the size of the existing fleet, which is already larger than needed to take the allowable catch of yellowfin and bigeye, and at the same time accommodate the desire expressed by many states to increase the sizes of their fleets. This task is further complicated by wide differences in the needs and interests of the various states that already have, or are interested in having, fleets operating in the EPO. Some of these states are coastal and others are not. Some states have long histories of operating in the area with large fleets, others have small fleets but intend to increase them, and others have no fleets, but have an interest in developing them. For some states, the fishery is currently of great economic importance, while other states that have not yet developed fisheries are interest in doing so. Developing a system for controlling fleet capacity that takes all these differences into account will not be easy, but the IATTC will have to find a solution if it is to fulfil its mandate to conserve the tuna stocks of the eastern Pacific.
1. The High Contracting Parties to the Commission:
Seeking to address the potential problem of excess capacity in the tuna purse-seine fleet operating in the Eastern Pacific Ocean (EPO) by limiting such capacity to a level which, when viewed in relation to other agreed management measures and projected and actual catch levels, will ensure that tuna fisheries in the region are conducted at a sustainable level:
Welcome the commitment by states (both members and non-members of the IATTC) with vessels licensed to fish for tuna in the EPO or with significant installed processing capacity in the region as of June 12, 1998, to move towards this level of fishing capacity by regulating the size of their fleets fishing in the EPO during calendar year 1999 in accordance with the limits set forth below. The limit established for each state takes into account various factors including: the catch of national fleets during the period 1985-1998; the amount of catch historically taken within the zones where each state exercises sovereignty or national jurisdiction; the landings of tuna in each nation; the contribution of each state to the IATTC conservation programme; including the reduction of dolphin mortality; and other factors.
| |
Carrying capacity (metric tonnes) |
|
Belize |
1 877 |
|
Colombia |
6 608 |
|
Costa Rica |
6 000 |
|
Ecuador |
32 203 |
|
El Salvador |
1 700 |
|
Honduras |
499 |
|
Mexico |
49 500 |
|
Nicaragua |
2 000 |
|
Panama |
3 500 |
|
Spain |
7 885 |
|
United States |
8 969 |
|
Vanuatu |
12 121 |
|
Venezuela |
25 975 |
2. The capacity levels established above shall not apply to a limit of 32 United States vessels authorized and licensed to fish in other areas of the Pacific Ocean under an alternative international fisheries management regime, and that may occasionally fish to the east of 150 degrees west longitude, provided that: a) the fishing activity of any such vessels in the EPO is limited to a single trip not to exceed 90 days in one calendar year; b) the vessels do not possess a Dolphin Mortality Limit; and c) the vessels carry an approved observer. A similar exception shall be considered for vessels from other countries with a similar record of participation in the EPO tuna purse-seine fishery and that meet the criteria listed above.
3. The High Contracting Parties also acknowledge and affirm the right of several states without vessels currently fishing in the EPO, but with a longstanding and significant interest in the EPO tuna fishery, to develop their own tuna fishing industries. They further acknowledge that, in accordance with their legitimate rights under international law, several EPO coastal states, including France and Guatemala, have expressed an immediate interest in developing their own tuna fishing fleet in the EPO.
4. Other states, including Colombia, El Salvador, Nicaragua, Panama, and Peru, have expressed their interest in increasing the carrying capacity of their fleets licensed to fish for tuna in the EPO.
5. Any state listed in Paragraph 3 seeking to enter the fishery through the development of its own fishing fleet in the EPO shall not be bound to a national capacity level for calendar year 1999. Should the actual fishing capacity for new entrants approach 6 000 tonnes, the Commission would meet to consider immediate action in accordance with paragraph 6, below. Further decisions on establishing national capacity limits for any state that brings a new vessel or vessels into the fishery shall take into account the criteria established in paragraph 1 above and the state's right under international law.
6. The High Contracting Parties agree to review annually the level of actual fishing capacity in the EPO. The Parties agree to consider measures to ensure that fishing capacity corresponds to the level of fishing capacity described in paragraph I above. At such time as the actual level of fishing capacity approaches a level where the sustainability of the fisheries is of concern, the Parties agree to meet to consider immediate action to adjust capacity or to take other action to ensure the sustainability of the fisheries.
The High Contracting Parties agree to establish a permanent working group to review, on an annual basis, the capacity of the tuna purse seine fleet in the EPO and formulate additional recommendations for the consideration of the Commission.
|
[74] Consultant,
Inter-American Tropical Tuna Commission. [75] To permit comparisons of different sizes or classes of vessels, the catching efficiencies of vessels of all sizes are standardized to that of a Class-6 (>363 tonnes carrying capacity) purse-seine vessel, and expressed in standard days. [76] All tonnages are expressed in metric tonnes. [77] The inshore area of the EPO between 40°N and 30°S, reaching out to between about 90° and 120°W at different latitudes. [78] The IATTC considers a vessel’s carrying capacity to be the maximum tonnage of tuna it can hold in its freezing wells, and the total carrying capacity of a fleet to be the sum of the carrying capacities of all of the vessels in that fleet. |
![]()
![]()
![]()