![]()
![]()
![]()
Abstract: Nigeria has an 853 km coastline and an entire maritime waters of 210 900 km2 including the Exclusive Economic Zone (EEZ). The continental shelf is narrow, extending for only about 15 km in the western area and ranges from 60-80 km in the eastern tip. This condition limits the trawlable grounds to 3 200 nm2 out of the 11 470 nm2 continental shelf area. The inshore (0-50m) waters are characterized by a variety of small fish species varying from 25 to 50 cm in total length. The most predominant is the Pseudotolithus spp. Estimated potential yield of the inshore waters is about 16 620 mt for finfish and between 3 500-4 020 mt for shellfish resources, which are exploited by both the artisanal and industrial operators. Offshore (50-200 m), the potential fisheries resources are estimated at about 9 460 mt, and consist of mostly tuna and tuna-like fishes.
In this paper, the diverse inshore and offshore fisheries resources and the various capacities employed in harvesting them are discussed. In some of the fisheries, harvesting has been in excess of the annual potential yield due to excess effort and overcapitalization. The number of inshore trawlers rose from 92 in 1979 to 350 in 1998. The need for an effective effort/capacity measurement mechanism is, therefore, imperative. Various methods adopted for capacity measurement and monitoring fisheries resources are presented and analyzed.
Nigeria occupies between latitude 4o16' and 13o52'N, longitude 2o49' and 14o37'E, and has a coastline spanning about 853 km bordering the Gulf of Guinea in the Atlantic Ocean. The Nigerian coastline is indented with lagoon systems in the west, extensive mangrove swamp and a delta (Niger-Delta) complex which opens into the sea through a host of rivers including Benin, Escravos, Forcados, Ramos, Dodo, Middleton, Fish town, Nun, Brass, San Batholomeo, Bonny and Opobo. The Niger Delta system is the second largest in the world and spans a distance of about 500 km. Most fin and shellfish resources of the Nigerian marine waters are found within this region.
Nigeria declared an Exclusive Economic Zone (EEZ) of 200 nm in 1978 thus extending her area of maritime influence including the Territorial waters to an estimated 210 900 km2. Fishing has been the dominant occupation of most inhabitants of the coastal regions of Nigeria, and activities have been mostly from the artisanal sector, producing between 80-90 percent of Nigeria's annual fish supply. The industrial fisheries sub-sector's growth from 1987 to date has been phenomenal and this calls for effective resource management strategies.
The estimated annual fish demand in Nigeria is 1.2 million metric tonnes based on a population figure of 100 million and per capital consumption of 12 kg per annum regarded as adequate for a normal healthy growth. The current total annual fish supply is about 50 percent of the total demand. This excess demand encourages the deployment of more effort into the fishery with the objective of reducing the gap between demand and supply. The over capitalization that has subsequently developed has resulted in reduced catch per unit effort (CPUE) in the last couple of years. Managers of the resource are worried about this trend. There is, therefore, a need to constantly monitor the capacity deployed into the fishery to avert over-fishing and the consequent resource depletion.
A Fisheries Resources Monitoring, Control and Surveillance Unit in the Federal Department of Fisheries of the Federal Ministry of Agriculture and Rural Development was established by the Government in 1991. Its main function is to ensure rational exploitation and sustainable management of the nation's marine fisheries resources due to the threats posed by poaching increased fishing effort and capacity, particularly over the inshore waters.
The topography and hydrographic regimes of the West African continental shelf affect the distribution and constituents of the benthic animal communities. Oceanographic surveys also indicate that prevailing hydrographic conditions influence fish productivity along the continental shelf.
The Nigerian coast can be divided into four main physiographic zones, namely, the Barrier Lagoon Coast with steep beach profiles and sandy bar plain stretching about 200 km from the west; the Mahin Mud Coast which grades from the sandy into a mud beach and extends about 75 km to the Benin River mouth; the Niger Delta which spans from the Benin River to Imo River is renown for its fin and shell fish resources; and the Strand Coast which extends for 85 km from Imo River to the Cross River estuary is characterized by active mixing of river and sea waters. It harbours fish species similar to those of the Niger Delta.
The continental shelf widens progressively from 15 km off Lagos in the west to about 80 km off Calabar in the southeast. The relatively narrow continental shelf limits trawlable grounds and fish abundance. The area of the shelf is about 11 470 square nautical miles (nm2) of which 3 200 nm2, representing only 27.90 percent, is trawlable (Tobor, 1990). The 40 m contour is a reliable boundary of the thermocline which separates the upper from the lower oceanic currents and limits the extent of the distribution of demersal fish stocks. Hence, this zone between the high water mark on the shore and the 40 m-depth contour running parallel to the coast at an average distance of 37 km from the shore contains the demersal fish resources, which provide opportunities for further development of the artisanal and coastal inshore fisheries. Artisanal fishermen almost exclusively fish the region between the shoreline and the 18 m contour, but both the artisanal and industrial fishermen exploit the resources between the 18 m and 40 m contour.
The most significant features of the hydrographic regime in the Nigerian waters include the relatively stable thermocline, steep temperature gradient and stable oceanographic conditions below the mixed layer throughout the year. Hydrographic conditions in the coastal waters are greatly affected by the effluent rivers, the effects of which depend on the average annual discharge. This is greatest in the Niger-Delta area where the total discharge is about 21 800 m3.
There is a definite pattern in the distribution of fishes on the Nigerian continental shelf. Available data indicate that the distribution of a number of species is limited by the depth of the thermocline and is influenced by the type of deposit (sand, silt) and the depths on the continental shelf, the slope of which is variable. Though the broad distribution of the commercially exploited marine fish species is known, there is limited information on the composition of communities and spatial distribution of stocks. The distribution of demersal and pelagic fishes in the marine waters of Nigeria indicates discrete ecological fish communities, each of which is fairly homogenous. There is, however, also ecological and microgeographical heterogeneity of fish communities. Migration of species from the estuaries and creeks to the open and continental shelf areas and vice versa is known to be of common occurrence.
Nigeria has two major marine fisheries sub-sectors: the artisanal or small-scale and the industrial or trawl fisheries. Marine artisanal fisheries activities are divided into two major components: the brackish water fisheries with fishing activities in the creeks and estuaries where freshwater flowing down the rivers mixes with salt water moving up with high tide; and the artisanal inshore fisheries with fishermen operating in waters of less than 40 m depth.
The brackish water fisheries are an important component of Nigeria's artisanal fisheries consisting of estuaries, beach ridges, intertidal mangroves swamps, intersecting rivers and numerous winding saline creeks. Data based solely on the production from this sector are not available but fishing intensity is known to be high. Small dug-out canoes that are generally non-motorised are used by fishermen operating within this area.
The family Clupeidae constitutes the principal element in Nigeria's coastal/inshore pelagic fish community, the most important of which is the Ethmalosa fimbriata (bonga). Other key species are the shad (Ilisha africana) and the flat sardine (Sardinella maderensis). The bonga is the most valuable and abundant fish in the artisanal fisheries of Nigeria. It is euryhaline and the juveniles tolerate low salinity in the Niger Delta river mouths. Adults and spawners are located in the downstream estuaries and at sea. It rarely goes below 20 m and prefers warm and turbid waters. Ilisha africana (shad) is an anadromous clupeid inhabiting coastal and inshore waters down to about 50 m. It has a maximum length of about 22 cm and a good preference for crustaceans and juvenile fishes. The flat sardine, Sardinella maderensis, less abundant than the bonga prefers clear saline and warmer waters with temperature above 24°C.
Both the bonga and flat sardines are targets of surface set nets, drift gillnets and encircling or purse seine nets of artisanal fishermen and also by trawlers. Some trawlers in addition to artisanal beach seines and gillnets also exploit shad. Handicapped by weather induced rough seas during the months of June to August, small coastal pelagics support dry season exploitation from mid September to May.
Artisanal bottom set gillnets compete effectively with industrial trawlers in harvesting these coastal demersal resources within the 5-20 m depth. Target species are the sciaenidae (Croakers). They are dominated by Pseudotolithus elongatus whose bathymetric distribution extends to depths of up to 20 m. They prefer surroundings that are less saline. Commercial concentrations correspond to the estuaries where they are caught in large quantities in certain seasons. They inhabit mud bottoms in depth up to 50 m but also enter estuaries and coastal lagoons. Maximum length is about 45 cm, and moves further offshore to spawn during the rainy season. P. senegalensis and P. typus are also commonly caught sciaenids. P. typus normally attains a maximum length of about 100 cm, but 50 cm sizes are common in the landings. It is the most important sciaenid in Nigerian waters. This species inhabits mud and sandy bottoms and are more abundant in waters of less than 60 m depth and temperature above 18°C. Polynemids, Galeoides decadactylus, Polydactylus quadrifilis; Bigeye, Brachydeuterus auritus; catfish, Arius spp; grunters, Pomadasys spp; snapper, Lutjanus dentatus; groupers, Epinephelus spp; sharks; rays and soles Cynoglossus spp. are also targets of fish trawl operators.
The marine environment off the Niger Delta comes strongly under the influence of the Inter Tropical Continuity Zone (ITCZ) and its associated trade winds. The annual shift of the ITCZ brings heavy rain to the Delta area between April and October. The resulting heavy load of rich organic debris brought down by various rivers on the delta supports rich shrimp resources. Penaeid shrimp resources are concentrated in the Niger-Delta due to the broad continental shelf and the various outlets to the sea that allow movement of juvenile shrimp between the sea and the brackish waters favourable for its life cycle. Shrimp grounds cover about 2 500 m2 off Nigeria. Shrimp stocks are found in abundance off Badagry to Lagos, Lekki Lagoon system and mouths of rivers on the Delta from River Benin to Pennington and from River Bonny to the Cross River estuary.
The species mostly exploited are the Pink shrimp, Penaeus notialis, which is most abundant and most valued economically; Guinea shrimp, Parapenaeopsis atlantica; Tiger Shrimp, Penaeus kerathurus and the Royal shrimp, Parapenaeus longirostris. P. notialis prefers the supra-thermocline muddy sand with fine particles and abundant organic matters at 25°C and 35 percent. Concentrations are particularly high in the Niger Delta at 20-30 m. Parapenaeopsis atlantica is prevalent at 10-40 m depth while Parapenaeus longirostris is found in deep waters from 60-400 m. Exclusively exploited by small scale operators with passive cane or netting gear in the estuary and with small trawls in the surf zones, the white shrimp Nematopaleamon hastatus, a major shrimp fishery is heavily fished in the creeks and limited to depths up to about 50 m. It constitutes about 50 percent in terms of estuarine catches. Also harvested by artisanal fishermen are the brackish water prawn (Macrobrachium macrobrachion), river prawn (Macrobrachium vollenhovenii) and juvenile pink shrimp (Penaeus notialis = Penaeus duorarum).
The shrimp season in the estuaries is during the dry season between November and May. At sea, it is all year round with peaks during the rains from May to September. The periods between August and September and February to March during which the juveniles are in the creeks and lagoons correspond with the period of low catch rates.
Tuna and tuna-like fishes are the most important pelagic resources in the offshore waters of Nigeria. The targets of the offshore pelagic fishery include Skipjack tuna (Katsuwonus pelamis), Yellow fin tuna (Thunnus albacares) and big eye (Thunnus obesus). Tuna-like fishes also targeted include Euthynnus alleteratus, Sarda sarda and Elagatis bipinnulata.
The fishery of this zone includes fish species like Priacanthidae, Sparidae, Aromidae and shrimps. Pentheroscion mbizi is also abundant within the 50 and 100 m depth. The offshore demersal fishery, which consists mainly of small fishes less than 30 cm total length, is still largely unexploited.
FAO conducted a comprehensive statistical survey of the coastal and estuarine fisheries of Nigeria west of the Niger (Lagos, Ogun, Ondo and Delta States) between 1965 and 1968. The survey traversed about 4 000 miles with visits to over 300 fishing villages and 600 landing sites. Of the 91 203 fishermen estimated, 54.32 percent (i.e. 49 541) were full time. The number of fishing villages and the area of the coastal and estuarine waters of the then Rivers and Cross River States were more than double the western and mid-western survey area (Ssentongo et al., 1983). With this, the number of full time fishermen was put at about 149 000. These figures have been largely influenced upwards over the years due to lack of job opportunities for young school leavers and provision of better socio-economic and educational facilities in the various fishing villages and landing sites.
A mean of 0.95 tonnes per man-year was calculated for full time fishermen while part timers who do only subsistence fishing was calculated on 20 percent of the full time catches. Based on these calculations, full time fishermen were estimated to produce about 141 550 tonnes while part timers produced 28 310 tonnes. The coastal artisanal and estuarine yield was consequently expected to be about 169 860 tonnes.
Tobor and Dublin-Green (1992) estimated there to be 308 740 artisanal fishermen. According to the Federal Department of Fisheries, freshwater fishermen account for 33.3 percent, and 45.68 percent are part-timers. Given this, the number of full time coastal and brackish water artisanal fishermen was calculated to be 308 740 x 0.67 x 0.5432 = 112 364. Assuming 0.95 tonnes per fisherman per year, the annual fish landing was estimated to be 106 746 tonnes. The total annual production figures sum up to 128 095.2 tonnes if the 20 percent production of the part timers is included. This led to the conclusion that the yield of the coastal and brackish water artisanal fisheries ranges between 128 000 and 170 000 tonnes.
Summing up the production of Western (Lagos, Ogun and Ondo States) and Mid-Western (Bendel State) Nigeria as 60 286 tonnes, and assuming identical production rate west and east of the delta, Ajayi and Adebolu (in press) predicted 100 000 tonnes as the potential of the fin fish fishery. They further estimated a potential of 25 000 tonnes for Nematopalaemon hastatus using reported trap catch rates, thereby bringing the coastal and brackish water artisanal fishery potential to 125 000 tonnes which agrees with the range 128 000 - 170 000 tonnes. In contrast, Ssentongo et al. (1983) estimated 190 000 mt as the resource potential.
4.2.1 Shellfish fishery
Ajayi (1982), analysing the 1971-1978 catch and effort data of Nigerian shrimpers using the exponential model, calculated a sustainable yield of 2 008 tonnes for 12 651 days at sea. Ajayi and Adebolu (pers. Comm.), combining shrimp catch data from Cameroonian shrimpers with Nigerian fishing trawlers and shrimpers estimated MSY ranging from 3 250 -4 000 tonnes. Pooling all the estimates, the potential of the Nigerian inshore shrimp resources is put at between 3 250 - 4 016 tonnes.
4.2.2 Fin fish fishery
The 1965-1972 trawl catch and effort data analyzed by Ajayi (1982) using the Fox (1970) exponential model gave an annual MSY of 132 742 tonnes for the inshore trawl fishery. In contrast, Ajayi and Talabi (1984) estimated that the potential of the inshore industrial fin fish fishery using 52 mm cod end mesh ranges between 9 048 and 16 965 metric tonnes. If the 52 mm meshes are replaced by the 76 mm cod end meshes now legal for finfish, a potential of about 20 000 tonnes is possible (Ajayi and Talabi, 1984). The estimated contribution of shrimpers' by-catch to the inshore fish potential is conservatively put at 6 150 - 7 380 tonnes. When the 20 000 tonnes potential possible from the use of 76 mm cod-end meshes is added to the 7 500 tonnes shrimpers' by-catch, the total finfish potential in the 5 - 100 m depth is about 27 500 tonnes.
4.3.1 Demersal
Tobor (1990) reported an average estimate of 6 370 mt as the potential yield of Nigeria's offshore demersal resources. Earlier results from the Guinea Trawl Survey (GTS) estimated approximately 31 000 tonnes as the standing stock within the 50-200 m depth area. The potential of the offshore Royal shrimp, Parapenaeus longirostris, which occurs in this zone from 50-200 m depth, is yet to be determined. Indications are that this is large, and that fishermen only exploit the outer fringes of its distribution.
4.3.2 Pelagic
Early estimates suggested a standing stock of 44 600 tonnes, with a potential yield of 8 920 tonnes. The 1982-1983 pole and line tuna survey conducted by the Nigerian Institute for Oceanography and Marine Research (NIOMR) which averaged 76 tonnes per 30-day trip confirms the potential estimate. Like the demersal resources, and despite the advantageous location relative to the tuna resource and rich endowment, offshore pelagic resources remain largely unexploited.
Akande (1993) and Ajayi (unpublished) examined the demersal and pelagic fish as well as the shellfish components of artisanal catches. Using the number of fishermen and gear, catch per fishermen day, and area of the fishing grounds, he estimated the potential yields of the demersal, pelagic fish and shellfish components as 20 000 - 24 000, 120 000, and 48 000 mt respectively, giving a maximum of 192 000 mt. The distribution of the resource based on the potential yields estimated above is illustrated in Figure 1.
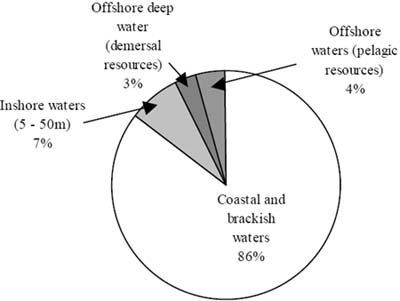
Figure 1. Distribution of potentials yields in marine waters of Nigeria
The marine coastal artisanal fishery constitutes the most important component of the fishery sector, as it is the highest contributor to the total fish production in Nigeria. The fishery is either non-motorized whereby fishing is done not too far from shore, or motorized with out-board or in-board motors fitted to canoes thereby enabling movement farther out to sea (Table 1). Fishermen operating in this sector employ mainly large motorized Ghana-type canoes and operate mostly in waters less than 40 m depth. In 1976, 413 832 fishermen employing 134 337 canoes out of which 8.71 percent was motorized produced 327 561 mt of fish. Production increased in 1977 and 1978 due to the increase in both the numbers of canoes and fishermen. Highest production ever from this sub-sector was in 1982 when 105 239 canoes with 18.6 percent rate of motorization were used by 416 959 fishermen to produce 377 683 mt of fish.
This increase was as a result of the Agricultural policy of the then civilian administration that encouraged the provision of fishing inputs including out board engines to registered Fishermen Co-operative Societies at 50 percent subsidy from 1979 to 1983. The drastic fall in production in 1984 was as a result of the difficulties in supplying fuel and lubricants to the fishing villages due to the then Government's policy on fuel distribution and supply which made it difficult for fishermen to source fuel with which to operate their engines. Lowest production during the period was recorded in 1993 when 106 276 mt of fish were landed by 456 381 fishermen using 77 050 canoes of which 20.82 percent was motorized. This reduction is attributable to the reduction in the number of available crafts, since the number of fishermen remained rather stable.
Table 1. Coastal artisanal fish production 1976 - 1994
|
Year |
No. of Canoes |
% Motorisation |
Part-time Fishermen |
Full-time Fishermen |
Total No. Fishermen |
Fish Production (mt) |
|
1976 |
134 337 |
8.71 |
124 140 |
289 682 |
413 832 |
327 561 |
|
1977 |
137 447 |
8.87 |
127 421 |
297 317 |
424 838 |
331 280 |
|
1978 |
138 247 |
7.32 |
121 989 |
293309 |
425 298 |
336 138 |
|
1979 |
133 728 |
9.35 |
133 846 |
312,306 |
446 152 |
356 888 |
|
1980 |
133 723 |
9.87 |
146 605 |
312,460 |
459 065 |
274 158 |
|
1981 |
120 142 |
15.5 |
160 052 |
280 540 |
440 592 |
323 916 |
|
1982 |
105 239 |
18.6 |
176 057 |
240 902 |
416 959 |
377 683 |
|
1983 |
129 555 |
18.4 |
272 773 |
199 349 |
472 122 |
376 984 |
|
1984 |
109 638 |
22.86 |
197 720 |
144 499 |
342 219 |
246 784 |
|
1985 |
80 688 |
24.55 |
127 615 |
174 619 |
302 234 |
140 873 |
|
1986 |
77 134 |
20.75 |
171 517 |
237 455 |
408 927 |
160 169 |
|
1987 |
76 644 |
21.04 |
184 754 |
252 711 |
437 465 |
145 755 |
|
1988 |
77 144 |
20.76 |
188 767 |
259 083 |
447 850 |
185 181 |
|
1989 |
77 155 |
20.76 |
198 188 |
272 062 |
470 250 |
171 332 |
|
1990 |
76 981 |
20.38 |
190 900 |
261 287 |
452 187 |
170 459 |
|
1991 |
77 093 |
20.79 |
192 958 |
264 144 |
457 102 |
168 211 |
|
1992 |
77 076 |
20.81 |
194 016 |
265 831 |
459 847 |
184 407 |
|
1993 |
77 050 |
20.82 |
192 624 |
263 757 |
456 381 |
106 276 |
|
1994 |
77 073 |
20.8 |
193 198 |
264 577 |
457 775 |
124 117 |
Source: Federal Dept. of Fisheries (1995)
The inshore sub-sector is the most productive and intensely exploited zone of the Nigerian continental shelf. Trawlers used in exploiting the inshore waters increased from 149 in 1985 to 304 in 1994 (Table 2).
Table 2. Licensed inshore trawlers and their total fish and shrimp landings - 1985 - 1994
|
Year |
Registered Vessels |
Landings (tonnes) |
||||
| |
Fishing |
Shrimping |
Total |
Fish |
Shrimps |
Total |
|
1985 |
109 |
40 |
149 |
23 766 |
2 376 |
26 142 |
|
1986 |
137 |
54 |
191 |
22 419 |
2 623 |
25 042 |
|
1987 |
161 |
82 |
243 |
21 383 |
3 517 |
24 900 |
|
1988 |
161 |
132 |
293 |
32 740 |
2 868 |
35 608 |
|
1989 |
134 |
158 |
292 |
28 411 |
5 234 |
33 645 |
|
1990 |
123 |
195 |
318 |
21 120 |
3 666 |
24 786 |
|
1991 |
102 |
195 |
297 |
28 768 |
6 200 |
34 968 |
|
1992 |
75 |
203 |
278 |
25 592 |
9 373 |
34 965 |
|
1993 |
83 |
223 |
306 |
22 464 |
8 956 |
31 420 |
|
1994 |
74 |
230 |
304 |
21 886 |
7 884 |
29 770 |
Source: Federal Dept. of Fisheries (1995)
These trawlers range between 50 and 200 Gross Registered Tonnage (GRT), but most of them fall within the 100-150 range. More than 50 percent of these vessels have GRT higher than the approved maximum (130 GRT). This is because vessels licensed prior to the promulgation of the Sea Fisheries Decree and Regulations were allowed to remain in use. Recent fisheries regulations provide that fish trawls carry 76 mm stretched cod-end mesh sizes while shrimp trawls are permitted to carry trawl cod-end with 44 mm stretched mesh sizes. The capacity of the vessels' main engines varies between 165 and 800 HP. Although no limitation is placed on fishing/shrimping vessels' engine capacity by law, more than 55 percent of shrimp vessels are fitted with engines of between 500-550 HP. The average cruising speed of most of the vessels is about 11 knots per hour while the trawling speed is three knots. Fish finding equipment on the vessels is mainly the echo sounder. Catch is preserved in fish-holds usually between 40-50 mt capacity maintained at a temperature of 350C. Most shrimp vessels in addition are fitted with plate freezers capable of quick freezing 0.5 tonnes of shrimps packaged at sea/hour.
The history of a serious private sector led trawl fisheries initiative in Nigeria started in 1982 with the introduction of 49 medium size TR-13 trawlers allocated to registered Fishermen Co-operative Societies into the inshore fishery. However, tremendous growth in trawl fishing was witnessed in 1985 with the deployment of 149 fishing and shrimping vessels, harvesting a total of 23 766 mt of fish and 2 376 mt of shrimp. The number of licensed vessels increased to 191 in 1986 producing 22 419 mt of fish and 2 623 mt of shrimp. Though the number of vessels increased to 243 in 1987, fish production dropped to 21 383 mt while shrimp production increased to 3 517 mt. In 1989, number of fishing vessels dropped to 134, a reduction by 16.8 percent, from the 161 operated in 1988 while shrimpers increased to 158, a percentage increase of 19.7 percent. During this year, fish production reduced by 13.2 percent to 28 411 mt while shrimp production rose by 82.5 percent to 5 234 mt. As from 1989, the number of vessels licensed for shrimping within the inshore zone outnumbered those licensed for fishing, and the trend has since been sustained. Fish production figures started to slide as from 1991 while that of shrimps remained relatively high probably due to the increasing number of vessels licensed for its harvesting. Table 3 presents the number of vessels licensed for inshore operations and their total production figures from 1985 to 1994.
From Table 1, the maximum sustainable yield for the coastal inshore pelagic resources, estimated at around 190 000 mt, was exceeded in the period between 1976 and 1984 when production figures ranged between 246 784 and 377 683 mt. During this period, the lowest number of canoes deployed was 105 239 while the highest was 138 247. With 342 219 fishermen in 1984 using the lowest number of canoes during the period, production still exceeded the MSY for the fishery. The lowest fishing capacity of 105 239 canoes in 1982 yielded the highest production figure during the entire period covered. In 1985, when the number of canoes went down by 26.40 percent to 80 688 with 24.55 percent motorization and 302 234 fishermen engaged, production went down by 42.92 percent to 140 873 mt from 246 784 mt produced the previous year. However, from 1985 to 1994, despite the relatively stable number of fishermen involved production from the sector dropped, probably due to the drastic reduction in the number of canoes and fishing effort applied. Production during this period fell to levels below the MSY.
The ratio of canoe to fishermen between 1976-1980 was 1:3 (Table 3), during which average annual production per fisherman was 792 kg. The ratio went up to 1:4 between 1981 and 1983 without any drop in average productivity. However, during the period 1987 to 1994, the ratio increased to 1:6 and productivity dropped to an all time low of 233 kg per fisherman in 1993. The reason that could be adduced is that the ratio of one canoe to six fishermen was too high and constituted a waste of available labour and manpower resources. A safe conclusion is that the fall in production was a factor of the reducing number of crafts available to the fishery, as such; the number of crafts should be increased to a level that will sustain the canoe/fishermen ratio at 1:3 to generate higher productivity. More motorized canoes must, therefore, be made available to the artisanal fishermen most probably at the 1982 level to achieve this objective, as available data indicate that the stock is still able to absorb more fishing effort and capacity without adverse effects on the resource.
Table 3. Artisanal fisheries productivity assessment - 1976-1994
|
Year |
No. of canoes |
Total No. fishermen |
Fish (mt) production |
Fishermen/canoe |
Productivity kg/canoe/year |
Productivity kg/fisherman/year |
|
1976 |
134 337 |
413 832 |
327 561 |
3 |
2 438 |
792 |
|
1977 |
137 447 |
424 838 |
331 280 |
3 |
2 410 |
779 |
|
1978 |
138 247 |
425 298 |
336 138 |
3 |
2 431 |
790 |
|
1979 |
133 728 |
446 152 |
356 888 |
3 |
2 669 |
799 |
|
1980 |
133 723 |
459 065 |
274158 |
3 |
2 050 |
597 |
|
1981 |
120 142 |
440 592 |
323 916 |
4 |
2 696 |
735 |
|
1982 |
105 239 |
416 959 |
377 683 |
4 |
3 589 |
906 |
|
1983 |
129 555 |
472 122 |
376 984 |
4 |
2 910 |
798 |
|
1984 |
109 638 |
342 219 |
246 784 |
3 |
2 251 |
721 |
|
1985 |
80 688 |
302 234 |
140 873 |
4 |
1 746 |
466 |
|
1986 |
77 134 |
408 927 |
160 169 |
5 |
2 077 |
392 |
|
1987 |
76 644 |
437 465 |
145 755 |
6 |
1 902 |
333 |
|
1988 |
77 144 |
447 850 |
185 181 |
6 |
2 400 |
413 |
|
1989 |
77 155 |
470 250 |
171 332 |
6 |
2 221 |
364 |
|
1990 |
76 981 |
452 187 |
170 459 |
6 |
2 214 |
376 |
|
1991 |
77 093 |
457 102 |
168 211 |
6 |
2 182 |
368 |
|
1992 |
77 076 |
459 847 |
184 407 |
6 |
2 393 |
401 |
|
1993 |
77 050 |
456 381 |
106 276 |
6 |
1 379 |
233 |
|
1994 |
77 073 |
457 775 |
124 117 |
6 |
1 610 |
271 |
The main reason attributable to the fall in the number of canoes, both motorized and non-motorized, was the rise in the cost of fishing inputs. This was occasioned by the withdrawal of the 50 percent subsidy on fishing inputs hitherto given by Government and the fall in the value of the Nigerian currency due to the global economic recession, which made the prices of imported items including fishing inputs prohibitive. Fishermen who are mainly rural based lack collateral, and credit facilities were not readily available to enable them procure the inputs at the prevailing market prices.
The available data (Table 2) indicate that the MSY of 27 500 mt for fish (Ajayi and Talabi, 1984) and between 3 250 and 4 016 mt for shrimp resources (Adetayo, 1982; Ajayi, 1982) was exceeded in 1988, 1989 and 1991. The data also indicate that the number of vessels licensed for fishing has consistently fallen since 1988 in favour of shrimp vessels to the extent that only 74 vessels out of 304 were licensed for shrimping which by law are allowed to carry trawls with 44 mm cod-end meshes. The 20 000 mt MSY for the finfish fishery calculated on 76 mm cod-end mesh trawls is therefore unattainable under the circumstance. Accordingly, catch has continued to be in excess of the MSY for the finfish resources till date. This is probably responsible for the noticeable decline in the size and quality of fish landed since 1991.
An early estimate of the capacity fleet size suggested that the 10 000 tonnes demersal finfish potential is only able to support 40 trawlers, operating at between 240-250 days per year, with an average catch of approximately 1.0 mt per day. Using this estimation, the daily CPUE for fish for the period 1985-1994 is as contained on Table 4. A logical deduction is that vessels during the period covered, operated at CPUE lower than earlier estimated by Longhurst. This is an indication of excess fishing capacity between 1986 and 1991. Hence, the CPUE did not increase even when the capacity went down to 75 vessels from 102 in 1992. Using the earlier assumption of an average catch of 1.0 mt of fish per vessel at between 240-250 days/year operation, a realistic capacity required to sustainably harvest the 16 620 mt potential (Tobor, 1990) inshore fin fish fishery would therefore be 65 vessels.
Table 4. Production of inshore fishing vessels licensed from 1985 to 1994
| |
1985 |
1986 |
1987 |
1988 |
1989 |
1990 |
1991 |
1992 |
1993 |
1994 |
|
Vessels |
109 |
137 |
161 |
161 |
134 |
123 |
102 |
75 |
83 |
74 |
|
Fish |
20 658 |
19 452 |
16 632 |
25 826 |
16 793 |
10 786 |
10 921 |
6 300 |
4 292 |
5 493 |
|
Shrimp |
1 016 |
1 549 |
2 298 |
1 168 |
1 454 |
786 |
1 248 |
1 270 |
761 |
639 |
|
Fish cpue/day |
.790 |
.592 |
.430 |
.668 |
.520 |
.365 |
.446 |
.350 |
.215 |
.309 |
Adapted from Federal Department of Fisheries (1995)
Between 1989 and 1990, the recorded annual shrimp catch was more or less close to the maximum potential available to Nigeria. Effort on the other hand continued to rise. This resulted in a decline in shrimp catch per unit effort and a corresponding increase in incidental fish catch. Apparently in response to the declining shrimp CPUE, shrimp trawl operators resorted to using 32-35 mm cod-end meshes in violation of existing regulations. Figures for shrimp landings both published and unpublished MCS data confirm that production has been in excess of the MSY for the shrimp fishery. Daily CPUE for shrimpers according to MCS records from 1996 to 1998 has been between 150-170 kg even when the number of days fished per year is less than 180. This is indicative of excess effort, which may culminate in serious resource depletion if the trend is not checked. In order to redress the situation, an assessment of the capacity required to sustainably harvest the shrimp fishery producing 250 kgs at an effort of 240 days per year is estimated at between 54 and 70 vessels (Table 5).
Table 5. Estimates of the number of vessels the Nigerian shrimp potential of 3,250 - 4,016 tonnes can support annually
| |
Potential range of(m.t.) |
|||
| |
3 250 - 4 016 |
3 250 - 4 016 |
3 250 - 4 016 |
3 250 - 4 016 |
|
Shrimp catch rate kg/day at sea |
250 |
270 |
300 |
330 |
|
Total effort (days at sea) |
13 000 - 16 064 |
12 037 - 14 874 |
10 833 - 13 387 |
9 848 - 12 170 |
|
No. of vessels required. at 250 |
52 - 64 |
48 - 59 |
43 - 54 |
39 - 49 |
|
No. of vessels required. at 300 |
43 - 54 |
40 - 50 |
36 - 45 |
32 - 41 |
Source: Ajayi and Talabi (1984)
Estimated potentials of the demersal and pelagic resources of Nigerian offshore waters are put at between 6 370 mt and 8 920 mt (Tobor, 1990). Both the demersal and pelagic resources have remained largely unexploited.
Presently, efforts are being vigorously pursued to encourage investment in the sub-sector to boost local fish supply and foreign exchange earnings through exportation of processed and canned tuna fish.
The commercial fishing fleet has the tendency to expand beyond the level required to harvest the available resources, since valuable fish stocks are capable of yielding harvests of greater value than the cost of harvesting. The accruing resource rent, however, varies among fisheries. Since the stock is being harvested as a common property by the fishing enterprises, the resource rent induces them to expand their fishing capacity, even beyond the level required to efficiently harvest the resource. In the absence of any intervention towards preventing or limiting this tendency, the potential resource rent becomes dissipated with time through overcapitalization and high costs in employing labour just as the situation was between 1987 and 1994 in the artisanal sub-sector. If this process is left unchecked, it will result in wasteful expansion of fishing power and resource depletion.
Various regulatory steps have continued to be taken by the Federal Department of Fisheries responsible for the management of Nigeria's fisheries resources to control fishing effort and expansion of fishing capacity in order to ensure sustainable exploitation of its marine fisheries resource. However, since a successful programme of fisheries rationalization must be gradually implemented, and with minimal disruption of established interests, the measures adopted have been subjected to modification and elaboration as the regulatory programmes evolve over time based on the conditions of the resource.
Fishing capacity in Nigeria's multi species fishery has expanded sufficiently to fully exploit the inshore demersal resources. The inshore pelagic resources are still capable of yielding increased harvests while the offshore fisheries resources, both pelagic and demersal, are largely unexploited, and as such able to accommodate reasonable level of fishing capacity. Accordingly, fisheries development policy is directed towards preventing expansion of sectors in which capacity is already sufficient and extending fleet range. To this extent, the first all embracing Sea Fisheries Decree (No. 30) was promulgated in 1971. The Fishing and Licensing Regulations of the Decree were enacted in 1972. Following lapses observed in the effectiveness of this Decree over time, it was repealed and replaced by the Sea Fisheries Decree No. 71 of 1992. The main Decree contained general provisions for the conditions relating to the issuance of fishing and shrimping licences, vessel operations, duties and powers of Authorized Persons and penalties for offences committed. The Sea Fisheries (Fishing and Licensing) Regulations enacted under the new Decree contained provisions almost similar to those of the repealed Sea Fisheries (Fishing and Licensing) Regulations of Decree No. 30 of 1971. However, it provided for wider and stiffer penalties for offenders, extended the non-trawling zone from two to five nautical miles and lifted the embargo on fishing within the Lagos West fishing grounds.
Though many measures could be adopted to regulate the fisheries, every instrument of control has to be considered on its own merit as it is targeted at solving specific problems. Such regulatory problems include regulating the catch composition, regulating the size of the catch, efficient and effective distribution of effort among the various fisheries, preventing monopolistic tendencies and practices, and maintenance of efficiency in the fishing process.
Having identified most of the problems of Nigeria's marine fisheries, various control measures are being adopted to rationalize the efforts and capacity employed in harvesting them.
It has been recognized that restriction on fishing gears serves a useful purpose in increasing yields by influencing the composition and quality of the catch. It is also a means of controlling the total catch or the total fishing effort. Accordingly, a stretched cod-end mesh size of 76 mm for fishing trawls and 44 mm for shrimp trawls have been specified for all affected vessels operating within Nigeria's maritime waters. This is to improve the composition of catch and prevent destructive fishing by trawlers. The measure is expected to allow the escapement of juvenile shrimp and fishes. Apart from this, enforcement of the cod-end mesh specification will result into a corresponding increase in the age and mean weight of the shrimp and fish caught by trawlers. Consequently, the gain in value (i.e. catch of large shrimp and fish) would be proportionally more important than the gain in tonnage. The heterogeneity of species of different sizes poses a problem in the use of the specified cod-end mesh sizes, as it will over protect fish of small sizes.
The Sea Fisheries (Fishing) Regulations of 1972 prohibited trawl fishing within the first two nautical miles of the waters of Nigeria's continental shelf. The area covered by this prohibition is referred to as the 'non-trawling zone'. This zone was further extended to five nautical miles by the 1992 Sea Fisheries Decree Fishing Regulations. Conflicts among different types of gears have led to serious confrontation between trawler operators and artisanal fishermen within this area. This measure, therefore, gives artisanal fishermen exclusive rights to operate without molestation by trawlers within this zone.
Shrimp trawling was prohibited in the inshore waters of the Lagos West fishing grounds in 1972. Such control serves a valuable purpose in protecting stocks from destructive fishing by trawlers thereby improving the value and productivity of the resource. This prohibition order was lifted in 1992 after Government ensured that the fishing ground had sufficiently recovered.
In order to control expansion of fleet capacity, fishing vessels are required by law to be licensed before they are allowed to operate within Nigeria's territorial waters and the Exclusive Economic Zone. Before a new vessel is licensed, the intending operator (applicant) must have obtained a Letter of Pre-purchase Assurance from the Director of the Federal Department of Fisheries that the proposed vessel would be granted a licence if procured. The applicant shall be required to submit an application supported by a feasibility report on the proposed fishing venture; specifications of the proposed vessel including tonnage, length over-all (LOA), year of construction and horse power; and a letter of support for fishing in foreign waters, among others. Existing vessels are also required by law to apply for and be issued with current licences before they can operate. The validity of a licence is for a period of one year, starting from January to December. All licences should be renewed at the end of the month of December of every year. The Minister of Agriculture and Rural Development who is the Licensing Officer, has powers to refuse to issue a vessel with a licence without appropriating any reasons for so doing. A licence may also be suspended or withdrawn if the owner is found guilty of infractions of fishing regulations.
Fees charged for the issuance of licences were recently increased. In 1996, licensing fee for shrimp and fishing vessels was N4 000:00 and N3 000:00 respectively. These fees were harmonized and increased to N120 000:00 with effect from January 1999, irrespective of whether the vessel is employed for shrimping or fishing. The fees provide Government with the opportunity to share the value of the resource rent without adversely affecting the incomes of the vessel operators.
Vessels intended for fishing in Nigeria's territorial waters shall not exceed 25.3 m LOA and 150 gross tonnage while shrimp vessels shall not be more than 23.2 m LOA and 130 gross tonnage. These requirements apply to all new vessels, but vessels existing before the regulations came into effect are allowed to remain until they are retired.
Licences are not transferable in Nigeria. In the case of a vessel transferred to a new owner, a deletion certificate shall be caused to be issued by the Inspector of Shipping in the Federal Ministry of Transport where vessels are normally registered. The new owner shall thereafter apply to the Federal Minister of Agriculture and Rural Development for a licence, subject to the same conditions prescribed for new vessels. A licence issued for fishing is not valid for shrimping and vice versa.
According to the Inland Fisheries Decree No. 108 of 1992, artisanal fishing canoes must also be registered and licensed by the Ministry responsible for Fisheries matters in the states used as bases by the fishermen before they can operate. This measure is intended to effectively limit the amount of effort and capacity that can be applied to fish in both the inland and inshore waters of Nigeria.
Government, in an effort to stimulate the development of the fisheries sub-sector, adopted various forms of subsidy arrangements of up to 50 percent on all canoes, fishing equipment and spare parts supplied by it to members of registered Fishermen Co-operative Societies up till 1984. This subsidy was withdrawn when Government was satisfied with the level of capacity development in the sub-sector. Fishermen now procure or are supplied with fishing items whenever available at the current market rates.
The supply of Automotive Gas Oil (AGO) at the Rotterdam bunker wire price to trawl fisheries operators has been cancelled. Operators now procure fuel at the normal market rate.
The Government has initiated steps towards redistributing fishing capacity and efforts with respect to the potential yields of the different stocks. Transfer of excess fishing efforts from the inshore waters to new grounds is being done by licensing vessels to fish in the Exclusive Economic Zone and in waters of neighbouring coastal States with which Nigeria has Fishing Rights Agreement. Such Agreements have in time been entered into with Equatorial Guinea, Sierra Leone and Angola. Licences issued under these Agreements are valid only over the stocks for which they are issued. This measure is to relieve pressure over the inshore resources that have started to manifest signs of overexploitation.
An elaborate consultative mechanism exists between government and representatives of owners of fishing vessels licensed to operate Nigerian flagged vessels within or outside Nigerian waters. All vessel owners are required to be members of the Nigerian Trawlers Owners' Association (NITOA), an umbrella organization for all fishing trawl operators, and which plays a vital communications role between its members and Government on all issues that affect its members. The Association is usually consulted on all matters that affect its members and suggestions made by it are usually given serious consideration before decisions are taken.
Once a restrictive licensing system is in place, its effect on the pattern of fleet development and the evolution of the fleet's fishing power should be watched continuously in order to assess the efficacy of the controls and the need for supplementary measures. This implies some form of systematic monitoring as it will be particularly important to identify the form and degree of technological distortions that result from the restrictions and their consequences for the fleet's aggregate capacity and overall behaviour of the resource.
In 1991, the Government of Nigeria established the National Fisheries Resources Monitoring, Control and Surveillance (MCS) Unit in the Federal Department of Fisheries in order to achieve the above objectives. Its mandate is to ensure that adequate data on effort and capacity used in harvesting the nation's fisheries resources are collected and collated for its sustainable management. Other functions of the Unit include Search and Rescue Operations for distressed fishing vessels in collaboration with the Nigerian Navy, Sea patrol and surveillance to ensure compliance with fishing regulations and monitoring of the resource to enable it advise Government on the state of the resource.
Nigeria's marine fisheries resources have undergone considerable development within the last two decades, particularly in the inshore demersal trawl fisheries sub-sector to the extent that production from the sub-sector has in the last few years been consistently higher than the estimated yield. Nigeria's fisheries resources have potentials of withstanding sustained exploitation under effective management. The coastal inshore artisanal fishery is still able to absorb a little more effort and capacity to enable production meet up with the potential yield. Inshore pelagic, offshore demersal and pelagic resources remain largely untapped. Current efforts towards diverting fishing efforts from the coastal inshore demersal operations to deeper waters where the snapper and abyssal fauna are either under exploited or yet to be exploited are desirable for the achievement of sustainable exploitation of the resource.
It is however essential in the national interest that there should be a clear understanding of fishing capacity development on capital, labour and fish resources, both in the short and long term. The choice of the most appropriate combinations is not easy since the benefits, both direct and indirect, will be distributed in different ways. In some cases, the sustenance or increase of the revenue to fishermen and contributions to the economy are paramount. In others, the choice is to develop fisheries as a means for meeting social objectives and increasing the opportunities for employment. Whatever the choice, fishing capacity should be determined and maintained at such a level that exploitation is rational and management sustainable.
Adetayo, J. A. 1982. The Recent Trends and Future Prospects of the Nigerian Shrimp Fishery. Technical paper No. 4. Nigerian Institute for Oceanography and Marine Research, Lagos.
Ajayi, T. O. 1982. The Maximum Sustainable Yields of the Inshore Fish and Shrimp Resources of the Nigerian Continental Shelf. Journal of Fisheries Biology, 20: pp. 571-577.
Ajayi, T. O. & Adebolu [in press] Catch Assessment of Commercially Important Finfish of Nigeria's Trawling Industry. Journal of West African Fisheries [in press].
Ajayi, T. O. & Talabi, S.O. 1984. The Potential and Strategies for Optimum Utilization of the Fisheries Resources of Nigeria. Technical paper No. 18. Nigerian Institute for Oceanography and Marine Research, Lagos.
Ajayi, T.O. & Adetayo, J..A. 1982. On the Fish By-Catch and Discard of the Shrimp Fishery of Nigeria. Technica Paper No. 5. Nigerian Institute for Oceanography and Marine Research, Lagos.
Akande, G.R. 1993. Potentials of Fish Resources and Utilization in the Artisanal and Industrial Fisheries in Nigeria. Coastlines of West Africa. American Society of Civil Engineers, New York, pp. 54-64.
Federal Department of Fisheries. 1995. Fisheries Statistics of Nigeria, 3rd Edition. Federal Department of Fisheries publication. Abuja.
Fox, W.W. Jr. 1970. An exponential surplus-yield model for optimizing exploited fish populations. Trans. Am. Fish. Soc., 99:80-8.
Ssentongo, G.W., Ajayi, T.O. & Ukpe, E. T. 1983. Report on A Resource Appraisal of the Artisanal and Inshore Fisheries of Nigeria. FAO Field Document 2. FI: DP/NIR/77/001. Rome, FAO.
Tobor, J.G. 1990. The Fishing Industry in Nigeria - Status and Potential for Self Sufficiency in Fish Production. Technical Paper No. 54. Nigerian Institute for Oceanography and Marine Research, Lagos.
Tobor, J.G. & Dublin-Green, C.O. 1992. Marine Resources and Activities in Nigeria. Technical Paper No. 84. Nigerian Institute for Oceanography and Marine Research, Lagos.
|
[83] Federal Department of
Fisheries, Lagos, Nigeria. |
![]()
![]()
![]()