![]()
![]()
![]()
Abstract: The multigear and multispecies Spanish artisanal fishery in the Gulf of Cadiz contains a fleet of about one thousand vessels capturing more than forty commercial species. From this complexity arises the need to define fishing trip type and fleet components (i.e. groups of vessels developing the same fishing pattern through the year), which permits the monitoring of fishing effort and the design of simpler and more efficient sampling schemes.
In order to define the artisanal fleet components, the daily landings by species and vessel carried out during 1996 were considered. In a preliminary analysis, a total of 53 'fishing trip types' were objectively characterized from the species composition using hierarchical Cluster Analysis techniques (CA). A non-hierarchical k-means CA was also applied to re-classify the 1996 data and to classify 1997 landings data by trip type. The red seabream (Pagellus bogaraveo), red banded seabream (Pagrus auriga), octopus (Octopus vulgaris) and striped venus (Chamaela gallina) types stood out as important indicators of fishing trip type.
In a second stage, only those vessels with more than 50 daily landings regularly distributed through the year were selected. A new CA was applied in order to group vessels that show similar fishing annual pattern. Eleven fleet components were defined from these results. Two basic features of these components were that they were highly related to the landing (home) ports and the fishing gears used, and showed definite seasonal fluctuations according to the main fishing trip types developed.
There is considerable disagreement about the definition of an artisanal fishery. Regional and national administrations categorize vessels as artisanal on the basis of criteria including administrative, socio-economic and technical aspects (i.e. vessel's characteristics, crew, fishing gears and methods, fishing time, etc). However, the thresholds selected by the various fishery administrations for such criteria may be different, even at a national scale, making difficult any comparative analysis (Camiñas, 1996).
Despite these discrepancies in cataloguing this activity, artisanal fisheries are considered to be of significant socio-economic importance. This is true also in the EU, and particularly in the Mediterranean countries and in the Atlantic waters of Spain and Portugal. Nevertheless, great difficulties arise when an attempt is made to monitor this fishing activity under the previously established national sampling schemes, which were basically designed for studying industrial or semi-industrial fisheries (e.g. see Charbonier and Caddy (1986) for a revision of this problem in Mediterranean artisanal fisheries). The artisanal fisheries are characterized by their multispecies and multigear nature, and are exploited by a high number of highly heterogeneous vessels. The fishing activities of these vessels are directly influenced by climatic factors, seasonality and economic conditions. Therefore, all of these factors limit the usefulness of such sampling programmes.
The current procedures for fish stock assessment require adequate information on the effort and catch data by métier, as well as estimates of the relative abundance of the main fish stocks. For this to be effective, it is necessary to be able to correctly identify métiers, and to compute the effort effectively directed to each main target species as well as the corresponding catch per unit of effort (CPUE).
The Spanish artisanal fishery of the Iberian South Atlantic Coast is a multispecies, multigear fishery exploiting the demersal resources of the near shore area (Figure 1). More than 900 vessels are involved in this fishery, employing approximately 3 000 fishermen. These vessels are generally small, with average lengths of 7.7 meters, five gross tonnage register and 58 horsepower engines (Sobrino et al., 1994). These characteristics limit the range of activity by the fleet, although they make a great number of daily fishing trips along the year. The vessels are highly versatile, adapting to seasonal conditions and often employing complementary gear during the same fishing trip to improve their catches. This structure makes the collection of basic effort and catch data by métier, and the computation of CPUE, particularly difficult.
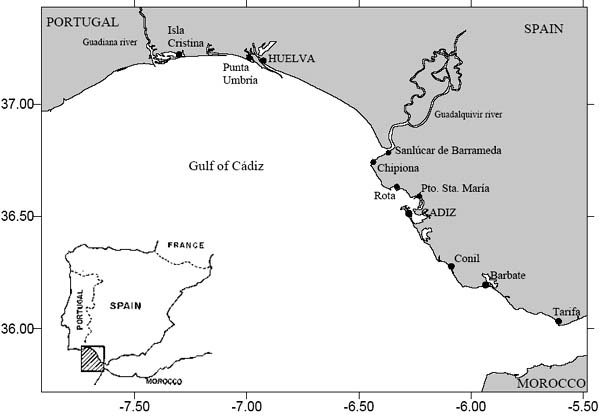
Figure 1. Gulf of Cádiz: Main landing ports of the artisanal fleet
The fishery targets a complex of high-value species, including several flatfish, Sparids, hake, cephalopods, crustaceans and bivalves. More than 50 different species are landed and captures are made with a great and diverse number of fishing gears like trammel nets (trasmallos) and gillnets (parguera, volanta), hand jigs (chivos, pulperas) and longlines (palangres, voracera), traps (nasas, alcatruces) among others (Anon., 1994). There are presently no reliable estimates of the fishing effort exerted on these stocks, nor of their abundance.
Given all this complexity, the necessity of defining different fleet components is apparent. Fleet components are defined as those groups of vessels that carry out the same exploitation pattern along the year. It is expected that consideration of the fleet component concept will allow the design of simple, more effective and beneficial sampling strategies for the artisanal fishery based on the improved knowledge of its exploitation pattern. Also, the following methodology is shown to be a very useful tool not only for monitoring the artisanal fishing activity, but also for assessing its socio-economic impacts.
The daily landings of the artisanal fishery during 1996 in the main ports of the Spanish South Atlantic region were used for the definition of the fleet components. This information was derived from the daily sales returns for each vessel. A matrix was built from this database file whose rows (cases) were the daily landings and the columns (variables) were the captured species, resulting a total of 25 394 fishing trips and 53 species.
Fishing trip types were preliminary characterized using multivariate analysis techniques based on the mean specific composition of the catches. Cluster Hierarchical Analyses (CA) were carried out using the Euclidean Distance (ED) as similarity index and the Unweighted Paired-Group Mean Average (UPGMA) as clustering algorithm. Prior to undertaking the Cluster Analyses, the original matrix (expressed in Kg) was transformed into a CPUE matrix (using the number of fishing days per fishing trip as the effort unit) and then to a percentage CPUEs matrix to standardize these values. After standardization, Cluster Analyses were carried out for all landings in each month.
The resulting groups were then combined month by month for obtaining the artisanal representative fishing trip types. Afterwards, descriptive analyses were applied by trip type to obtain the mean specific composition of the landings and the vessels that integrate each group, which define each trip type.
Following this, a Non Hierarchical Cluster Analysis of K-means was applied to the matrix (which included the new variable, trip type) to reclassify the previously classified landings. The method is based on the closest centroid output, i.e. each case is assigned to a cluster based on the criteria that the distance to its center should be minimum. To calculate the centre of each trip type, the variables were standardized, obtaining the z-variables (variable mean/standard deviation), and later calculating for each group the mean of each standardized variable. These variables are the centres of each group. Once the table of centres is estimated, a K-mean Cluster Analysis with known centres was applied to the matrix of percent CPUEs to reclassify the landings, using as variables the z-variables, on the basis of the least Euclidean distance to the centres of the groups (Norusis, 1997; Visauta, 1998).
The definition of fleet components was based on the fishing pattern that each vessel exhibited each year. That is, the pattern resulting from the dispersion of their fishing trip types each month, and the combination of fishing trip types within each month, over the period of 1 year. A fleet component was then defined as groups of vessels presenting a similar fishing pattern over a year. This means that the hypothesis to be tested involves not only the similarities among vessel fishing trips grouped in fishing trip types, but also its distribution by month, over the period of one year.
The fishing trips over the period 1996 to 1997 were re-classified into 53 distinct fishing trip types, each with a distinct species catch composition. Thus, each active vessel had its own trips classified into one or more of the possible 53 fishing trip types per month over the year.
After assigning all the landings to the different fishing trip types, a frequency analysis was carried out to determine the number of fishing trips per vessel and year. Only the vessels with at least 50 fishing trips regularly distributed along the 12 months of the year were chosen. A matrix was constructed with as many variables as fishing trip types done by each vessel in every month (fishing trip types x 12 months) and as many cases as the number of selected vessels. The number of fishing trips by vessel, Ni (i=1.....n), is given by:
|
|
(1) |
where the indexes j and k, (j=1,...,53; k=1,...,12) represent fishing trip types and month, respectively.
The raw data matrix N, can be defined as N = {Nijk}, where each row vector (case) represents a unique vessel i, and their elements Nijk, are the number of trips associated with each variable (each of the possible combinations between fishing trip types and months). The Cluster Analysis method was used to identify similarities between the vessels, for a maximum of 53x12 variables.
During the aggregation phase, the UPGMA method starts with each case (vessel) in a separate cluster (fleet components), and combines them through various stages until only one cluster is left. This means that the number of groups can be analyzed at different levels of aggregation, each one representing a specific optimal number of groups.
The same methodology used to assess the 1996 fleet components was applied to the 1997 artisanal fleet landings. With regard to the 1997 data matrix, 166 vessels were analyzed from the database for that year, and which had fleet components already assigned through the cluster analysis. Once obtained, the 1997 fleet components were selected in both years to analyze the extent to which the vessels belong to one or another different fleet component.
A total of 53 fishing trip types were defined. The results obtained after the landing reclassification through the k-means procedure were very similar to those obtained from the Hierarchical Cluster Analysis. The specific composition of the three main species from the fishing trips that integrate each fishing trip type, expressed in percent CPUE, as well as the importance (in weight and number) of these landings is shown in Table 1.
VORZ-M, URT and PUL-M fishing trip types account jointly for almost a third of the total number of landings of the whole artisanal fleet. Their respective main species are the red seabream (Pagellus bogaraveo), red banded seabream (Pagrus auriga) and the octopus (Octopus vulgaris), respectively. Such species account for 97.7 percent, 64.8 percent and 99.8 percent of the total CPUE of each fishing trip type.
Table 1. Fishing trip types. Specific composition of the most important species (% CPUE) and their importance in weight and in number of landings
|
1996 Fishing Trip Type |
Species in percentage decreasing importance of the total of the fishing trip type |
Weight of the catch |
% of the total annual catch |
Nr. of landings. |
% of langings |
|||||
|
1 st. species |
2 nd. species |
3 rd. species |
%(1st.) |
%(2 nd) |
% (3rd) |
|||||
|
VORZ-M |
Red seabream |
Rockfish |
Wreckfish |
97.7 |
1.5 |
0.5 |
260 309 |
12.55 |
4412 |
17.37 |
|
URT |
Red banded seabream |
Common Seabream |
Gilthead seabream |
64.8 |
12.7 |
8.4 |
121 056 |
5.84 |
2260 |
8.90 |
|
PUL-M |
Octopus vulgaris |
Cuttlefish |
Common Seabream |
99.8 |
0.1 |
0.1.1 |
168 860 |
8.14 |
1811 |
7.13 |
|
LANG-M |
Caramote prawn |
Wedge sole |
Cuttlefish |
98.4 |
0.6 |
0.4 |
22 039 |
1.06 |
1447 |
5.70 |
|
BOR |
Common and Red pandora |
Seabreams |
Common and Red pandora |
53.9 |
8.8 |
5.1 |
88 082 |
4.25 |
1059 |
4.17 |
|
URT-M |
Red banded seabream |
Common Seabream |
Octopus vulgaris |
90.9 |
3.4 |
1.7 |
45 418 |
2.19 |
970 |
3.82 |
|
BIV |
Striped venus |
Carpet shell |
|
97.4 |
2.6 |
|
196 302 |
9.46 |
806 |
3.17 |
|
ACE-M |
Wedge sole |
European hake |
Caramote prawn |
98.6 |
0.4 |
0.3 |
94 337 |
4.55 |
753 |
2.97 |
|
BOC |
Common Seabream |
Red banden seabream |
Seabreams |
49.5 |
12 |
7.0 |
25 913 |
1.25 |
670 |
2.64 |
|
LANG |
Caramote prawn |
Cuttlefish |
Wedge sole |
45.4 |
13.7 |
9.9 |
39 245 |
1.89 |
576 |
2.27 |
|
CH |
Cuttlefish |
Soles |
Octopus vulgaris |
54.9 |
13.4 |
8.6 |
38 694 |
1.87 |
553 |
2.18 |
|
SARG |
Seabreams |
Rubberlip grunt |
Gilthead seabream |
60.6 |
4.1 |
3.9 |
36 018 |
1.74 |
535 |
2.11 |
|
CONG |
European conger |
Common Seabream |
Rubberlip grunt |
45.0 |
13.6 |
6.7 |
38 107 |
1.84 |
471 |
1.85 |
|
DOR |
Gilthead seabream |
Red banden seabream |
Seabreams |
60.5 |
10.8 |
7.3 |
24 438 |
1.18 |
451 |
1.78 |
|
LENG |
Soles |
Cuttlefish |
Caramote prawn |
57.9 |
14.5 |
5.6 |
21 217 |
1.02 |
445 |
1.75 |
|
HER |
Striped seabream |
Meagre |
Common and Red pandora |
54.1 |
5.2 |
5.2 |
36 684 |
1.77 |
436 |
1.72 |
|
CAZ |
Tope shark |
Rubberlip grunt |
Red banden seabream |
62.3 |
7.8 |
5.8 |
53 229 |
2.57 |
387 |
1.52 |
|
BRE |
Common and Red pandora |
Rubberlip grunt |
Axillary Seabream |
53.9 |
9.6 |
6.6 |
31 466 |
1.52 |
362 |
1.43 |
|
CORV |
Meagre |
Seabreams |
Rubberlip grunt |
51.5 |
7.2 |
6.0 |
21 501 |
1.04 |
344 |
1.35 |
|
PCH |
Grey triggerfish |
Red-banded seabream |
Soles |
49.9 |
13.6 |
5.5 |
16 725 |
0.81 |
317 |
1.25 |
|
LUB |
Seabass |
Rubberlip grunt |
Seabrams |
70.7 |
6.3 |
6.3 |
21 568 |
1.04 |
307 |
1.21 |
|
MER |
Horse mackerels |
European hake |
Common and Red pandora |
31.3 |
31.1 |
5.3 |
49 805 |
2.40 |
300 |
1.18 |
|
CH-M |
Cuttlefish |
Soles |
Octopus vulgaris |
92.7 |
3.6 |
0.6 |
15 918 |
0.77 |
295 |
1.16 |
|
PAR |
Pargo breams |
Common Seabream |
Red-banded-seabream |
64.7 |
8.2 |
3.7 |
29 446 |
1.42 |
279 |
1.10 |
|
LENG-M |
Soles |
Caramote prawn |
Cuttlefish |
96.7 |
0.7 |
0.5 |
8 093 |
0.39 |
274 |
1.08 |
|
ATUN-M |
Atlantic bluefin tuna |
Red sebream |
Atlantic pomfret |
98.8 |
1.1 |
0.1 |
65 364 |
3.15 |
270 |
1.06 |
|
PAJ |
Two-bandad seabream |
Seabreams |
Rubberlip grunt |
52.1 |
11.9 |
6.3 |
41 364 |
1.99 |
258 |
1.02 |
|
ACE |
Wedge sole |
European hake |
Caramote prawn |
66.0 |
12.9 |
8.7 |
24 574 |
1.18 |
237 |
0.93 |
|
RONC-BRE |
Bastard grunt |
Commond and Red pandora |
Rubberlip grunt |
410. |
16.7 |
9.7 |
23 935 |
1.115 |
237 |
0.93 |
|
VORZ |
Red seabream |
Atlantic pomfret |
Wreckfish |
54.3 |
40.5 |
4.4 |
17 540 |
0.85 |
234 |
0.92 |
|
SAM |
Common dentex |
Common Seabream |
Red banded seabream |
37.2 |
19.7 |
11.3 |
7 912 |
0.38 |
234 |
0.92 |
|
BRE-M |
Common and Red pandora |
Soles |
Rubberlip grunt |
93.6 |
1.2 |
0.7 |
20 516 |
0.99 |
228 |
0.90 |
|
CORV-M |
Meagre |
Rubberlip grunt |
Seabreams |
93.9 |
0.6 |
0.6 |
12 144 |
0.59 |
224 |
0.88 |
|
SALMT |
Surmullets |
Rubberlip grunt |
Common and Red pandora |
59.2 |
9.7 |
7.0 |
6 761 |
0.33 |
220 |
0.87 |
|
CEN |
Spinous spider crab |
Rubberlip grunt |
Soles |
51.9 |
11.6 |
7.6 |
10 779 |
0.52 |
219 |
0.86 |
|
MER-M |
European hake |
Common and Red pandora |
Caramote prawn |
91.2 |
1.9 |
1.7 |
11 761 |
0.57 |
218 |
0.86 |
|
BES |
Axillary Seabream |
Common and Red pandora |
Black seabream |
59.9 |
9.0 |
3.9 |
60 009 |
2.89 |
217 |
0.85 |
|
RAY |
Skates |
Rubberlip grunt |
Common Seabream |
45.0 |
6.1 |
5.7 |
11 306 |
0.55 |
193 |
0.76 |
|
FER |
Spurdog |
Rubberlip grunt |
European conger |
64.6 |
5.2 |
4.7 |
21 140 |
1.02 |
189 |
0.74 |
|
PUL2 |
Octopus vulgaris |
Cuttlefish |
Red banded seabream |
58.2 |
6.5 |
5.9 |
15 332 |
0.74 |
185 |
0.73 |
|
HER-M |
Striped seabream |
Common and Red pandora |
Meagre |
92.8 |
1.3 |
0.9 |
12 300 |
0.59 |
182 |
0.72 |
|
BRE-HER |
Common and Red pandora |
Striped seabream |
Horse mackerels |
52.4 |
20.7 |
11.1 |
23 888 |
1.15 |
178 |
0.70 |
|
PUL1 |
Octopus vulgaris |
Cuttlefish |
Striped seabream |
28.5 |
20.1 |
8.5 |
21 599 |
1.04 |
164 |
0.65 |
|
MOR |
Moray |
Common Seabream |
European conger |
45.1 |
9.4 |
6.6 |
6 575 |
0.32 |
153 |
0.60 |
|
LIZ |
G.,T. and L.grey mullet |
Seabreams |
Seabass |
73.7 |
5.0 |
3.5 |
7 621 |
0.37 |
151 |
0.59 |
|
CHP |
Black seabream |
Axillary Seabream |
Two-banded seabream |
44.8 |
14.7 |
14.1 |
36 182 |
1.74 |
126 |
0.50 |
|
ES-CAE |
Dogfish sharks |
Blue shark |
Pompano |
70.7 |
21.3 |
1.4 |
51 581 |
2.49 |
122 |
0.48 |
|
CHV |
Bluefish |
Meagre |
Common and Red pandora |
67.1 |
7.1 |
1.3 |
8 086 |
0.39 |
111 |
0.44 |
|
MERO |
Dusky grouper |
Common Seabream |
Seabreams |
38.4 |
7.5 |
6.4 |
7 032 |
0.34 |
81 |
0.32 |
|
PUL3 |
Octopus vulgaris |
Axillary Seabream |
Seabreams |
30.2 |
20.2 |
11.1 |
25 078 |
1.21 |
79 |
0.31 |
|
JAP |
Atlantic pomfret |
Red seabream |
Rockfish |
85.0 |
15.0 |
0.1 |
10 813 |
0.52 |
76 |
0.30 |
|
PLIM |
Greater amberjack |
Pargo breams |
Common Seabream |
48.7 |
22.1 |
4.8 |
4 639 |
0.22 |
69 |
0.27 |
|
ATUN |
Atlantic bluefin tuna |
Red sebream |
Atlantic pomfret |
76.1 |
20.4 |
1.9 |
3 804 |
0.18 |
19 |
0.07 |
|
Total |
|
|
|
|
|
|
207 4105 |
100 |
25 394 |
100 |
In terms of number of landings the LANG-M, BOR, URT-M, BIV, ACE-M, BOC, LANG and CH fishing trip types are the following ones in importance. The main target species of each of these fishing trip types and their relative importance in terms of % CPUE are respectively: caramote prawn (Maliceste kerathurus, 98.4 percent), rubberlip grunt (Plectorhinchus mediterraneus, 53.9 percent), red banded seabream (Pagrus auriga, 90.9 percent), the striped venus (Chamalea gallina, 97.4 percent), wedge sole (Dicologoglossa cuneata, 98.6 percent), common seabream (Pagrus pagrus, 49.5 percent) and the cuttlefish (Sepia officinalis, 54.9 percent). This order changes if the fishing trip types are sorted by landed weight. Thus, BIV fishing trip type passes to the second place staying the red seabream catches in the first place (VORZ-M). Furthermore, it is observed that most of the species studied are represented by some fishing trip type and, that in 85 percent of these trip types, one target species makes up more than 50 percent of the fishing trip type total CPUE.
A total of 219 vessels were selected to obtain the fleet components. Eleven fleet components were identified after the Cluster Analysis and later frequencies analyses of the resulting groups per port and month. Landing ports of the vessels that form each component are shown in Table 2, while the relative importance of the fishing trip types for each fleet component is shown in Table 3.
Table 2. Distribution by ports of the vessels that compose the eleven fleet components in number and percentages (F.C.= Fleet Component)
|
Landing Ports |
F.C.1 |
F.C.2 |
F.C.3 |
F.C.4 |
F.C.5 |
F.C.6 |
F.C.7 |
F.C.8 |
F.C.9 |
F.C.10 |
F.C.11 |
|||||||||||
|
n |
% |
n |
% |
n |
% |
n |
% |
n |
% |
n |
% |
n |
% |
n |
% |
n |
% |
n |
% |
n |
% |
|
|
Barbate |
1 |
1.6 |
9 |
12.9 |
0 |
0 |
0 |
0 |
5 |
100.0 |
0 |
0 |
0 |
0 |
0 |
0 |
0 |
0 |
1 |
10.0 |
0 |
0 |
|
Chipiona |
0 |
0 |
34 |
48.6 |
0 |
0 |
0 |
0 |
0 |
0 |
6 |
100.0 |
0 |
0 |
0 |
0 |
0 |
0 |
0 |
0 |
0 |
0 |
|
Conil |
60 |
96.8 |
20 |
28.6 |
0 |
0 |
0 |
0 |
0 |
0 |
0 |
0 |
1 |
100.0 |
1 |
100.0 |
0 |
0 |
0 |
0 |
0 |
0 |
|
Huelva |
0 |
0 |
0 |
0 |
0 |
0 |
0 |
0 |
0 |
0 |
0 |
0 |
0 |
0 |
0 |
0 |
0 |
0 |
0 |
0 |
0 |
0 |
|
Isla Cristina |
0 |
0 |
4 |
5.7 |
3 |
100.0 |
6 |
100.0 |
0 |
0 |
0 |
0 |
0 |
0 |
0 |
0 |
0 |
0 |
0 |
0 |
0 |
0 |
|
El Puerto de Stª Mª |
0 |
0 |
1 |
1.4 |
0 |
0 |
0 |
0 |
0 |
0 |
0 |
0 |
0 |
0 |
0 |
0 |
0 |
0 |
0 |
0 |
0 |
0 |
|
Punta Umbría |
1 |
1.6 |
0 |
0 |
0 |
0 |
0 |
0 |
0 |
0 |
0 |
0 |
0 |
0 |
0 |
0 |
0 |
0 |
9 |
90.0 |
0 |
0 |
|
Sanlúcar de Bda. |
0 |
0 |
2 |
2.9 |
0 |
0 |
0 |
0 |
0 |
0 |
0 |
0 |
0 |
0 |
0 |
0 |
3 |
100.0 |
0 |
0 |
0 |
0 |
|
Tarifa |
0 |
0 |
0 |
0 |
0 |
0 |
0 |
0 |
0 |
0 |
0 |
0 |
0 |
0 |
0 |
0 |
0 |
0 |
0 |
0 |
50 |
100.0 |
|
Total |
62 |
|
72 |
|
3 |
|
6 |
|
5 |
|
6 |
|
1 |
|
1 |
|
3 |
|
10 |
|
50 |
|
The 1997 fleet components were similar to those obtained for 1996. In order to test the fleet components of both years, a total of 140 vessels were selected which carried out 50 fishing trips in both years. The number of vessels that belonged to the same fleet component during the two years in the study are shown in Table 4. The degree of similarity between the two sets of results was estimated at between 88 percent and 100 percent.
Artisanal fisheries in the South Atlantic Spanish region, Gulf of Cádiz, as well as in the nearest areas of the Mediterranean are characterized by their multispecies nature, directionality and selectivity toward the resource (Camiñas et al., 1987; Camiñas, 1990). These characteristics are clearly reflected in the results obtained in this study. The high number of landed species and fishing trip types could reflect the fishery's multispecies nature and the maximum use of the catches (i.e. low discard rate). However, most of the fishing trip types (85 percent) show definite target species with mean CPUE greater than 50 percent, which indicates that effort is clearly directed in the fishery.
With regard to the fishing trip types observed, many of these are exclusive to certain ports, having a specialization toward the resource greatly influenced by the bottom features, which affect the distribution of the species. This is the case of the eastern area (Cádiz coast), where the rocky nature of the bottom favours the appearance of Sparids fishing trips. On the other hand, in the ports of the western area (Huelva coast) where the bottom consists of sand, mud and gravel, most fishing trips caught species such as prawns and wedge sole, among other (Ramos et al., 1995).
In the analysis of the fleet composition of the eleven fleet components by port (year 1996), we find that practically all, with the exception of F.C.2, belong to vessels from a single port. Within the same port, such as in the case of the ports of Conil and Isla Cristina, the determination of the fleet components is made based on the use of certain types of fishing gears during different seasons. As a consequence, an exploitation pattern based on the seasonal sequence of particular types of fishing trips could be defined.
Therefore, the directionality of the fishery and the use of the fishing gear targeting on different species at different seasons in many cases, and, moreover, influenced by certain environmental factors (hydrography), determines the different fleet components. The range of vessels that conform to a specific fleet component could vary greatly. In some cases, they comprise a great number of vessels and in other cases, they can comprise only one vessel with such a difference in activity as to justify a separate fleet component. The high selection criteria (i.e. only vessels with 50 or more landings per year) results in a certain consistency in those fleet components that are composed of a fewer number. The use the different gear types also affects the number of boats that conform each fleet component. For instance, longlines and handlines are used by a great number of boats (F.C:1: 60 and F.C.11: 50, respectively) from certain ports while clay pots and traps are used by a smaller number from the whole area (F.C.4: 6 and F.C.5: 5, respectively).
In this way, we find three fleet components in the port of Conil that are characterized by the use of diverse fishing gear. F.C.1 uses hook longline during the whole year, focusing on different target species depending on the season. F.C.7 used gillnets during the year directed principally towards the red mullet, and the F.C.10 is characterized by a seasonal combination of hook longlines and traps. Moreover, in these three cases, they all utilize hand jigs for common octopus during the season in which the resource is abundant. It was expected to have a fleet component exclusively dedicated to the octopus fishery with hand jigs, or alternating this fishing gear seasonally with others as a result of the sharp decrease of this species in the Gulf of Cadiz during 1996. This decrease was primarily a result of unfavourable environmental conditions, such as heavy rainfall (Silva et al., 1998).
In the case of Isla Cristina, two clear fleet components are distinguished by the fishing gear as well as by the target species. The F.C.4 is exclusively dedicated to the octopus fishery by means of clay pots and the F.C.3 used the gillnet throughout the year for fishing striped seabream, common and red pandora, bastard grunt and meagre.
Lastly, a heterogeneous component, F.C.2, appears in a number of ports. It is characterized by the use of gillnets and trammel nets, recording similar landings throughout the year.
Table 3. Relative importance (%) of the trip types in each fleet component (1996)
| |
Fleet Components |
||||||||||
|
Trip Type |
1 |
2 |
3 |
4 |
5 |
6 |
7 |
8 |
9 |
10 |
11 |
|
ACE |
0.0 |
1.7 |
0.0 |
0.0 |
0.0 |
2.2 |
0.0 |
0.0 |
4.8 |
0.0 |
0.0 |
|
ACE-M |
0.0 |
6.4 |
0.0 |
0.2 |
0.0 |
10.7 |
0.0 |
0.0 |
8.8 |
0.0 |
0.0 |
|
ATUN |
0.0 |
0.0 |
0.0 |
0.0 |
0.0 |
0.0 |
0.0 |
0.0 |
0.0 |
0.0 |
5.1 |
|
ATUN-M |
0.0 |
0.0 |
0.0 |
0.0 |
0.0 |
0.0 |
0.0 |
0.0 |
0.0 |
0.0 |
0.4 |
|
BES |
0.0 |
1.3 |
1.0 |
0.0 |
16.7 |
0.0 |
1.7 |
10.8 |
0.0 |
0.0 |
0.0 |
|
BIV |
0.0 |
0.1 |
0.0 |
0.0 |
0.0 |
0.0 |
0.0 |
0.0 |
0.0 |
100.0 |
0.0 |
|
BOC |
8.1 |
0.9 |
0.0 |
0.0 |
0.0 |
0.0 |
0.0 |
6.5 |
0.0 |
0.0 |
0.0 |
|
BOR |
5.7 |
7.5 |
3.0 |
0.0 |
1.1 |
2.1 |
12.8 |
0.5 |
0.0 |
0.0 |
0.0 |
|
BRE |
0.6 |
3.4 |
7.8 |
0.0 |
0.2 |
1.4 |
2.6 |
0.0 |
0.8 |
0.0 |
0.0 |
|
BREHER |
0.0 |
0.4 |
1.0 |
0.0 |
0.0 |
14.3 |
0.0 |
0.0 |
0.2 |
0.0 |
0.0 |
|
BRE-M |
0.1 |
1.8 |
0.8 |
0.0 |
0.0 |
4.7 |
0.0 |
0.0 |
0.0 |
0.0 |
0.0 |
|
CAZ |
3.8 |
1.3 |
0.0 |
0.0 |
0.0 |
0.2 |
1.7 |
11.8 |
0.0 |
0.0 |
0.0 |
|
CEN |
0.8 |
2.0 |
0.0 |
0.0 |
0.0 |
0.4 |
0.0 |
0.0 |
0.0 |
0.0 |
0.0 |
|
CH |
0.8 |
5.1 |
0.0 |
0.0 |
0.0 |
1.0 |
4.3 |
0.0 |
1.4 |
0.0 |
0.0 |
|
CH-M |
0.2 |
2.9 |
0.0 |
0.0 |
0.0 |
0.7 |
0.9 |
0.0 |
0.8 |
0.0 |
0.0 |
|
CHP |
0.0 |
0.2 |
0.0 |
0.0 |
24.7 |
0.0 |
0.0 |
0.0 |
0.0 |
0.0 |
0.0 |
|
CHV |
0.0 |
0.6 |
0.0 |
0.0 |
0.0 |
4.4 |
0.0 |
0.0 |
0.0 |
0.0 |
0.0 |
|
CONG |
5.2 |
0.8 |
2.0 |
0.2 |
0.0 |
0.1 |
0.0 |
1.6 |
0.0 |
0.0 |
0.0 |
|
CORV |
0.3 |
3.0 |
8.3 |
0.0 |
0.0 |
5.9 |
0.9 |
0.0 |
0.5 |
0.0 |
0.0 |
|
CORV-M |
0.1 |
1.7 |
1.0 |
0.0 |
0.0 |
7.4 |
0.0 |
0.0 |
0.0 |
0.0 |
0.0 |
|
DOR |
3.7 |
1.5 |
0.5 |
0.0 |
0.2 |
1.9 |
0.0 |
1.1 |
5.2 |
0.0 |
0.0 |
|
ES-CAE |
0.0 |
0.2 |
0.5 |
0.0 |
0.2 |
1.0 |
0.0 |
0.0 |
0.0 |
0.0 |
0.0 |
|
FER |
0.0 |
1.3 |
0.0 |
0.0 |
0.0 |
0.0 |
0.0 |
0.0 |
0.0 |
0.0 |
0.0 |
|
HER |
0.0 |
2.3 |
29.1 |
0.4 |
0.0 |
5.4 |
0.0 |
0.0 |
7.7 |
0.0 |
0.0 |
|
HER-M |
0.0 |
1.1 |
8.0 |
0.0 |
0.0 |
3.0 |
0.0 |
0.0 |
1.1 |
0.0 |
0.0 |
|
JAP |
0.0 |
0.0 |
0.0 |
0.0 |
0.0 |
0.0 |
0.0 |
0.0 |
0.0 |
0.0 |
1.6 |
|
LANG |
0.4 |
7.2 |
0.0 |
0.2 |
0.0 |
1.3 |
0.0 |
0.0 |
26.7 |
0.0 |
0.0 |
|
LANG-M |
0.0 |
17.3 |
0.0 |
0.2 |
0.0 |
3.4 |
0.0 |
0.0 |
5.2 |
0.0 |
0.0 |
|
LENG |
0.4 |
2.9 |
0.0 |
0.0 |
0.0 |
0.3 |
0.0 |
0.0 |
12.6 |
0.0 |
0.0 |
|
LENG-M |
0.2 |
2.4 |
0.0 |
0.0 |
0.0 |
0.1 |
0.0 |
0.0 |
5.0 |
0.0 |
0.0 |
|
LIZ |
0.0 |
1.3 |
0.0 |
0.0 |
0.0 |
2.8 |
0.0 |
0.0 |
1.9 |
0.0 |
0.0 |
|
LUB |
1.3 |
1.8 |
0.3 |
0.0 |
0.0 |
0.7 |
7.7 |
0.0 |
4.3 |
0.0 |
0.0 |
|
MER |
0.0 |
1.3 |
1.8 |
0.2 |
0.6 |
10.7 |
0.0 |
0.0 |
1.3 |
0.0 |
0.0 |
|
MER-M |
0.0 |
1.8 |
0.3 |
0.0 |
0.0 |
8.2 |
0.0 |
0.0 |
0.2 |
0.0 |
0.0 |
|
MERO |
0.4 |
0.2 |
0.0 |
0.0 |
1.3 |
0.0 |
0.0 |
7.5 |
0.0 |
0.0 |
0.0 |
|
MOR |
1.4 |
0.2 |
3.5 |
0.0 |
0.0 |
0.0 |
0.0 |
3.8 |
0.0 |
0.0 |
0.0 |
|
PAJ |
0.0 |
0.4 |
0.0 |
0.0 |
44.6 |
0.0 |
0.0 |
0.0 |
0.0 |
0.0 |
0.0 |
|
PAR |
2.4 |
1.0 |
0.5 |
0.0 |
0.2 |
0.4 |
0.0 |
1.6 |
0.0 |
0.0 |
0.0 |
|
PCH |
2.2 |
1.7 |
0.0 |
0.0 |
0.9 |
0.9 |
0.0 |
2.7 |
0.8 |
0.0 |
0.0 |
|
PLIM |
0.9 |
0.1 |
0.0 |
0.0 |
0.0 |
0.0 |
0.0 |
1.6 |
0.0 |
0.0 |
0.0 |
|
PUL1 |
0.0 |
1.2 |
0.3 |
0.0 |
0.2 |
0.0 |
2.6 |
0.0 |
0.1 |
0.0 |
0.0 |
|
PUL2 |
1.1 |
1.0 |
0.8 |
0.4 |
1.1 |
0.0 |
0.9 |
5.4 |
0.0 |
0.0 |
0.0 |
|
PUL3 |
0.0 |
0.4 |
0.0 |
0.0 |
3.7 |
0.0 |
0.0 |
17.2 |
0.0 |
0.0 |
0.0 |
|
PUL-M |
10.0 |
2.0 |
0.5 |
98.0 |
0.4 |
0.0 |
6.8 |
5.4 |
0.0 |
0.0 |
0.0 |
|
RAY |
0.9 |
1.1 |
0.0 |
0.0 |
0.0 |
1.3 |
0.0 |
1.1 |
0.0 |
0.0 |
0.0 |
|
RONC-BRE |
0.2 |
1.3 |
27.4 |
0.0 |
0.0 |
0.0 |
2.6 |
0.0 |
0.0 |
0.0 |
0.0 |
|
SALMT |
0.7 |
1.1 |
0.0 |
0.0 |
0.0 |
0.0 |
54.7 |
0.0 |
0.7 |
0.0 |
0.0 |
|
SAM |
3.0 |
0.1 |
0.0 |
0.0 |
0.0 |
0.0 |
0.0 |
1.1 |
0.0 |
0.0 |
0.0 |
|
SARG |
0.9 |
3.6 |
1.3 |
0.0 |
3.9 |
2.9 |
0.0 |
17.2 |
9.3 |
0.0 |
0.0 |
|
URT |
31.2 |
0.8 |
0.0 |
0.0 |
0.0 |
0.0 |
0.0 |
2.7 |
0.1 |
0.0 |
0.0 |
|
URT-M |
13.1 |
0.3 |
0.0 |
0.0 |
0.0 |
0.0 |
0.0 |
0.5 |
0.5 |
0.0 |
0.0 |
|
VORZ |
0.0 |
0.0 |
0.0 |
0.0 |
0.0 |
0.0 |
0.0 |
0.0 |
0.0 |
0.0 |
5.0 |
|
VORZ-M |
0.0 |
0.0 |
0.0 |
0.0 |
0.0 |
0.0 |
0.0 |
0.0 |
0.0 |
0.0 |
88.0 |
Table 4. Number of vessels belonging to the same fleet component for the years 1996 and 1997 expressed in percentage with respect to the components of 1996
| |
F.C. 1997 |
||||||||||
|
F.C. 1996 |
1 |
2 |
3 |
4 |
5 |
6 |
7 |
8 |
9 |
10 |
11 |
|
1 |
95.2 |
4.7 |
0 |
0 |
0 |
0 |
0 |
100 |
0 |
0 |
0 |
|
2 |
4.8 |
88.4 |
0 |
50 |
0 |
0 |
0 |
0 |
0 |
0 |
0 |
|
3 |
0 |
0 |
100 |
0 |
0 |
0 |
0 |
0 |
0 |
0 |
0 |
|
4 |
0 |
0 |
0 |
50 |
0 |
0 |
0 |
0 |
0 |
0 |
0 |
|
5 |
0 |
0 |
0 |
0 |
100 |
0 |
0 |
0 |
0 |
0 |
0 |
|
6 |
0 |
0 |
0 |
0 |
0 |
100 |
0 |
0 |
0 |
0 |
0 |
|
7 |
0 |
0 |
0 |
0 |
0 |
0 |
100 |
0 |
0 |
0 |
0 |
|
8 |
0 |
2.3 |
0 |
0 |
0 |
0 |
0 |
0 |
0 |
0 |
0 |
|
9 |
0 |
4.7 |
0 |
0 |
0 |
0 |
0 |
0 |
100 |
0 |
0 |
|
10 |
0 |
0 |
0 |
0 |
0 |
0 |
0 |
0 |
0 |
100 |
0 |
|
11 |
0 |
0 |
0 |
0 |
0 |
0 |
0 |
0 |
0 |
0 |
100 |
|
total (%) |
100 |
100 |
100 |
100 |
100 |
100 |
100 |
100 |
100 |
100 |
100 |
From the fleet components comparison of both years, based on the vessels which carried out more than 50 fishing trips per each year, it can be seen that vessels which belonged to a fleet component determined in 1996 continued to belong to the same fleet component in 1997 in a high percentage (Table 4). This indicates that most of these vessels carry out the same exploitation pattern over the whole period examined, strengthening the defined fleet components. As for those vessels that change their exploitation pattern and consequently are included in different fleet component in 1997, it is observed that these new components are similar in terms of gear type and landing port.
Therefore, this work suggests a high relationship among the fleet components, landing ports and the fishing gears with a slightly marked seasonality in function of each component target trip types. These results will be taken into account on the design of an efficient and simple sampling scheme for the artisanal fishery collection of data (biological, economic and social) under comprising the "fleet component" concept. The fleet components analysis can be used as a useful tool for sampling design in artisanal fisheries from the basis of monitoring certain vessels which belong to the estimated fleet components. Sampling could embrace biological and fishery aspects (i.e. catches, effort) and socio-economic fishery aspects (i.e. first sale prizes, staff involved, etc.). In addition, it provides an important benefit in terms of a lower effort requirement for carrying out the artisanal fishery study.
Anonymous 1994. Las artes de pesca en el litoral gaditano. Diputación Provincial de Cádiz.
Camiñas, J.A. 1990. Pesquerías artesanales mediterráneas. El caso andaluz. Revista de Estudios Agrosociales. MAPA nº 155 (Enero-Marzo): pp. 83-117.
Camiñas, J.A. 1996. Estudios de las pesquerías y flotas artesanales. Metodología y principales problemas encontrados. In: Lliñas, O., Gonzalez, J.A. and Rueda, M.J. (Eds). Oceanografía y Recursos. Marinos en el Atlántico Centro.-Oriental: pp. 424-438.
Camiñas, J.A., Baro J. & Reina, J.A. 1987. Pesquerías artesanales del mar de Alborán. Informe final. Proyecto cooperativo IEO/CEE XIV-B-1 86/XII/3857, 236 pp.
Charbonnier, D. & Caddy, J.F. 1986. Rapport de la Consultation du Conseil général des pêches pour la Méditerrannée occidentale sur les méthodes d'évaluation de la pêche aux petits métiers dans la Méditerranée occidentale. Sète, France, 13-16 mai 1986. FAO Fisheries Report No. 362. Rome, FAO.
Norusis, M.J. 1997. SPSS Base 7.5 for Windows User´s Guide. Chicago: SPSS Inc.
Ramos, F., Sobrino, I. & Jiménez, M.P. 1995. Cartografía temática de caladeros de la flota de arrastre en el Golfo de Cádiz. Junta de Andalucía: Informaciones Técnicas, pp. 45-96.
Silva, L., Sobrino, I. & Ramos, F. 1998. Fishing exploitation pattern of the common octopus, Octopus vulgaris Cuvier, 1797, in the Spanish waters of the Gulf of Cádiz. Report of the Working Group on Cephalopod Fisheries and Life History. ICES CM 1998/G: pp. 39-45
Sobrino, I., Jiménez, M.P., Ramos F. & Baro, J. 1994. Descripción de las pesquerías demersales de la región suratlántica española. Inf. Téc. Inst. Esp. Oceanogr. 151 pp.
Visauta, B. 1998. Análisis estadístico con SPSS para Windows. Vol. II: Estadística multivariante. Madrid: McGraw-Hill/Interamericana de España.
| [150] Instituto Español
de Oceanografía, Unidad de Cádiz, Apdo. 2609, 11006 Cádiz,
Spain. E-mail: [email protected].
A revised version of the paper has subsequently been published as Silva,
L., Gil, J. and Sobrino, I (2002) Definition of fleet components in the
Spanish artisanal fishery of the Gulf of Cádiz (SW Spain ICES division
IXa), Fisheries Research, 59(1-2), 117-128. |
![]()
![]()
![]()