Abstract: Fishing capacity comprises four components: (i) the number of fishing vessels, (ii) the size of each vessel, (iii) the technical efficiency of vessel operation, and (iv) the time spent fishing. Fishing power, which comprises segments (ii) and (iii), is generally not directly measurable. Both fish stock assessment and management would benefit from a better understanding of the temporal development of fishing power. Firstly, a deeper insight into the relationship between catch-per-unit-effort (CPUE) and stock abundance would enhance the accuracy of stock assessments. Secondly, refining the relationship between fishing mortality and nominal fishing effort would provide a basis to allow direct control of the fishing pressure exerted by fleets on stocks. The temporal dynamics in fishing power, however, are difficult to distinguish from stock fluctuations. The purpose of this paper is to investigate and identify such dynamics. Three independent indicators, derived using different methods are proposed. The first is an indicator of variation in catchability, derived from the relationship between fishing mortality and fishing effort. The second and the third are indicators describing variations in fishing power, based on the CPUE of a fleet of vessels, relative to the CPUE of a reference sub-fleet. The reference sub-fleet is characterized by low variation in fishing power and comprises either a set of reference vessels belonging to the fleet under examination (indicator 2) or a research vessel survey (indicator 3). The methods are illustrated using data collected from the English demersal fisheries operating in the North Sea for the time period from 1989 to 1998.
The measurement and assessment of fishing capacity in fisheries with highly fluctuating stocks is by no means trivial. Fishing capacity comprises four components: (i) the number of fishing vessels, (ii) the size of each vessel, (iii) the technical efficiency of vessel operation, and (iv) the time spent fishing. Fishing power, which relates to components (ii) and (iii), is generally not directly measurable. Both fish stock assessment and management would, however, benefit from a better understanding of the development of fishing power over time.
In this paper, relationships will be developed between fishing effort and fishing mortality for a number of the main demersal fishing fleets operating in the North Sea. The results from preliminary analyses of (E&W) vessels are presented and discussed.
This paper uses United Kingdom (E&W) data for the North Sea. Commercial vessel trip data on six species (cod, haddock, plaice, saithe, sole and whiting) were extracted for the years 1989-1998. Values were obtained for a number of variables including days at sea, area fished, effort, gear, vessel horse-power (hp), port of landing, weight of species (cod, haddock, plaice, saithe, sole and whiting) catch, value of catch, month and year. Eight fleets were identified from the vessel trip data - beam trawl, bottom pair trawl, fixed nets, longliners, nephrops and prawn gears, otter gears, seiners, and other gears.
For the purpose of this paper, the North Sea is sub-divided into five regions identifying distinct fishing areas. The definition of the five regions is arbitrary but merely serves a didactic purpose. A number of stocks and fleet segments that operate in the North Sea will be considered within these regions, providing that sufficient data exist for meaningful computations to be performed. The areas considered are:
region 1 denoting the northern part of the plaice box above latitude 55°;
region 2 denoting the southern part of the plaice box below latitude 55°;
region 3 denoting the Belgium and Dutch coastline;
region 4 denoting the northern part of the North Sea above latitude 55° but excluding the plaice box; and
region 5 denoting the southern part of the North Sea below latitude 55° but excluding the plaice box.
The plaice box, a protected area in the south-eastern North sea was established in 1989 (Council Regulation EEC No.4193/88) to reduce discarding of undersized plaice in the main nursery areas, and thereby enhance the recruitment to the fishery. Initially, in the plaice box, beam-trawlers larger than 300 hp were excluded during the second and third quarters of the year, but in 1994 the regulation was extended to the fourth quarter. Since 1995 the plaice box has been closed throughout the whole year (Pastoors et al., 1998). The effects of the protected area have previously been evaluated using a simulation model (Anon., 1987, 1994; Rijnsdorp and van Beek, 1991).
The temporal dynamics in fishing power are difficult to distinguish from stock fluctuations and it is the purpose of this paper to investigate two methods that might assist in the identification of the (temporal) development of fishing power. The methods are illustrated using data collected from the English demersal fisheries operating in the North Sea for the time period from 1989 to 1998.
The first method is based upon an indicator of variation in catchability, derived from the relationship between total fishing mortality and fishing effort. Estimates of the total fishing mortality may be derived from the retrospective analysis that is performed by the relevant ICES Stock Assessment Working Group.
The retrospective analysis of total fishing mortality is a graphical representation of the historical time series of fishing mortality, which have been calculated in different years of assessment - one time series is represented for each year of assessment. Often, these time series follow the same trajectory for the oldest assessment years, and then diverge for the most recent assessment years. When the trajectories are merged, it may reasonably be assumed that the estimates of total fishing mortality are robust. Such estimates may gain in reliability and may hence be used to derive partial fishing mortality and log-catchability. Formulae are presented below.
The partial fishing mortality
 of fleet f and
species s, in year y, month m and area a, averaged
over appropriate age classes, may be related to total fishing mortality
 in year y, total catch
C(y, s) in year y, and partial catch C(y, m, a, f, s), by
the equation:
|
|
(1) |
where Y1(s) and Yn(s)
denote the first and the last year, respectively, where converging estimates of
 are available from the ICES
retrospective analysis for each species.
The values of annual total fishing mortality, as estimated by Extended Survivors Analysis, XSA (Darby and Flatman, 1994), and the annual total catch are taken from Anon. (1999). XSA is the de facto method used for the analysis of commercial catch-at-age data within the ICES area. It is an implementation of sequential population analysis (Doubleday, 1981) that relies upon either cohort analysis or virtual population analysis, VPA, to re-create a stock's historical population structure from the catch-at-age matrix. The VPA estimates of numbers-at-age are conditional upon the time series of values of the natural mortality and the population numbers alive at the oldest age in each cohort - the survivors. XSA is an iterative method of estimating the survivors using the relationship between catch-per-unit-effort, CPUE, and the VPA estimates of population abundance-at-age; the "N"s. The algorithm is initiated with an initial value of the number of survivors. Fleet catchabilities-at-age are estimated using the estimates of N and the indices of CPUE. Predictions of N by fleet, by age and by year are then made for each observed value of CPUE. The predicted values are projected forward to the final age in each cohort using the estimated fishing mortalities and the assumed natural mortalities. A weighted average of the survivors provides new estimates of the terminal N and the XSA algorithm iterates until successive estimates of the fishing mortality converge.
The partial log-catchability time series LQ(y, m, a, f, s) may then be derived from the equation:
|
|
(2) |
where E denotes fishing effort measured in the number of days fishing (or hp*number of days fishing).
The second method is dependent upon indicators of variations in fishing power, based on the CPUE of a fleet of vessels, relative to the CPUE of a reference sub-fleet. The reference sub-fleet is characterized by low variation in fishing power and comprises either a set of reference vessels belonging to the fleet under examination (indicator 2) or a research vessel survey (indicator 3), if available. The reference vessels are not chosen with respect to their efficiency performances but with regards to their stability over time. Assuming that a set of steady vessels can be identified then the variations over time of catchability and relative technical efficiency should be consistent. The presence of any identifiable systematic pattern within the index is then tested statistically. The index of technical efficiency (or index of fishing power, IFP) is defined, for the present, as the difference between the log-CPUE of a fleet and the log-CPUE of its related reference sub-fleet.
Results are presented for each of the five regions and eight fleets previously defined but the analyses are restricted to six species (cod, haddock, plaice, saithe, sole and whiting) which are commercially fished in the North Sea by the United Kingdom (E&W) fleets.
The assignment of specific year ranges [Y1(s), Yn(s)] to each of the six species (cod, haddock, plaice, saithe, sole and whiting) requires a subjective judgment. In this paper, the years identified for analysis are merely given for illustration and shown in Table 1.
Table 1. Species/year ranges chosen for North Sea stocks
|
Species |
Y1(s) |
Yn(s) |
|
Cod |
1989 |
1993 |
|
Haddock |
1989 |
1989 |
|
Plaice |
1989 |
1997 |
|
Saithe |
1989 |
1995 |
|
Sole |
1989 |
1993 |
|
Whiting |
1989 |
1993 |
In principle, the species and year combinations given in Table 1 may be applied to the United Kingdom (E&W) commercial fishery data for the North Sea. Unfortunately, not all species/area/fleet/year/month combinations have sufficient data to permit formal data analysis. Hence, it was further necessary to restrict attention to the year ranges shown in Table 2.
Table 2. Species/area/fleet/year combinations chosen to illustrate Method 1.
|
Gear |
Area |
Cod |
Haddock |
Plaice |
Saithe |
Sole |
Whiting |
|
Beam trawl |
1 |
1990 - 93 |
1989a |
1990 - 97 |
1992 - 93 |
1990 - 93 |
1990 - 93 |
| |
2 |
|
|
1989 - 97 |
|
|
|
| |
3 |
|
|
1989 - 97 |
|
|
|
| |
4 |
|
|
1989 - 97 |
|
|
|
| |
5 |
|
|
1989 - 97 |
|
|
|
|
Bottom pair trawl |
2 |
|
|
1989 - 92 |
|
|
|
| |
4 |
|
|
1989 - 97 |
|
|
|
| |
5 |
|
|
1989 - 97 |
|
|
|
|
Fixed nets |
1 |
|
|
1991 - 94 |
|
|
|
| |
2 |
|
|
1990 - 97 |
|
|
|
| |
3 |
|
|
1989 - 97 |
|
|
|
| |
4 |
|
|
1990 - 97 |
|
|
|
| |
5 |
|
|
1989 - 97 |
|
|
|
|
Longliners |
4 |
|
|
1991 - 97 |
|
|
|
| |
5 |
|
|
1989 - 97 |
|
|
|
|
Nephrops and prawn gears |
4 |
|
|
1994 - 97 |
|
|
|
| |
5 |
|
|
1994 - 97 |
|
|
|
|
Other gears |
5 |
|
|
1989 - 97 |
|
|
|
|
Otter trawl |
2 |
|
|
1989 - 97 |
|
|
|
| |
3 |
|
|
1989 - 97 |
|
|
|
| |
4 |
|
|
1989 - 97 |
|
|
|
| |
5 |
|
|
1989 -97 |
|
|
|
|
Seiners |
2 |
|
|
1989 - 97 |
|
|
|
| |
4 |
|
|
1989 - 97 |
|
|
|
| |
5 |
|
|
1989 - 97 |
|
|
|
a. no data for United Kingdom E&W.
Estimates of partial fishing mortality and partial log-catchability were calculated as described earlier in the Material and Methods section. The tabulation and presentation of numerical estimates is neither useful nor meaningful. Instead, graphical displays were produced and assessed for evidence of a linear trend over time (i.e. month/year) in partial fishing mortality and partial log-catchability. The results are summarized in Table 3.
Table 3. Linear trend over time for selected species/area/fleet combinations
|
Species |
Area |
Fleet |
linear trend over time |
|
|
partial fishing mortality |
partial log-catchability |
|||
|
Cod |
1 |
beam trawl |
increasing |
increasing |
|
Haddock |
1 |
beam trawl |
constant |
constant |
|
Plaice |
1 |
beam trawl |
constant |
constant |
| |
|
fixed nets |
constant |
constant |
| |
2 |
beam trawl |
constant |
constant |
| |
|
bottom pair trawl |
decreasing |
decreasing |
| |
|
fixed nets |
constant |
decreasing |
| |
|
otter trawl |
decreasing |
constant |
| |
|
seiners |
decreasing |
constant |
| |
3 |
beam trawl |
constant |
constant |
| |
|
fixed nets |
decreasing |
decreasing |
| |
|
otter trawl |
constant |
constant |
| |
4 |
beam trawl |
constant |
decreasing |
| |
|
bottom pair trawl |
constant |
constant |
| |
|
fixed nets |
constant |
decreasing |
| |
|
longliners |
decreasing |
decreasing |
| |
|
nephrops and prawn gears |
decreasing |
constant |
| |
|
otter trawl |
decreasing |
decreasing |
| |
|
seiners |
decreasing |
constant |
| |
5 |
beam trawl |
constant |
constant |
| |
|
bottom pair trawl |
decreasing |
decreasing |
| |
|
fixed nets |
constant |
decreasing |
| |
|
longliners |
constant |
constant |
| |
|
nephrops and prawn gears |
decreasing |
increasing |
| |
|
other gears |
constant |
constant |
| |
|
otter trawl |
decreasing |
decreasing |
| |
|
seiners |
decreasing |
constant |
|
Saithe |
1 |
beam trawl |
insufficient data to comment |
insufficient data to comment |
|
Sole |
1 |
beam trawl |
constant |
constant |
|
Whiting |
1 |
beam trawl |
increasing |
increasing |
The basic statistics of CPUE, ln-CPUE, mean (ln-CPUE), variance (ln-CPUE) and the first-order auto-correlation of ln-CPUE were calculated for all species/area/fleet combinations. The selection of the number of observations (N) and the time series to which to apply Method 2 were then based upon visual inspection of a number of plots. The graphs of variance (ln-CPUE) versus N and the first-order auto-correlation of ln-CPUE versus N were used to aid in the choice of the minimum number of observations required to ensure that the variance (ln-CPUE) and the first-order auto-correlation of ln-CPUE are both independent of N. For the English vessels operating in the North Sea, the threshold was chosen as 100 observations.
Graphs of variance (ln-CPUE) versus mean (ln-CPUE) and the first-order auto-correlation of ln-CPUE versus mean (ln-CPUE) were then used to determine whether variance (ln-CPUE) and the first-order auto-correlation of ln-CPUE are correlated with the mean (ln-CPUE). These plots were used to select a set of fleets and areas for each species such that variance (ln-CPUE) and the first-order auto-correlation of ln-CPUE are not correlated with the mean (ln-CPUE). For the English vessels operating in the North Sea, only beam trawls fishing in area 4 were retained for further analysis.
The selection of a reference sub-fleet from the V vessels operating in the North Sea proceeded along the following lines. Firstly, a selection of fishing vessels with minimum variance (ln-CPUE) amongst the pool of V vessels was made. The V fishing vessels were then sorted by decreasing variance (ln-CPUE) and only the V/4 vessels with lowest variance (ln-CPUE) were retained for further investigation. The proportion of vessels retained is arbitrary but once again, serves a didactic purpose. Secondly, a selection consisting of choosing fishing vessels with minimum first-order auto-correlation of ln-CPUE amongst the pool of V/4 vessels initially selected was made. The V/4 fishing vessels were sorted by decreasing values of the first-order auto-correlation of ln-CPUE, and only the R = V/16 vessels with lowest first-order auto-correlation of ln-CPUE were retained for further investigation. The time series of ln-CPUE corresponding to the R reference vessels are collectively referred to as the reference sub-fleet.
All vessels not chosen to be included in the reference sub-fleet then comprise the remaining whole fleet. The index of technical efficiency as defined previously in the Material and Methods section was calculated for each of the six species and the results are displayed in the Figures 1-6 for North Sea cod, haddock, plaice, saithe, sole and whiting, respectively.
The Figures 1 through to 6 will be commented upon in the Discussion.
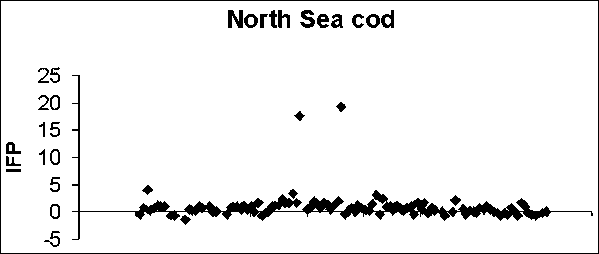
Figure 1. Index of technical efficiency for the beam trawl fleet fishing in area 4 for cod.
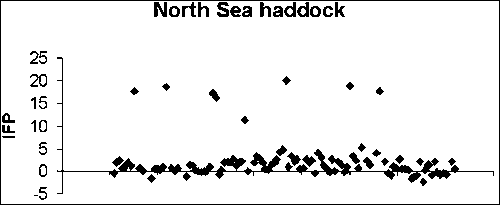
Figure 2. Index of technical efficiency for the beam trawl fleet fishing in area 4 for haddock.
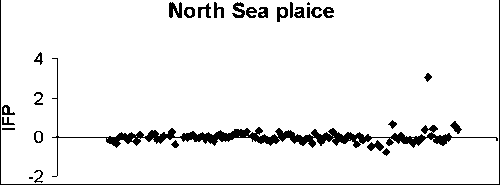
Figure 3. Index of technical efficiency for the beam trawl fleet fishing in area 4 for plaice.
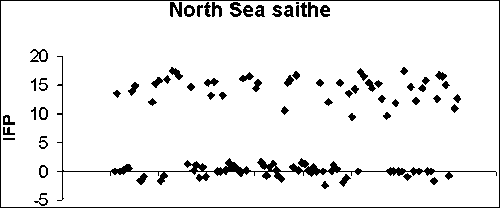
Figure 4. Index of technical efficiency for the beam trawl fleet fishing in area 4 for saithe.
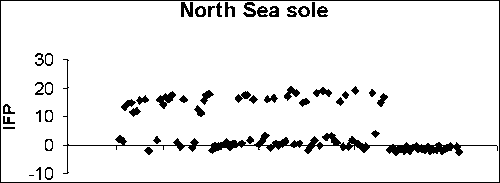
Figure 5. Index of technical efficiency for the beam trawl fleet fishing in area 4 for sole.
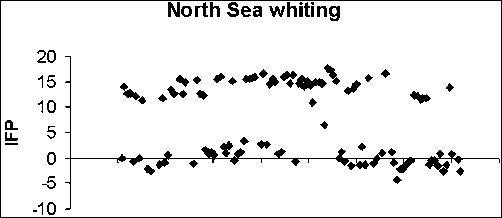
Figure 6. Index of technical efficiency for the beam trawl fleet fishing in area 4 for whiting.
The use of technical measures such as closed areas and seasons has become an increasingly important management tactic within the ICES area. Catch databases disaggregated by species, quarter, fleet and ICES statistical rectangle have been used in attempts to assess the effects of technical conservation methods. National data collection programmes have not, however, been generally designed to provide catch-at-age data at such a fine-grained level.
Refining the relationship between fishing mortality and nominal fishing effort would provide a basis to allow direct control of the fishing pressure exerted by fleets on stocks. The temporal dynamics in fishing power, however, are difficult to distinguish from stock fluctuations. The purpose of this paper has been to investigate and identify such dynamics.
Three independent indicators, derived using different methods have been proposed. The first is an indicator of variation in catchability, derived from the relationship between fishing mortality and fishing effort. The second and the third are indicators describing variations in fishing power, based on the CPUE of a fleet of vessels, relative to the CPUE of a reference sub-fleet. The reference sub-fleet is characterized by low variation in fishing power and comprises either a set of reference vessels belonging to the fleet under examination (indicator 2) or a research vessel survey (indicator 3), if available. The methods have been illustrated using data collected from the English demersal fisheries operating in the North Sea for the time period from 1989 to 1998.
The index of technical efficiency, as calculated, exhibits a number of features. Within area 4, the beam trawl fleet appears to have a relatively constant index of fishing power with respect to cod, haddock and plaice. The numerical values fluctuate about a value of zero and hence, do not appear to indicate a real difference between the reference sub-fleet and the whole fleet. The picture for saithe, sole and whiting is more intriguing with the index appearing to separate into two distinct groups - with values fluctuating about a value of zero and also about a non-zero value which appear to be approximately independent of time. One can of course speculate as to the possible causes of these differences but a more detailed investigation might reveal a likely source of the difference.
Eight fleets have been identified from the vessel trip data on the basis of their gear; namely, beam trawl, bottom pair trawl, fixed nets, longliners, nephrops and prawn gears, otter gears, seiners, and other gears. Future analyses might consider re-defining fleets in terms of specific combinations of gear/hp/mesh size. Of course, at the national level, the fleet definitions must be appropriate for the fisheries of the United Kingdom
Finally, this paper has been concerned neither with the derivation of a model for catchability-at-age nor the prediction of catchability-at-age. However, the United Kingdom (E&W) vessel trip data discussed can be used to investigate the relationship between catchability and its variance and then to assess the performance of various predictive models for catchability based on variables and factors which are controllable by management actions (Anon., 1995; O'Brien, 1995; O'Brien et al., 1995). Such an approach might be used for any species and fleets but is outside the scope of the present paper.
Anon. 1987. Report of the ad hoc Meeting of the North Sea Flatfish Working Group. ICES CM 1987/Assess: pp. 14.
Anon. 1994. Report of the Study Group on the North Sea Plaice Box. ICES CM 1994/Assess: pp. 14.
Anon. 1995. Report of the Working Group on Long-Term Management Measures. ICES CM 1995/Assess: pp. 15.
Anon. 1999. Report of the Working Group on the Assessment of Demersal Stocks in the North Sea and Skagerrak. ICES CM 1999/ACFM: 8.
Darby, C.D. & Flatman, S. 1994. Virtual Population Analysis: Version 3.1 (Windows/DOS) User Guide. Information Technology Series, MAFF Directorate of Fisheries Research, Lowestoft, (1): 85 pp.
Doubleday, W.G. 1981. A method for estimating the abundance of survivors of an exploited fish population using commercial catch-at-age and research vessel abundance indices. Can. Spec. Pub. Fish. Aquat. Sci., 58:164-178.
O'Brien, C.M. 1995. Modelling and predicting catchability-at-age using vessel trip data on North Sea plaice for the years 1983-1992. WD13 presented to ICES Long-Term Management Measures Working Group (ICES CM 1995/Assess:15).
O'Brien, C.M., Kell, L.T., Rackham, B.D. & Stokes, T.K. 1995. The feasibility of modelling and predicting catchability-at-age using vessel trip data on North Sea cod for the years 1983-1992. WD5 presented to ICES Long-Term Management Measures Working Group (ICES CM 1995/Assess: 15).
Pastoors, M.A., Rijnsdorp, A.D. & van Beek, F.A. 1998. Evaluation of the effects of a closed area in the North Sea ('Plaice Box') on the stock development of plaice (Pleuronectes platessa). ICES CM 1998/U: 2.
Rijnsdorp, A.D. & van Beek, F.A. 1991. The effects of the plaice box on the reduction in discarding and on the level of recruitment of North sea sole. ICES CM 1991/G: 4.
|
[152] CEFAS Lowestoft
Labouratory, Pakefield Road, Lowestoft, Suffolk NR33 0HT, United Kingdom. The
preparation of this paper was funded by the Commission of the European
Communities Directorate General for Fisheries (DG XIV) under project contract
98/027 (On the applicability of economic indicators to improve the
understanding of the relationship between fishing effort and mortality -
examples from the flat- and round-fish fisheries of the North Sea). ©
1999 Crown Copyright (reproduced with permission). |