![]()
![]()
![]()
Abstract: We define here the meaning of fishing capacity as the upper limit of fishing effort (e.g. boats*trips) for a given fleet (e.g. the number of vessels). Ideally speaking, the best measure to reduce fishing effort seems to be to reduce fishing capacity itself when fishing effort exceeds the optimal level which can be estimated from biological reference points. But when the possibility exists that the stock fluctuates widely or an uncertainty in the optimal effort level exists, it seems inevitable that a certain level of surplus in fishing capacity will be required as a buffer. If the fishing capacity was reduced to the calculated average 'optimal' fishing effort level, no potential fishing effort to utilize stocks that exceeds the 'optimal' level remains. In year when the stock is less than the optimal level, the buffer fishing effort should be removed by closure of the fishery after the quota for the year has been achieved. Using a simple stock dynamics model, it is suggested that the optimal fishing capacity to achieve the maximum yield and maximum revenue through a long-term period is about a half and a quarter of the maximum fishing capacity corresponding to bionomic equilibrium level in a high stock abundance period, respectively.
Pelagic fishes such as the Japanese sardine Sardinops melanostictus, and chub mackerel Scomber japonicus fluctuate widely in their abundance with over decadal scale. While fishing capacity of purse seine vessels increases in response to a high stock abundance, an excess of fishing capacity can arise as the stock abundance begin to decline. In Japan, fisheries management based on the total allowable catch (TAC) started in 1997 for these major pelagic species. Some problems have been pointed out for the output control system using TAC, i.e. a reliability to the stock assessment, costs to update accumulated catch of the year, under report by fishermen, discards for high grading. For the chub mackerel stock around Japan, recruitment overexploitation by purse seine fishery, i.e. heavy fishing pressure for yearling and 1 year-old fish, is also pointed out and it may cause a delay of stock recovery (Wada et al., 1996; Kishida, 1998) under a TAC control system. An excess of fishing capacity lies behind these problems. Therefore, FAO advocates the reducing of fishing capacity before the application of any output control system in fisheries management.
In this paper, we developed a simple simulation model describing the stock dynamics of pelagic fishes fluctuating under natural and fishing conditions, and discussed the relationship between reference points for these stocks and proper size of fishing capacity.
Assuming a Schaefer growth model (Schaefer, 1954), a convex parabolic relationship exists between fishing mortality (or fishing effort) and catch. If the price of fish can be assumed to be constant regardless of quantity of catch, the yield curve directly corresponds to the revenue curve for the industry. This revenue curve can be regarded as a production function for use in economic models.
An assumption underlying the basic Schaefer model is that growth is affected only by the level of fishing effort, and is not susceptible to substantial environmental fluctuations. For Japanese sardine and chub mackerel, whose stock fluctuates widely with long-term cycles, several production functions can be specified to represent high stock level period and low stock abundance period as well as the standard 'average' stock conditions.
For the purposes of the analysis, the target reference point is MSY using fishing mortality F (or fishing effort X). Periods of low and high stock abundance are denoted as FMSY(low)[XMSY(low)] and FMSY(high)[XMSY(high)] respectively.
Here, fishing capacity FC is defined as the upper limit of fishing effort which can be used within a certain unit time. For example, if there are ten vessels available and each vessel can operate 50 trips per year at most, then we define FC = 500 (boat*trips). If the actual mean number of trips by these vessels was 30 in a year, then fishing effort in this year was 300 (boat*trips). Therefore, both fishing capacity and fishing effort are treated with the same unit.
Economic models take costs into consideration. Here, costs are assumed to be given by:
|
Cost = a + bX |
(1) |
where a is fixed costs, and bX are variable costs which depend on the level of fishing effort, X. We consider fixed costs á as maintenance costs per vessel per year such as depreciation amount and fixed wages. For free access fishery, which is assumed in this model, fishing effort tends to increase to the bionomic equilibrium point Xeq where revenue corresponds to costs (Gordon, 1954), such that no economic profits exist in the fishery. Therefore, the maximum fishing capacity that is commercially attainable [Max (FC)] is Xeq (high), although this obviously corresponds to over-investment, and losses will occur when the stock is less than the present high level. On the other hand, if fishing capacity is less than XMSY(low), the effective use of the fish stock cannot be achieved due to the low exploitation rate during other than low stock level periods. From the long-term point of view, the proper level of fishing capacity seems to exist between the range:
|
XMSY(low) < FC < XMSY(high) < X (high) |
(2) |
Since it seems reasonable to hold excess fishing capacity in low stock level period as a buffer for high stock level period, we examine how much fishing capacity is appropriate to hold.
We assume that the stock dynamics follow the Schaefer model, and carrying capacity K and intrinsic growth rate r to be a function of time K(t) and r(t), respectively, i.e.:
|
dN/dt = r(t)N(K(t) - N)/K(t) - FN |
(3) |
where N and F denotes the stock size in number and fishing mortality, respectively. At the equilibrium condition (dN/dt = 0), Catch = FN, equation (3) can be transformed as follows;
|
Catch = K (t) F(r (t) F)/r(t) |
(4) |
Assuming constant price p, revenue Y can be given by:
|
Y = pK(t)F(r(t) F)/r(t) |
(5) |
and profits, Prof, is expressed by subtracting cost Cost from Y, i.e.:
|
Prof = pK(t)F(r(t) - F)/r(t) - a - bX |
(6) |
which can also be expressed as:
|
Prof = K(t)F(r(t) - F)/r(t) - a - bF/q |
(7) |
In equation (7), the parameters of economic costs a and b are expressed as relative values divided by fish price.
The optimal size of fishing capacity for the fluctuating stock is estimated as the fishing mortality F (or effort X) which maximize the cumulative yield or revenue under long-term fluctuation of K(t) or r(t).
Stock fluctuations of sardine, chub mackerel and saury Cololabis saira in Pacific Ocean around Japan are shown in Figure 1. Bi-decadal scale fluctuation seems to exist in these stocks at least after 1950s. In the Schaefer model, a stock fluctuation occurs, if either carrying capacity K or intrinsic growth rate r fluctuates. We examined both cases.
Figure 1. Biomass fluctuation of key pelagic species in
Pacific region around Japan
(Source: Hasegawa, 1997; Wada and Jacobson, 1998)
In the case of fluctuating K, carrying capacity K is assumed to fluctuate according to sine curve with 20 years in one cycle. The maximum and minimum of K is set to 25 000 and 5 000, respectively. Intrinsic growth rate r is set to constantly 0.8.
In the case of fluctuating r, intrinsic growth rate r is assumed to fluctuate according to sine curve with 20 years in one cycle. The maximum and minimum of r is set to 1.4 and 0.2, respectively. Carrying capacity K is set to constantly 15 000.
The fishing coefficient q was arbitrarily assumed to be 0.0005. Similarly, information was not available from the purse seine fishery to estimate a and b so these were also assumed.
The value b represents the costs per unit of effort. However, as we are attempting to identify the optimal yield in terms of quantity, we express all values in terms of weight rather than money. For example, let the fish price be US$100/tonne, the unit of fishing effort be 1 trip, the cost per trip per vessel be US$200, the fixed costs be US$1 000/year (i.e. a = 5), the upper limit of cruise in a year be 40, the actual number of cruises in a year be 30 and the catch in a year be 150 ton. The revenue of this case expressed by price is as follows:
Y = 150 ton × US$100 =US$15 000
Cost = US$1 000 + 30 trips × US$200/trips = US$7 000
Prof = US$15 000 - US$7 000 = U$8 000
In this study, however, we express revenue with weight as follows by dividing a and b by p:
The relationship between N and Y, and F and Y when carrying capacity K is the minimum and maximum of a given range and intrinsic growth rate r is constant are shown in Figure 2. The fluctuation of carrying capacity K, stock size N, and profit Prof using the dynamic production model:
|
Nt+1 = (1 + rF) Nt - rNt2/K(t) |
(8) |
which takes the change of K with time into consideration are shown in Figure 3. The initial value of stock size was set to 5 000.
FMSY in the Schaefer model is theoretically r/2. Therefore, FMSY is constant when r is constant, even if K fluctuates. Estimated FMSY using this model was 0.44 (Figure 4). It is known that the effort level that achieves MEY is less than that of MSY level. In this model, F which maximizes Prof was 0.26 when a = 5 and 0.24 when a = 10. In this model, full operation by 22 vessels (880 boat*trip) is equivalent to F = 0.44, since the maximum number of trips was set to 40 per year. Using this fishing capacity of 880 (boat*trip) fully makes an accumulated yield maximum for long-term period under stock fluctuation.
Figure 2a. Relationships between N and Y (left panel) and F and Y (right panel) when carrying capacity K changes 5000 and 25000 in Schaefer model
Figure 2b. Relationships between N and Y (left panel) and F and Y (right panel) when carrying capacity K changes 5000 and 25000 in Schaefer model
Figure 3. Twenty years simulation of the number in stock N and revenue Rev when carrying capacity K fluctuated. Intrinsic growth rate r was constant (0.8) and a = 5.
Figure 4. Relationships between fishing capacity and yield at each model. A: K was constant (15000), r fluctuated from 0.2 through 1.4 and F was set to r/2. B: K was constant, r fluctuated and F was set to constant (0.4). C: K fluctuated and r was constant (0.8). Here, fishing capacity is multiplied by q and yield is divided by 100.
The bionomic equilibrium point of F where Prof =0 at low stock level Feq(low) (K=5000, r=0.8) and high stock level Feq(high) (K=25 000, r=0.8) in the condition that a = 5 were 0.08 and 0.66, respectively (Table 1). These are equivalent to 160 and 1 320 (boat*trips) in fishing capacity, respectively, and equivalent to full (40) trips by four and 33 vessels.
Table 1. Simulated values of fishing mortality F, Fishing Capacity and Yield of each model when a =5.
|
Model |
|
Fishing Capacity |
F |
Yield |
Profit |
|
r = 0.8 (const.) 5000<K<25000 |
Feq (low) |
160 |
0.08 |
7600 |
0 |
| |
Max (profits) |
520 |
0.26 |
|
22 600 |
| |
Max (Yield) |
880 |
0.44 |
55 300 |
|
| |
Feq (high) |
1 320 |
0.66 |
63 300 |
0 |
|
K =15000 (const.) 0.2<r<1.4 |
Feq (low) |
300 |
0.15 |
14 000 |
0 |
|
1) F =0.4 (const.) |
Max (profits) |
480 |
0.24 |
|
22 800 |
| |
Max (Yield) |
1 040 |
0.52 |
56 700 |
|
|
2) F = r/2 |
Max (profits) |
720 |
0.36 |
|
25 500 |
| |
Max (Yield) |
1 400 |
0.7 |
59 800 |
|
| |
Feq (high) |
1 980 |
0.99 |
92 700 |
0 |
Two harvest strategies were examined for the case when carrying capacity, K, is constant and intrinsic growth rate, r, fluctuates, i.e. let F be constant and F be r/2 to meet fluctuating r.
The bionomic equilibrium point of F where Prof=0 at low stock level Feq (low) (K=15 000, r=0.2) and high stock level Feq (high) (K=15 000, r=1.4) in the condition that a = 5 and b = 2 were 0.15 and 0.99, respectively (Table 1). They are equivalent to 300 and 1980 (boat*trips) in fishing capacity, respectively, and equivalent to full (40) trips by 7.5 and 49.5 vessels.
Constant F strategy
The relationship between N and Y, and F and Y when r is the minimum and maximum of a given range and carrying capacity K is constant are shown in Figure 5. The time series of stock size N, yield Y and revenue Rev using non-equilibrium production model are shown in Figure 6. The yield became maximum when F = 0.52 which equivalent to full (40) cruise by 26 vessels (Figure 4). The profits became maximum when F = 0.24 which equivalent to full (40) cruises by 12 vessels in the condition that a = 5 (Table 1 and Fig. 8).
Figure 5. Relationships between N and Y when intrinsic growth rate r changes 0.2 and 1.4 in Schaefer model.
Figure 5. Relationships between F and Y when intrinsic growth rate r changes 0.2 and 1.4 in Schaefer model.
Figure 6. Twenty years simulation of N, Y and Rev when K was constant (15000) and a = 5. r fluctuated from 0.2 to 1.4 but F was set to 0.4.
F = r/2 strategy
The time series of stock size N, yield Y and profit Prof using the dynamic production model are shown in Figure 7. In this strategy, F fluctuates yearly but cannot exceed the upper limit corresponding to the fishing capacity set in advance. This case is the ideal harvest strategy, because F responds to the actual property of fish the stock. It is necessary to let excess fishing effort remain by closure of the fishery when F should be reduced owing to a low growth conditions.
Figure 7. Twenty years simulation of N, Y and Rev when K was constant (15 000) and a = 5. r fluctuated from 0.2 to 1.4 and F changed accordingly (F=r/2), but fishing capacity was restricted 800 (boat*trips).
In the simulation shown in Figure 7, the stock size gradually converged to K/2 (=7 500), the stock size that achieves MSY. The case when fishing capacity exceeds 1 400 (boat*trips) made yield maximum (Figure 4). Fishing mortality of 0.7, is equivalent to the full use of fishing capacity of 1 400 (boat*trips), and is equivalent to FMSY(high), which is also equivalent to a full number of trips by 35 vessels. Fishing mortality F that made the profits maximum varied with a. When a = 5, F = 0.36 (full trips by 18 vessels) made the profits maximum, while F = 0.30 (full cruises by 15 vessels) when a = 10, and F became smaller as a increased (Figure 8).
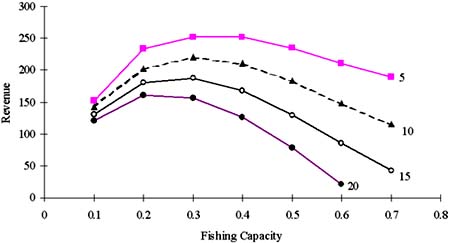
Figure 8. Relationships between fishing capacity and revenue at different a. K was constant (15000), r fluctuated from 0.2 to 1.4, F changed accordingly (=r/2), but fishing capacity was restricted 800 (boat*trips). Here, fishing capacity is multiplied by q and yield is divided by 100.
The reason why pelagic fishes around Japan fluctuate widely is not clearly understood yet. There may exist cases when carrying capacity changes due to a regime shift in climate and ocean condition, and there also may exist cases due to changes in the intrinsic growth rate by changing natural mortality due to density dependence (Kishida and Matsuda, 1993), predation or competition. Therefore, both cases are discussed here.
In the case when carrying capacity fluctuates and intrinsic growth rate is constant, it is the best decision for both stock sustainability and economy that let FMSY (XMSY) or FMEY (XMEY) which aims to achieve stock size to MSY or MEY level be reference point. The fishing capacity should not exceed the value equivalent to those reference points expressed F or X, because FMSY or FMEY is constant irrespective of stock size in this case. When stock level is the highest, 33 vessels can enter this fishery under open access condition in this model. However, it is necessary to reduce the number of vessel to 22 or 13 to maximize accumulated yield or profits over the long-term. The proper size of fishing capacity does not change irrespective of fixed costs a in seeking MSY. However, it became somewhat smaller as the fixed costs increased for MEY, therefore the actual optimal value of fishing capacity cannot be discussed unless the actual fixed costs are estimated. As shown in Figure 3, it should be noted that even the revenue became plus in average, those in low stock abundance years ran a deficit depends on economic parameters.
The results did not differ in the cases mentioned above, if fishing mortality was set to constant, even in the reverse case, i.e. intrinsic growth rate fluctuated and carrying capacity was constant. Although the bionomic equilibrium point of fishing effort where revenues and costs becomes equal at high stock abundance period indicates that 49.5 vessels can enter at most, it is necessary to reduce the number of vessels to 26 or 12 to maximize accumulated yield or profits over the long-term. It should be noted in this case that although the number of stock increases in the years when intrinsic growth rate are high, stock size decreases remarkably in the years when r declines, and the amplitude of stock fluctuation becomes large as a whole as shown in Figure 6. Therefore it may be necessary to manage with this strategy by setting cutoffs for spawning stock biomass or something in low stock level period.
In the case that fishing mortality can be changed annually according to the change of intrinsic growth rate, fishing capacity can be enlarged over 1 400. Fishing capacity of 1 400 which equivalents to full (40) cruises by 35 vessels equivalents to XMSY(high). To make a long-term accumulated yield maximum, it is necessary to reduce the number of cruise in a year when fishing mortality should be reduced due to decline of intrinsic growth rate. Fishing capacity should be reduced 720 (18 vessels) when MEY level is aimed at (when a = 5). As same as the case when r is constant, the fishing capacity to aim at MEY level became smaller as the fixed costs increased (Figure 8). Table 1 shows that accumulated yield became the largest in the case when reference point (fishing mortality) could be set annually in detail according to the change of r.
As shown above, the optimal fishing capacity for fluctuating stock in this model seems about a half the size of the effort level of bionomic equilibrium point for open access condition in high stock abundance period, if we want to make accumulated yield in long-term maximum. If we want to maximize the accumulated profits over the long-term, further reduction of fishing capacity seems necessary. This size of fishing capacity (Table 1) was about two or three times of XMSY(low) which equalled to 0.1 when r fluctuated from 0.2 through 1.4.
In this study, the important parameters q and p (fish price) are assumed to be constant for simplicity, but if the actual values are taken into consideration, the optimal fishing capacity may change. It is probable that the fishing coefficient q becomes smaller as the stock size increases, because the schooling pelagic fish has tendency that the stock size and CPUE shows increasing concave curve (Hilborn and Walters, 1992). Secondly, fish prices generally decrease as catch increase in order to balance demand and supply.
The Japanese statistics shows that the domestic purse seine fishery runs at a deficit in the total. Therefore, we will estimate the actual model of stock dynamics and the values of parameters used in this model and propose the proper fishing capacity for Japanese purse seine fishery.
Gordon, H.S. 1954. The economic theory of a common property resource: the fishery. Journal of Political Economy, 62: pp. 124-142.
Hasegawa, S. 1997. Estimation of stock size. In T. Kawa (ed.), Report of study on long-term prediction of fish alternation, Fisheries Agency of Japan, 96 pp. (in Japanese)
Hilborn, R. & Walters, C. J. 1992. Quantitative fisheries stock assessment. Choice, dynamics and uncertainty, Chapman and Hall, New York, London, 570 pp.
Kishida, T. 1998. The present status of mackerel stock and calculation of allowable biological catch (ABC), Journal of North Japan Fisheries Economics, 26: pp. 27-32 (in Japanese)
Kishida, T. & Matshda, H. 1993. Statistical analyses of intra- and interspecific density effects on recruitment of chub mackerel and sardine in Japan. Fisheries Oceanography, 2: pp. 278-287.
Schaefer, M.B. 1954. Some aspects of the dynamics of populations important to the management of commercial marine fishes. Bulletin of the Inter-American Tropical Tuna Commission, 1: pp. 25-56.
Wada, T., Sato, C. & Matsumitya, Y. 1996. Fisheries management for the Pacific mackerel, Scomber japonicus, based on spawning per recruit analysis. Bulletin of the Japanese Society for Fisheries and Oceanography, 60: pp. 363-371. (in Japanese)
Wada, T. & Jacobson, L.D. 1998. Regimes and stock-recruitment relationships in Japanese sardine (Sardinops melanostictus), 1951-1995. Canadian Journal of Fisheries and Aquatic Science, 55: pp. 2455-2463.
| [153] National Research
Institute of Fisheries Science, Fukuura 2-12-4, Kanazawa-ku, Yokohama, 236-8648,
Japan. Email: [email protected]. [154] Fisheries Agency of Japan, Kasumigaseki 1-2-1, Chiyoda-ku, Tokyo, 100-8000. Email: [email protected]. We are grateful to Dr. T. Ietsune for useful comments and critical reading on the manuscript. |
![]()
![]()
![]()