70. Geographical representation of professional staff. The principles of geographic representation of Member Nations followed by the Organization were established by the 27th session of the FAO Council in 1957. The norm for a country's representation is based on the percentage of its contribution to the Regular Programme as compared to the proportion of staff of that nationality funded from the Regular Programme with continuing or fixed-term appointments5.
71. Summary tables showing the countries that were not within the range of equitable representation as at 31 December 1999 (113 of 175 Member Nations) and 31 December 2001 (110 of 180 Member Nations), are shown in Annex II: Geographical Representation of Professional Staff. Excluded from the count for 1999 were 5 new members who joined in November 1999 and excluded from the count for 2001 were 4 new members who joined in November 2001.
72. At the end of 2001, there were 73 counties that exceeded the top of their range, compared to 82 at the end of 1999; 11 under-represented countries, compared to 10 at the end of 1999; and 26 non-represented countries, compared to 21 at the end of 1999. High priority is given to placement of professional staff from non-represented countries and 7 of the 21 non-represented counties in at the end of 1999 were equitably represented at the end of 2001. However, 14 of the non-represented countries at the end of 1999 were also non-represented at the end of 2001 and of the 12 new non-represented countries at the end of 2001, 5 were countries that became new members in November 1999.
73. For countries near the lower end of the scale of contributions, the addition of one staff member will move the country from non-represented to equitably represented and two staff members cause them to exceed the top of their range. Therefore, while efforts are made to maintain equitable distribution, it is to be expected that a fairly large number of countries will exceed the top of their range and hence be classified as over-represented.
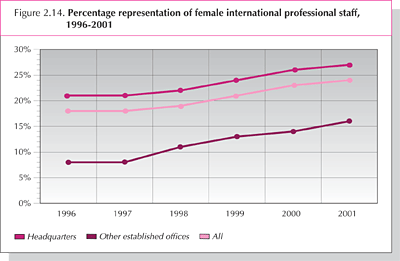
74. Gender balance of professional staff. Increasing the proportion of female staff in the professional category is one of the main human resources policy objectives of the Organization. Efforts during the last three biennia have resulted in the increase of women in professional posts at Headquarters from 21 percent in 1996 to 27 percent in 2001 and an increase in all locations from 18 to 24 percentage (Figure 2.14). These percentages are based upon the total number of international professional staff with fixed term or continuing contracts at Headquarters and other Established Offices6. While the percentage of women in professional posts in the FAO offices outside of Rome is significantly below Headquarters, the rate of increase has been relative high, growing from 8 percent in 1996 to 16 percent in 2001.
75. The 2000-01 PWB identified outputs for implementation under the technical and economic programmes. Following approval of the zero nominal growth (ZNG) budget level by the FAO Conference, departments were requested to identify the biennial outputs that would need to be reduced, eliminated or postponed as a result of reduced resources. Biennial outputs cancelled or postponed as a result of ZNG are excluded from the following analysis and the programme level tables later in the document. However, information on all other planned and unplanned outputs is available in the PIR Outputs Database on the FAO Internet site (http//www.fao.org/pir).
76. In the course of programme implementation it is sometimes necessary for modifications to be made in outputs, while others may be postponed or cancelled. New outputs may also be introduced to meet changing circumstances and specific requests. An overview of the implementation of the various types of outputs is provided in Table 2.10.
TABLE 2.10. IMPLEMENTATION OF OUTPUTS, 2000-01
Description |
Approved in PWB |
Cancelled/ postponed |
Unplanned delivered |
Total delivered |
Delivered |
Percentage delivered | |
unmodified | modified | ||||||
Coordination and information exchange |
396 |
(16) |
35 |
415 |
384 |
31 |
104.8 |
Direct advice to Members and field programme support |
572 |
(9) |
31 |
594 |
565 |
29 |
103.8 |
Information (products, systems, databases) |
466 |
(34) |
33 |
465 |
387 |
78 |
99.8 |
International undertakings, agreements/conventions and standards |
70 |
(3) |
19 |
86 |
76 |
10 |
122.9 |
Methodologies and guidelines (including pilot testing and demonstration) |
393 |
(33) |
19 |
379 |
282 |
97 |
96.4 |
Studies and analyses |
462 |
(31) |
62 |
493 |
397 |
96 |
106.7 |
Training (including training courses and materials) |
221 |
(19) |
28 |
230 |
192 |
38 |
104.1 |
Notional total |
2,580 |
( 145) |
227 |
2,662 |
2,283 |
379 |
103.2 |
77. In interpreting the number of outputs, it should be borne in mind that quantitative assessment, whether in terms of cost or output value, is not homogeneous. Hence, although the total number of outputs has been shown, it must be seen as indicative. A total of 2,834 outputs were included in the 2000-01 PWB, of which 60 (2 percent) were eliminated or postponed as a result of the ZNG budget. During preparation of the PWB 2000-01, separate outputs were specified for each contribution to a more general output; for example, the input of individual decentralized offices to the development of guidelines prepared by a headquarters division. To avoid such double counting, contributing outputs (165 in total) have been excluded from the current analysis, as have 29 duplicate outputs included in the PWB.
78. During programme implementation, 145 outputs (6 percent) were cancelled or postponed. In addition, 379 outputs (15 percent) were modified during programme implementation, of which 40 were affected by ZNG. The introduction of 227 new outputs during programme implementation more than counterbalanced outputs cancelled or postponed and resulted in a total of 2,662 outputs being delivered, about 3 percent more than the original number included in the PWB.
79. The number of outputs specified in the PWB 2000-01 was about 60 higher than in the past, at least partially as the result of the introduction of the new programme model, which required more attention being given to the development of outputs within programme entities. The increased attention during formulation of the programme resulted in a higher proportion of outputs (87 percent) being implemented as planned compared with 83 percent in 1998-99. Similarly, 8 percent of outputs were cancelled in 2000-01 compared with 18 percent in 1998-99 and 9 percent of outputs were unplanned in 2000-01 compared with 23 percent in 1998-99.
80. The increased emphasis in interdisciplinarity within the new programme model has led to many outputs being undertaken through cooperation between divisions and offices. Each output has a lead division and can have any number of contributing divisions assigned to it. During the biennia, 827 outputs - about 30 percent - had the contribution of other divisions, with 595 of these, 72 percent having one contributing division, 176 outputs, about 21 percent, having two to five contibuting divisions and the other 7 percent having more than five.
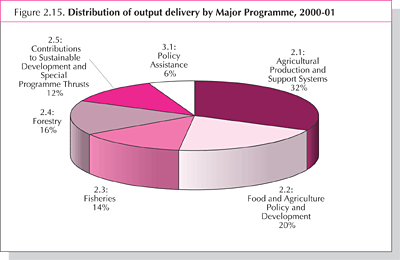
81. Major Programme 2.1: Agricultural Production and Support Systems had the largest delivery of outputs - 32 percent of the total - as shown in Figure 2.15. It accounted for 49 percent of methodologies and guidelines, 39 percent of coordination and information exchange and 37 percent of training. Major Programme 2.2: Food and Agriculture Policy and Development had 20 percent of all outputs, followed by Major Programme 2.4: Forestry with 16 percent, 2.3: Fisheries with 14 percent and 2.5: Contribution to Sustainable Development and Special Programme Thrusts with 12 percent. While Major Programme 3.1: Policy Assistance accounted for only 6 percent of total outputs, it had 16 percent of the outputs on direct advice to Members and field programme support.
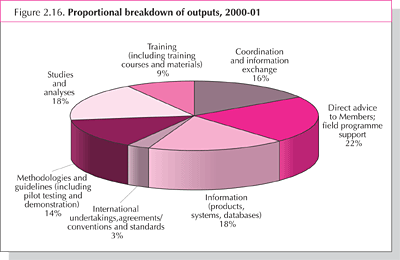
82. The distribution of outputs delivered by type is shown in Figure 2.16. Direct advice to Members and field programme support accounted for 22 percent of total outputs, with studies and analyses and information at 18 percent, coordination and information exchange at 16 percent and methodologies and guidelines at 14 percent. Other types of outputs ranged from 9 percent for training to 3 percent for international undertakings, agreements/conventions and standards.
83. Networks, expert consultations, task forces and working groups were generally the main means by which coordination and information exchange was carried out. Nearly all cooperation and collaboration with other UN organizations is included under this type of output. Of the coordination and information exchange outputs delivered, 92 percent were implemented as planned. Major Programme 2.1: Agricultural Production and Support Systems made the most frequent use of this type of output, followed by Major Programme 2.4: Forestry.
84. In the past, many of the unplanned outputs introduced during programme implementation related to support to member countries and the field, since specific requests can often not be foreseen in advance. During 2000-01 efforts were made to plan outputs, particularly in the decentralized offices, to respond to ad hoc requests for assistance. As a result, of the direct advice to Members and field programme support outputs delivered, 95 percent were implemented as planned. While support to member countries and the field was an important component of all major programmes, it was particularly significant in Major Programme 3.1: Policy Assistance, where over 60 percent of the outputs were of this type.
85. Information products, systems and databases were increasingly made available through CD-ROMs and over the Internet. Of the information outputs delivered, 83 percent were implemented as planned. Major Programme 2.1: Agricultural Production and Support Systems and Major Programme 2.2: Food and Agriculture Policy and Development, which included WAICENT, accounted for the largest proportion of outputs of this type.
86. This type of output made up only 3 percent of the total during 2000-01. However, the output constitutes an important component of FAO's work, focusing on areas such as plant protection, the International Code of Conduct on the Distribution and Use of Pesticides, plant and animal genetic resources, phytosanitary measures, the Codex Alimentarius and the Code of Conduct on Responsible Fisheries. Of the total outputs delivered related to international undertakings, agreements, conventions and standards, 88 percent were implemented as planned. Outputs of this type were mainly concentrated under Major Programme 2.1: Agricultural Production and Support Systems and 2.2: Food and Agriculture Policy and Development.
87. In the past, this was the main area in which delivery was below the level planned in the PWB. During 2000-01, there was significant improvement in the delivery of these outputs with 8 percent being cancelled or postponed compared with 23 percent in 1998-99. While the total number delivered was 4 percent less than the number planned, lower than all other types of outputs, it was a dramatic improvement over the 83 percent delivery in 1998-99. Of the methodologies and guidelines delivered, 74 percent were implemented as planned. These outputs often involve initial formulation followed by expert panel review and pilot testing before they are disseminated. The application of the new programme model, with technical projects of up to six years in duration, seems to have had a positive effect on the planning of methodologies and guidelines focusing on what can be realistically achieved within these outputs during a biennium. Outputs of this type were particularly concentrated under Major Programme 2.1: Agricultural Production and Support Systems, which accounted for nearly half of the total.
88. Delivery of studies and analyses outputs exceeded the level planned in the PWB by 7 percent and with 62 unplanned outputs it had more than any other output type. Studies and analyses outputs include case studies, country profiles, technical reports and synthesis and analyses of specific topics. Most of the additions were related to new topics that emerged as important during the biennia and could not be foreseen at the time the budget was prepared. Studies and analyses were important components of most programmes, particularly Major Programme 2.1: Agricultural Production and Support Systems, 2.3: Fisheries and 2.4: Forestry, each of which accounted for over 20 percent of the outputs of this type.
89. Training outputs include the organization of training courses and workshops, preparation of training materials and support to the training activities of others. Training outputs accounted for about 9 percent of total outputs in 2000-01. Of the training outputs delivered, 84 percent were implemented as planned. The 9 percent of training outputs cancelled was higher than the cancellation rate of any other type of output.
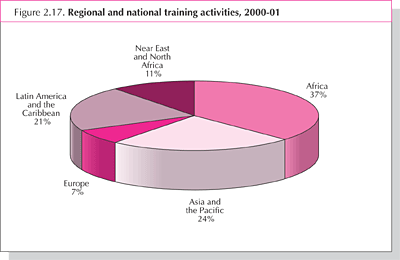
90. As shown in Figure 2.17, Africa was the largest recipient of training assistance during 2000-01, with 37 percent. Asia and the Pacific and Latin America and the Caribbean were recipients of 24 percent and 21 percent of training activities, respectively, while the Near East and North Africa and Europe had about 11 percent and 7 percent of the total, respectively.
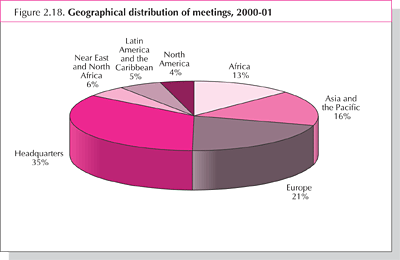
91. The organization of expert consultations and other meetings is an essential component of many types of output, particularly coordination and information exchange, preparation of methodologies and guidelines and support for international undertakings and agreements. In the past, meetings were included as a separate output type but, recognizing that a meeting is usually a means to achieving an output rather than an output itself, it was discontinued as an output type in 2000-01. However, it is considered useful to continue to report on the distribution of meetings by location, as shown in Figure 2.18. FAO headquarters is often the preferred location for meetings, as it simplifies logistics and assures effective secretariat support. During 2000-01, 35 percent of meetings were held at headquarters. Europe was the venue for 21 percent of meetings, followed by Asia and the Pacific with 16 percent and Africa with 13 percent.
5 Excludes field project staff, language staff, and staff on posts financed by Support Costs, Trust Funds and Other Funds.
6 Excludes field project staff and staff with contracts of less than 12 months.