![]()
![]()
![]()
By
E Mpyisi
Food Security Research Project (FSRP/USAID/MINAGRI)
Michigan State University/Ministry of Agriculture, Rwanda
Summary
Before the tragic events of 1994, the Agricultural Statistics Division (DSA) of the Ministry of Agriculture (MINAGRI) maintained a comprehensive database of agricultural statistics. The DSA was responsible for providing information on agricultural policy based on annual surveys of rural households. These surveys were conducted under the auspices of the Enquete National Agricole (ENA).
These surveys, which were interrupted in 1994 were resumed in 1999 by the Food Security Research Project (FSRP) and the Agricultural Statistics Division (DSA) of the MINAGRI. The FSRP/DSA began conducting agricultural surveys in 1999 using a national sample of 1584 households. The FSRP/DSA collects land use and production data on a seasonal basis (twice a year). The FSRP/DSA has 11 enumerators (one per province) as compared to 78 enumerators that the ENA had before 1994 and had to conduct surveys on a bigger sample than that of the ENA. Since the FSRP did not have the financial resources available to the ENA before 1994 it had to find a less costly but also accurate method to conduct the surveys. The most time consuming and therefore expensive activity of data collection was the area/field measurement. After considering various area measurement methodologies, the FSRP/DSA selected the P2/A (Perimeter Squared over Area) Methodology. This methodology minimizes time and costs.
The P2/A methodology is based on the unique and relatively stable relationship between a given field's perimeter squared (P2) and its area (A) for a known form of field. Perimeter squared (P2) and area tend to vary together and in the same direction. In fact, the two are so highly correlated that it would not be unreasonable to suggest that a field's perimeter could be used as a proxy measure of its area. This methodology further utilizes enumerator pacing around the field to measure the perimeter once the average length of the enumerator's stride has been calibrated and recorded. This innovative methodology has allowed the FSRP/DSA to conduct surveys on a national sample with a limited number of enumerators and at a reasonable cost.
Crop production is estimated using farmer recall for the season (6 months). Just after harvest, the enumerators visit the households and ask the farmer on the quantity produced during the season.
Such innovative methodologies are necessary in the face of declining resources for statistical surveys. Statisticians have to be creative in creating methodologies that serve the client's needs without compromising accuracy.
Résumé
Avant les événements tragiques de 1994, la division de la statistique Agricole(DSA) du Ministère de l'agriculture(MINAGRI) a monte' la base des données statistiques agricoles compréhensives. La DSA se devait de fournir des informations relatives à la politique agricole basée sur les sondages annuels menés en milieu rural auprès des ménages. Ces sondages s'étant déroules sous le thème: ENQUETE NATIONALE AGRICOLE(ENA).
Ces sondages, interrompus en 1994 avaient repris en 1999 cette fois-ci sous le thème: Le Projet sur la Recherche de la Sécurité Alimentaire “PRSA” et la Division de la Sécurité Alimentaire “DSA” du MINAGRI. Le PRSA/DSA avait commence' ses activités pour le sondage agricole en 1999 en se basant sur un échantillon national s'élevant ainsi a près de 1584 ménages. Le PRSA/DSA a ainsi recueilli les données relatives à la fois a l'utilisation des champs et a la production agricole sur la base de la saison (deux fois dans l'année).
Le PRSA/DSA disposait de 11 énumérateurs(1 par Province) contrairement a 78 que l'ENA avait utilisé avant 1994 pourtant ses sondages avaient été faits sur un échantillon plus large que celui de l'ENA. Puisque le PRSA n'avait pas suffisamment de ressources financières disponibles pour allouer à l'ENA avant 1994,il se devait ainsi de trouver une méthode moins coûteuse mais constituant par ailleurs une méthode fiable pour mener à bien des activités de sondage. Lors de la collecte des données statistiques, les mesures des champs/surfaces cultivées résultent à des retards qui plus tard deviennent très chères au budget.
Apres avoir tenu compte des méthodes variées concernant les mesures des champs, le PRSA/DSA avait opte' pour la formule mathématique: p2/A (Périmètre au carré sur la surface). Cette méthode de calcul minimise le temps et le coût. Cette formule au p2/A établie une relation très étroite entre le périmètre et la surface pour un champ particulier lorsque les deux ont été pris sur la base des dimensions réelles de ce champ. Car le périmètre et la surface varient selon la même tendance. En effet les deux sont tellement lies qu'il ne serait pas déraisonnable de suggérer que le périmètre d'un champ représente une mesure virtuelle de la surface de ce champ.
Les dimensions prises pour cette méthode ont été obtenues lorsque l'Enumérateur marque des pas uniformes autour de la plantation en les comptant puis en les enregistrant. Apres quoi, ces dimensions mesurées seront rapportées ou calibrées à leur juste valeur numérique.
Cette méthode innovative a permis au PRSA/DSA de mener des sondages sur un échantillon couvrant l'ensemble du pays avec un nombre très réduit d'Enumérateurs en utilisant un budget très modeste.
La production des plantes est estimée suivant l'interview des planteurs concernant leurs activités sur leur champ durant la saison écoulée a savoir (6 mois).Juste après les récoltes, les énumérateurs rendent visite auprès des planteurs pour leur demander la quantité des produits agricoles récoltes au cours de l'exercice agricole passe'.
De telle méthode innovative ne peuvent être qu'encouragée en dépit du manque crucial des informations relatives à la Statistique durant les sondages.
Les Statisticiens se doivent d'être créatifs et réalistes pour innover de plus en plus dans leur méthode de travail de manière a tenir compte des besoins de la clientèle sans pour autant compromettre la fiabilité des Données Statistiques.
1. The Importance of Root and Tuber Crops in Rwanda
a. Background to Rwanda
Rwanda is the most densely populated country in Africa with 300 people per square kilometer (and up to 600 people per square kilometer of arable land). The average farm size in 2001 was 0.7ha (Nyarwaya et al, 2001). Rwanda has a bi-modal rainfall pattern with two main growing seasons, with average annual rainfall of 1280 mm. The altitude ranges from approximately 1200 meters on the eastern plains and rises steadily to 3000 meters in the volcanic mountains to the west.
b. The Importance of Root and Tuber Crops in Rwanda
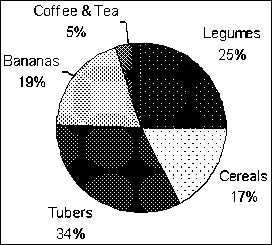
The main root and tuber crops in Rwanda are sweet potatoes, Irish potatoes and cassava. The importance of root and tuber crops in Rwanda is demonstrated by their prominence in terms of production and the area occupied. In 2001, these three crops accounted for 56% of the total production (tonnage) (see figure 1) of food crops and occupied 34% of the total cultivated land (see figure 2). Potatoes have been cultivated in Rwanda for nearly a century. Most accounts trace their introduction of the crop to the arrival of German missionaries in the late 19th century (Scott, 1988).
Figure 1: Percentage of Food Crops, 2001
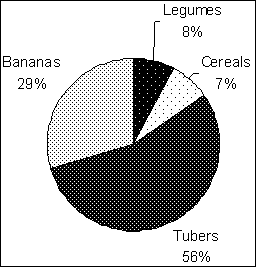
Figure 2: Percentage of Cultivated area by Crop, 2001
2. Agricultural Statistics in Rwanda
a. Background
Rwanda is currently in transition from a period of emergency to one of development following the 1994 war and genocide. Before the tragic events of 1994, the Agricultural Statistics Division (DSA) of the Ministry of Agriculture (MINAGRI) maintained a comprehensive database of agricultural statistics. The DSA was responsible for providing information on agricultural policy based on annual surveys of rural households. These surveys were conducted under the auspices of the Enquete National Agricole (ENA).
This database consisted of two parts: (1) an annual agricultural survey (crop production, land use, cultivated area, livestock, income and expenditure, etc.), and (2) a series of focused surveys/studies on selected topics such as crop sub-sectors (beans, sorghum, sweet potatoes, coffee), agroforestry, non-farm income strategies, farm inputs use, nutrition, etc.
b. Current Status
These surveys, which were interrupted in 1994 were resumed in 1999 by the Food Security Research Project (FSRP) and the Agricultural Statistics Division (DSA) of the MINAGRI. This means that there is a gap in agricultural statistics in Rwanda between 1990 (the last year that an agricultural report was published using an agricultural survey conducted on a nationally representative sample) and 2000 (when agricultural surveys were resumed on a nationally representative sample). The resumption of these activities was aimed at updating the agricultural statistics database and improving the internal capacity of MINAGRI to collect, process, and analyze data on key food security issues and to better inform the policy making process in ways that will contribute to the promotion of food security in Rwanda.
The FSRP/DSA began conducting agricultural surveys in 1999 using a national sample of 1584 households. The FSRP/DSA collects land use and production data on a seasonal basis (twice a year). The enumerators visit the farms twice per season. The first visit is for area measurement of the fields and crop density measurement. This is done 2-3 months after planting so that the enumerator can estimate the densities of the various crops in the fields. The second visit is for measuring production and this is done just after the harvest period. The FSRP/DSA has 11 enumerators (one per province) as compared to 78 enumerators that the ENA had before 1994 and had to conduct surveys on a bigger sample than that of the ENA. Since the FSRP did not have the financial resources available to the ENA before 1994 it had to find a less costly but also accurate method to conduct the surveys. The most time consuming and therefore expensive activity of data collection was the area/field measurement. After considering various area measurement methodologies, the FSRP/DSA selected the P2/A (Perimeter Squared over Area) Methodology. This methodology minimizes time and costs.
3. Estimation of Area - P2/A Methodology (Perimeter Squared over Area)
a. Summary of Methodology
The P2/A methodology is based on the unique relationship and relatively stable relationship between a given field's perimeter squared (P2) and its area (A). Perimeter squared (P2) and area tend to vary together and in the same direction. In fact, the two are so highly correlated that it would not be unreasonable to suggest that a field's perimeter could be used as a proxy measure of its area. In Rwanda the simple correlation ® between perimeter squared and area is 0.95. For purposes of generating aggregate estimates of area in Rwanda, the average ratio between perimeter squared and area could be simply applied to our perimeter squared measurements - which are easily and accurately obtainable.
However, because fields can and do vary a great deal in shape, their P2/A ratios vary accordingly. A square field, for example, has a P2/A ratio of 16; whereas a field whose length is say, 3 times its width has a P2/A ratio of 21. It is therefore argued that the precision of our area estimation can be improved significantly if the actual P2/A is known for each field. An important objective of the P2/A method is to permit the enumerator to estimate this ratio expediently and with a minimum degree of error.
Table 1: Ratios for General Form of Block
|
General form of Block |
P2/A ratio |
Area of field |
|
1x1 |
16 |
P2/16 |
|
1x1.5 |
17 |
P2/17 |
|
1x2 |
18 |
P2/18 |
|
1x3 |
21 |
P2/21 |
|
1x4 |
25 |
P2/25 |
|
1x5 |
29 |
P2/29 |
b. Practical Application of P2/A Methodology
Recording the length of the enumerator's stride: In measuring the perimeter of the field, the FSRP/DSA decided to have the enumerator pace the field and record the number of steps taken around the field. It was therefore necessary to get the average length of each enumerator's stride and record it for use in the computation of the perimeter of the field. This is done by having the enumerator pace around several fields of known perimeter (actually measured by a tape measure). These fields are of varying slopes so as to reflect natural fieldwork conditions. After several trials, the average length of the enumerator is calculated.
Sketch of the block: The enumerator begins by making a rough sketch of the block (for purposes of this paper, we will call a piece of land a “block” which contains several “fields” (see figure 3 below). The enumerator then identifies the distinct fields within the block and numbers them. The enumerator then measures the length of each side of the block by pacing it and writes the number of steps next to the corresponding side of the sketch. After recording the number of steps the enumerator may need to re-adjust the sketch of the block to reflect the actual number of steps taken. With the sketch and block before him, the enumerator determines the rough dimensions of the block indicating whether the block is rectangular, triangular, or of an irregular form and in this case indicating the ratio of the sides (e.g. length × width = 1:1, 1:2, 1:3, etc.). He then fills in this information in the box below the sketch (see figure 3).
Computation of the block area: The block area is calculated by a computer program. The perimeter is calculated using the sum of the enumerator's steps (of known length). Since the general form of the field has also been indicated, once can therefore calculate the area of the block using the P2/A methodology.
Computation of the area of the fields and the area of each crop: In Rwanda, each block typically has several fields and each field typically has more than one crop due to intercropping. The enumerator then fills in table 2 accordingly (see table 2). For each field, the enumerator records the principal crop present in that field and the density of that crop in the field (as a percentage of a pure stand of that particular crop). The enumerator then does the same for the second, third, etc. crop present in that field as necessary. The sum of the percentages of these crops in each field does not have to add up to 100%, it can be less than or more than 100% (in inter-cropping, it is common to have these percentages add up to over 100%). This process is done for all the fields in the block. In the last column, the enumerator estimates the percentage of the area taken up by that field in the whole block. This process is done for all the fields in the block. The last column should sum up (downwards) to 100%. One can therefore calculate the area of each field because the area of the whole block is known. The actual area of the crop is determined by normalizing the percentages (across) of each crop to the area of the field. A computer program is used to calculate the area of the field and each crop.
Figure 3: Block Sheet
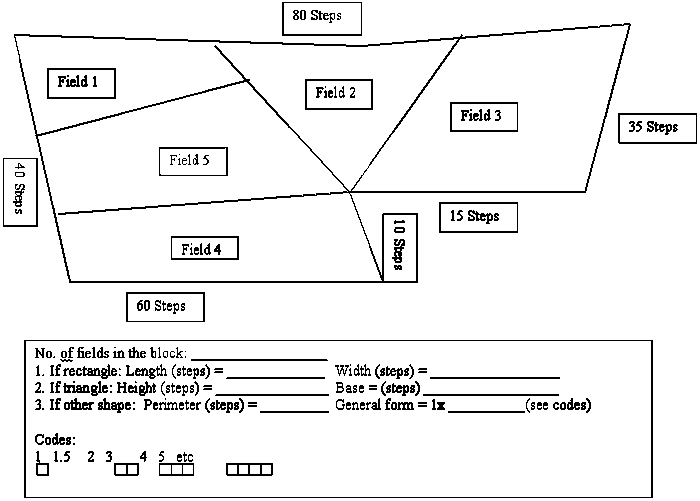
Table 2: Characteristics of the Fields in the Block
Table 3: Production Sheet (modified)
4. Estimation of Production
Production is estimated using farmer recall. Just after harvest, the enumerators visit the households to estimate production. The enumerators use the Production sheet above (Table 3) to ask the farmer how much he or she harvested. For crops that are harvested at one specific time (such as beans or maize), this is fairly easy for the farmers to remember. For the crops that are harvested over an extended period of time such as cassava and sweet potatoes, this is a bit more difficult. Even for these crops, they are usually harvested over 2 or 3 months during the season. The enumerators are trained to ask the farmers how much they harvested each week over this 2-3 month period and they then multiply by the number of months to get the season's production.
Another difficult aspect of measuring production is the use of non-standard units that farmers use to measure their production. Studies have been conducted to determine the weights for many of these non-standard units so conversion factors are known. Where the farmer has a measure that is not known the enumerator estimates the weight of the measure and records it.
5. Conclusions on the Methodology
a. Area Measurement using P2/A Methodology
This methodology is ideal when there is a limited number of enumerators with a need to survey many households. It allows enumerators to measure area fairly quickly and also cuts down survey costs. In a country such as Rwanda where the average household has 4 blocks of irregular shapes, it would take a very long time to measure area using the traditional methods of measuring field angles and perimeter using a tape measure. The P2/A methodology is flexible and has been found to be fairly accurate. Field trials of this methodology found a 12% gross error in actual area measurement at the block level. This represents over and under estimation which cancelled out one another to give a 2% net error. This is considered a significantly unbiased estimate especially at the aggregate provincial or national level. This also allows one to use fewer enumerators thereby reducing training costs and enumerator errors and it is also easier to supervise fewer enumerators. It is also important to re-calibrate the stride of the enumerator during the course of the season as it may change with time. In a country such as Rwanda that is very hilly, the step of the enumerator may also vary depending on the slope of the land. The more sides that a field has as increases the incidence of error. Measuring field angles and using a tape measure is obviously a more accurate method but takes a lot of time and therefore increases costs.
b. Production Estimate
This recall method is saves a lot of time and keeps the costs down. For crops harvested at one specific time, this method is good. For crops that are harvested over an extended period of time such as the root and tuber crops, this is more difficult to measure. A farmer may not remember the amount harvested four months ago and may give an erroneous answer. The ideal method for measuring crop production is repeated visits by the enumerator every 2 or so weeks to measure production.
5. Recommendations
Agricultural statistics are critical for any country and especially for developing countries where about 90% of the population is dependent on agriculture and a large percentage of the GDP (40% in Rwanda) comes from agriculture. Having good accurate statistics is also very costly. The decision makers who have to allocate budgets for statistical programs may not appreciate the importance of statistics and therefore be reluctant to spend many resources on them. It is therefore important for statisticians to promote the importance of statistics whenever the chance is available.
Knowing that there is often a shortage of resources for statistics, statisticians should also be ready to be creative and innovative in designing survey methodologies that address the demands of the clients without compromising the accuracy of the statistics. One such methodology is the P2/A methodology for measuring area. Another possible methodology is the use of GPS to measure area. This system may require a substantial initial investment but in the long run it is very accurate and can be used to address a variety of demands, not only agricultural.
In setting up expensive systems such as the GPS system, a combination of ministries/services can consider collaboration in sharing the initial costs. The results from the use of such a system can applied to a wide of range of services such as road, health centers, educational centers, etc.
Finally, in countries where human resources in statistics are limited, they can consider centralizing their statistical services under one agency/unit. This allows the consolidation of smaller units (in human resources and equipment) to create a critical mass of human resources that can benefit from synergies.
References
Munyemana, Augustin and M. von Oppen. (1999). La pomme de terre au Rwanda: Une analyse d'une filiere a hautes potentialities. Centre International de la Pomme de Terre, Lima, Perou.
Nyarwaya, J.B., E. Shingiro, and E. Mpyisi. (2001). Statistiques Agricoles: Production, Elevage, Superficies et Utilisation des Terres, Annee Agrocile 2001. FSRP/DSA MINAGRI, Kigali, Rwanda.
Scott, Gregory J. (1988). Potatoes in Central Africa: A Study of Burundi, Rwanda, and Zaire. Lima: International Potato Centre
![]()
![]()
![]()
)
)