![]()
![]()
![]()
At present, Ghana does not produce manufactured fertilizers, although there are some deposits of rock phosphate in the country. All the fertilizers used in the country are imported.
Table 16 shows the quantities of different types of fertilizers imported into the country between 1997 and 2001. The major importers of fertilizers into Ghana are private companies. The Agricultural Development Bank and some commercial farms also import fertilizers, either for their clients or for their own use. The imports of compound fertilizers far exceed the imports of the other fertilizers in Ghana. The second most important imported products are ammonium sulphate (AS) and muriate of potash (MOP). The imports of urea, SSP and TSP are marginal. The major importers account for about 80 percent of the total fertilizer requirements of the country.
From the major importers, the fertilizers may go either to the end users such as the oil-palm sector, the tobacco sector, the cotton sector and the large rice irrigation projects or through intermediary channels consisting of registered wholesalers/retailers, located in most of the regional capitals. These registered wholesalers/retailers distribute fertilizers through a network of rural shops dealing in agricultural inputs and located in the districts. Alternatively, farmers may buy fertilizers directly from the wholesalers or the rural retail shops, whichever they find convenient. There are about 700 rural retailers of fertilizers spread throughout the country, with the highest concentration in the maize belt in the Brong Ahafo region.
TABLE 16
Fertilizer imports
|
Year |
15-15-15 |
Other compounds |
Urea |
MOP |
AS |
SSP/TSP & others |
Total |
|
‘000 tonnes product |
|||||||
|
1997 |
19.2 |
17.9 |
1.9 |
5.5 |
10.7 |
1.1 |
56.3 |
|
1998 |
13.1 |
8.8 |
0.5 |
3.1 |
13.3 |
3.6 |
42.4 |
|
1999 |
3.2 |
0.4 |
0 |
8.1 |
4.8 |
5.5 |
22.0 |
|
2000 |
14.1 |
0.8 |
0.1 |
4.5 |
23.2 |
0.8 |
43.5 |
|
2001 |
31.8 |
17.5 |
2.5 |
4.1 |
22.6 |
2.3 |
80.8 |
Source: MOFA, 2003.
|
FIGURE 7
|
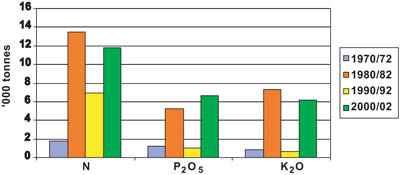
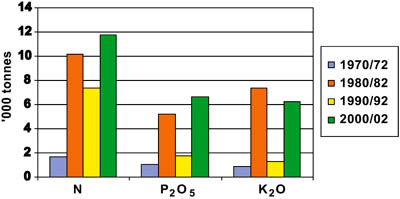
Tables 17 and 18 give the apparent fertilizer consumption by type and nutrient in Ghana between 1995 and 1999. Compound fertilizers accounted for 48 percent of the total amount of fertilizers consumed during that period.
The relatively high proportion of potassium is due to its use in oil-palm production. Nitrogenous fertilizers (urea and AS) accounted for 30 percent of the total fertilizers consumed.
Figure 8 illustrates the development of fertilizer consumption since the early 1970s.
TABLE 17
Apparent fertilizer consumption by
type
|
Year |
15-15-15 |
20-20-0 |
Urea |
AS |
KNO3 |
Total |
|
(‘000 tonnes product) |
||||||
|
1995 |
9.3 |
0 |
4.3 |
9.0 |
2.2 |
24.8 |
|
1996 |
5.9 |
2.8 |
1.0 |
5.3 |
0.9 |
15.9 |
|
1997 |
19.2 |
17.9 |
1.9 |
10.7 |
1.1 |
50.8 |
|
1998 |
13.1 |
8.8 |
0.5 |
13.3 |
3.6 |
39.3 |
|
1999 |
3.2 |
0.4 |
0 |
4.8 |
5.5 |
13.9 |
Source: MOFA, 2003.
TABLE 18
Apparent fertilizer nutrient
consumption
|
Year |
N |
P2O5 |
K2O |
Total |
|
(tonnes) |
||||
|
1995 |
5.6 |
1.4 |
4.1 |
11.1 |
|
1996 |
3.2 |
1.4 |
4.1 |
8.7 |
|
1997 |
9.8 |
6.5 |
9.7 |
26 |
|
1998 |
7.3 |
3.7 |
6.8 |
17.8 |
|
1999 |
2.3 |
0.6 |
6.2 |
9.1 |
Source: MOFA, 2003.
|
FIGURE 8
|
During the 1970s fertilizer consumption increased ten-fold with a peak of about 31 000 tonnes total nutrient in 1977. The FAO Fertilizer Programme was very active in Ghana and this probably contributed to the increase. However, this level still represented a low average rate of fertilizer use per hectare of cultivated land. From 1984 onwards fertilizer consumption fell following the introduction of the Structural Adjustment Programme and the removal of most agricultural support, including fertilizer subsidies. It increased in the second half of the 1990s following an improvement in the national economy but fell again as a result of renewed financial problems and depreciation of the Cedi. Nevertheless, in 2002 it recovered to the level of the early 1980s. However, at about 5 kg per hectare of cultivated land it is at half the level of sub-Saharan Africa and at a quarter of the level of Africa as a whole.
Considerably more plant nutrients are being removed and lost than are being applied, with a consequent progressive impoverishment of soils. Traditional, soil exhausting cultivation practices are still used extensively (Gerner et al., 1995).
Almost all the crop balances in Ghana show a nutrient deficit, i.e. the difference between the quantities of plant nutrients applied and the quantities removed or lost (FAO, 2004). This represents a loss of potential yield and progressive soil impoverishment. According to the estimates, cassava and yams account for almost 20 percent of the cropped area but 37 percent of the nitrogen deficit. These crops remove large quantities of nutrients and their soils are prone to erosion during harvest. The highest depletion rates are in the southeast and the central west parts of Ghana, which correspond to the cassava area. Cocoa accounts for 28 percent of the cropped area but for only 15 percent of the nitrogen deficit. The quantity of nutrients removed with the harvested crop is limited and the erosion risk is low, since the land is covered by vegetation and litter and the soil is well anchored by the root systems. The coconut crop accounts for only 1 percent of the land area but for 15 percent of the nitrogen deficit.
There are no recent data on the use of fertilizers on crops in the different regions.
Fertilizer use is primarily on cash crops. It is possible that some quantities destined for cash crops are in fact applied to food crops (Table 19).
Despite its importance as an export crop, fertilizer use on cocoa has been negligible, due partly to the low farm prices that have prevailed. The Cocoa Research Institute of Ghana (CRIG) has introduced a special grade of fertilizer called Asase Wura. The formulation comprises: 0-18-22 + calcium, sulphur and magnesium. This fertilizer increases the yield of cocoa significantly. It is anticipated that the use of fertilizers on cocoa could more than double in the near future.
The average sales of fertilizers between 1988 and 1990 for the geographical regions of Ghana are presented in Table 20.
Using these percentage sales by region, estimates of fertilizer consumption per region were derived from the total national fertilizer consumption for the period 1997 to 2001. These estimates are given in Table 21. The Upper Regions represented by the Upper East and the Upper West Regions constitute the regions with the highest fertilizer consumption. This is due partly to the production of vegetables such as tomatoes and onions under irrigation during the dry season in the Upper East Region. The Upper East Region has two large irrigation schemes at Tono and Vea. Because of the high economic value of tomatoes and onions during the dry season, farmers are willing to purchase and apply fertilizers to these crops. The Western Region has the lowest consumption of fertilizers since the major farming activity is cocoa. It is only recently that fertilizer use on cocoa has attracted the attention of farmers.
TABLE 19
Crop fertilizer use (tonnes)
| |
1990 |
1991 |
1992 |
1993 |
1994 |
1995 |
1996 |
1997 |
1998 |
1999 |
1990 - |
1995 - |
Growth |
|
NPK |
1 275 |
n.a. |
4 350 |
3 000 |
3 912 |
2 790 |
1 761 |
5 769 |
3 917 |
961 |
12 537 |
15 198 |
|
|
Urea |
2 010 |
n.a. |
0 |
0 |
0 |
425 |
95 |
185 |
50 |
0 |
2 010 |
755 |
|
|
MOP |
0 |
n.a. |
200 |
1 000 |
1 250 |
1 700 |
2 250 |
2 725 |
1 548 |
3 253 |
2 450 |
11 476 |
|
|
Oil-palm |
3 285 |
n.a. |
4 550 |
4 000 |
5 162 |
4 915 |
4 106 |
8 679 |
5 515 |
4 214 |
16 997 |
27 429 |
5 |
|
share |
0.1 |
|
0.2 |
0.2 |
0.2 |
0.2 |
0.2 |
0.2 |
0.1 |
0.2 |
0.1 |
0.2 |
|
|
|
|||||||||||||
|
NPK |
638 |
n.a. |
2 175 |
1 500 |
1 956 |
1 395 |
881 |
2 885 |
1 959 |
480 |
6 269 |
7 599 |
|
|
AS |
2 500 |
n.a. |
11 500 |
7 600 |
8 500 |
9 000 |
5 320 |
10 700 |
13 265 |
4 800 |
30 100 |
43 085 |
|
|
Urea |
16 080 |
n.a. |
0 |
0 |
0 |
3 400 |
760 |
1 480 |
400 |
0 |
16 080 |
6 040 |
|
|
Other |
17 000 |
n.a. |
3 000 |
0 |
0 |
0 |
2 830 |
17 850 |
8 800 |
400 |
20 000 |
29 880 |
|
|
Cotton |
36 218 |
n.a. |
16 675 |
9 100 |
10 456 |
13 795 |
9 791 |
32 915 |
24 424 |
5 680 |
72 449 |
86 604 |
2 |
|
share |
0.8 |
|
0.6 |
0.5 |
0.4 |
0.5 |
0.5 |
0.6 |
0.6 |
0.3 |
0.6 |
0.5 |
|
|
|
|||||||||||||
|
NPK |
1 488 |
n.a. |
5 075 |
3 500 |
4 564 |
3 255 |
2 055 |
6 731 |
4 572 |
1 121 |
14 627 |
17 731 |
|
|
KNO |
0 |
n.a. |
0 |
560 |
20 |
2 190 |
900 |
1 083 |
3 597 |
5 531 |
580 |
13 301 |
|
|
Urea |
2 010 |
n.a. |
0 |
0 |
0 |
425 |
95 |
185 |
50 |
0 |
2 010 |
755 |
|
|
Tobacco |
3 498 |
n.a. |
5 075 |
4 060 |
4 584 |
5 870 |
3 050 |
7 999 |
8 219 |
6 652 |
17 217 |
31 787 |
6 |
|
share |
0.1 |
|
0.2 |
0.2 |
0.2 |
0.2 |
0.2 |
0.1 |
0.2 |
0.3 |
0.2 |
0.2 |
|
|
|
|||||||||||||
|
NPK |
850 |
n.a. |
2 900 |
2 000 |
2 608 |
1 860 |
1 174 |
3 846 |
2 612 |
640 |
8 358 |
10 132 |
|
|
MOP |
0 |
n.a. |
200 |
1 000 |
1 250 |
1 700 |
2 250 |
2 725 |
1 548 |
3 253 |
2 450 |
11 476 |
|
|
Pineapple |
850 |
n.a. |
3 100 |
3 000 |
3 858 |
3 560 |
3 424 |
6 571 |
4 159 |
3 893 |
10 808 |
21 608 |
7 |
|
share |
0.0 |
|
0.1 |
0.2 |
0.2 |
0.1 |
0.2 |
0.1 |
0.1 |
0.2 |
0.1 |
0.1 |
|
|
|
|||||||||||||
|
Total |
43 850 |
|
29 400 |
20 160 |
24 060 |
28 140 |
20 370 |
56 164 |
42 317 |
20 439 |
23 494 |
33 485 |
4 |
Source: MOFA, Crops Services and WienCo.
TABLE 20
Average sales of fertilizer by
region
|
Region |
Average sales, 1988/90 |
Percentage of the total |
|
Ashanti |
2 554 |
9.2 |
|
Brong Ahafo |
3 760 |
13.5 |
|
Central |
803 |
2.9 |
|
Eastern |
507 |
1.8 |
|
Greater Accra |
610 |
2.2 |
|
Northern region |
7 535 |
27.1 |
|
Upper regions |
7 681 |
27.6 |
|
Volta |
4 209 |
15.1 |
|
Western |
170 |
0.6 |
|
Total |
27 829 |
100 |
Source: Adapted from Bonsu, Ofosu and Kwakye, 1996.
TABLE 21
Average sales of fertilizer by
region
|
Region |
1997 |
1998 |
1999 |
2000 |
2001 |
|
(tonnes) |
|||||
|
Ashanti |
5 167 |
3 893 |
2 023 |
4 046 |
7 438 |
|
Brong Ahafo |
7 582 |
5 712 |
2 969 |
5 937 |
10 914 |
|
Central |
1 629 |
1 229 |
638 |
1 275 |
2 345 |
|
Eastern |
1 011 |
762 |
396 |
792 |
1 455 |
|
Greater Accra |
1 236 |
931 |
484 |
967 |
1 779 |
|
Northern |
15 220 |
11 467 |
5 960 |
11 917 |
21 910 |
|
Upper Regions |
15 501 |
11 679 |
6 070 |
12 137 |
22 314 |
|
Volta |
8 481 |
6 390 |
3 321 |
6 640 |
12 208 |
|
Western |
337 |
254 |
132 |
264 |
483 |
|
Total |
56 164 |
42 317 |
16 593 |
43 975 |
80 846 |
Source: MOFA.
The farm price of fertilizer is determined by the import costs and the margins taken by the distribution sector. The costs include the CIF price, port charges and tariffs, loading and unloading, transportation, storage, interest on loans, insurance and other fees. The margins are the difference in price at each stage of distribution, between the manufacturer or importer, the wholesaler, the retailer and the farmer (or final end user). The regional wholesale and retail prices of fertilizers for 2001/02 are given in Table 22.
TABLE 22
Regional, wholesale and retail prices in
2001/02
|
Product |
Unit |
Wholesale price |
Retail price |
||
|
(‘000 Cedis/bag) |
US$/unit |
(‘000 Cedis/bag) |
US$/unit |
||
|
15-15-15 |
25 kg |
51.0 |
6.9 |
60.1 |
8.1 |
|
15-15-15 |
50 kg |
95.6 |
12.9 |
106 |
14.3 |
|
17-17-17 |
50 kg |
112 |
15.1 |
120 |
16.2 |
|
20-20-20 |
50 kg |
105 |
14.1 |
120 |
16.2 |
|
23-15-15 |
50 kg |
94.3 |
12.7 |
104.6 |
14.1 |
|
AN |
25 kg |
45.4 |
6.1 |
49.9 |
6.7 |
|
AN |
50 kg |
75.7 |
10.2 |
85.8 |
11.6 |
|
MOP |
50 kg |
115 |
15.5 |
- |
- |
|
SSP |
50 kg |
96 |
12.9 |
92.1 |
12.4 |
|
TSP |
50 kg |
- |
- |
115.6 |
15.6 |
|
Urea |
25 kg |
60.4 |
8.1 |
62.8 |
8.5 |
|
Urea |
50 kg |
104.2 |
14.0 |
113.3 |
15.3 |
Source: IFDC, Africa.
TABLE 23
Retail price of fertilizers in Ghana from 1988
to 1999 and 2002
|
Year |
Retail prices of fertilizer (Cedis/kg) |
|||||
|
15-15-15 |
Urea |
AS |
MOP |
|||
|
1988 |
46 |
n.a. |
32 |
n.a. |
||
|
1989 |
67 |
n.a. |
47 |
n.a. |
||
|
1990 |
84 |
84 |
62 |
76 |
||
|
1991 |
84 |
84 |
62 |
76 |
||
|
1992 |
140 |
84 |
120 |
200 |
||
|
1993 |
170 |
84 |
156 |
240 |
||
|
1994 |
347 |
322 |
262 |
300 |
||
|
1995 |
450 |
700 |
320 |
500 |
||
|
1996 |
620 |
700 |
500 |
700 |
||
|
1997 |
680 |
840 |
480 |
760 |
||
|
1998 |
780 |
860 |
440 |
760 |
||
|
1999 |
780 |
860 |
440 |
760 |
||
|
2002 |
2 404 |
2 511 |
1 995 |
n.a. |
||
In the 1970s and 1980s subsidies on fertilizers were among the major incentives given to farmers by the government of Ghana. From 1987 onwards, subsidies were removed gradually. By 1989 all subsidies had been withdrawn. Since there were fertilizers in stock, the prices remained almost constant for two years (1990/91) and then started to increase. The retail prices of the four important fertilizers being used by farmers between 1988 and 2002 are given in Table 23. The 2002 prices calculated from Table 22 are presented for comparison.
TABLE 24
Cedi/US$ exchange rate
|
Year |
Average annual Interbank
rate |
|
1993 |
649 |
|
1994 |
957 |
|
1995 |
1 200 |
|
1996 |
1 637 |
|
1997 |
2 050 |
|
1998 |
2 314 |
|
1999 |
2 647 |
|
2000 |
5 322 |
|
2001 |
7 218 |
|
2002 |
7 869 |
Source: ISSER, 1999 and 2002.
The progressive increase in fertilizer retail prices follows increases in the exchange rate of the local currency (Cedi) with respect to the US$. The Interbank exchange rates of the Cedi with respect to the US$ from 1993 to 2002 are given in Table 24.
The wholesale prices of the different fertilizers vary from month to month. The variation in monthly prices partly reflects fluctuations in the exchange rate of the Cedi with respect to US$. The monthly variation in wholesale prices is presented in Table 25. The monthly variation in retail prices reflects the monthly variation in the wholesale prices (Table 26), while Table 27 shows price increases between January and December 2001.
TABLE 25
Monthly wholesale prices in 2001 (‘000
Cedis per bag)
|
Month |
15-15-15 |
AS |
Urea |
||
|
25 kg |
50 kg |
25 kg |
50 kg |
50 kg |
|
|
January |
47.4 |
89.3 |
73.3 |
91.4 |
86.8 |
|
February |
47.9 |
89.4 |
73.5 |
91.4 |
86.8 |
|
March |
49.4 |
89.8 |
74.1 |
91.8 |
87.2 |
|
April |
50.5 |
89.7 |
74.6 |
91.6 |
87.1 |
|
May |
51.1 |
89.8 |
75.7 |
91.7 |
87.1 |
|
June |
51.7 |
90.3 |
76.1 |
92.3 |
87.9 |
|
July |
52.1 |
90.9 |
77.5 |
92.9 |
88.6 |
|
August |
52.4 |
90.5 |
77 |
92.4 |
88 |
|
September |
52.3 |
89.9 |
77.9 |
91.8 |
87 |
|
October |
51.8 |
91.3 |
78 |
93.3 |
89 |
|
November |
52.4 |
93.6 |
81.2 |
95.7 |
91.7 |
|
December |
53.2 |
94.1 |
82.5 |
96.3 |
92.4 |
Source: IFDC, Africa.
TABLE 26
Monthly retail prices of fertilizers in 2001
(‘000 Cedis/bag)
|
Month |
15-15-15 |
AS |
Urea |
|||
|
25 kg |
50 kg |
25 kg |
50 kg |
25 kg |
50 kg |
|
|
January |
55.6 |
99.5 |
46.7 |
81.8 |
62.0 |
112.2 |
|
February |
53.1 |
101.3 |
46.7 |
81.8 |
62.0 |
112.2 |
|
March |
54.2 |
102.1 |
46.7 |
83.6 |
62.0 |
112.2 |
|
April |
55.4 |
102.9 |
49.5 |
84.5 |
62.0 |
112.6 |
|
May |
56.0 |
104.0 |
49.5 |
84.1 |
63.5 |
113.4 |
|
June |
56.3 |
105.0 |
49.5 |
84.1 |
63.5 |
114.5 |
|
July |
56.9 |
106.8 |
52.5 |
87.0 |
62.0 |
113.0 |
|
August |
57.2 |
108.5 |
49.5 |
86.9 |
62.0 |
113.0 |
|
September |
56.9 |
110.2 |
52.0 |
89.6 |
62.0 |
114.5 |
|
October |
56.9 |
110.2 |
52.0 |
90.7 |
64.0 |
114.5 |
|
November |
56.8 |
111.3 |
54.4 |
90.0 |
64.8 |
113.8 |
|
December |
58.6 |
113.4 |
54.4 |
90.0 |
63.5 |
117.2 |
Source: IFDC, Africa.
TABLE 27
Increases in fertilizer prices between January
and December 2001
|
Fertilizer type |
Bag |
Increase |
|
|
Wholesale price |
Retail price |
||
|
% |
% |
||
|
15-15-15 |
25 kg |
12.1 |
5.4 |
|
15-15-15 |
50 kg |
5.4 |
14.0 |
|
AS |
25 kg |
12.4 |
16.6 |
|
AS |
50 kg |
5.4 |
9.8 |
|
Urea |
25 kg |
n.a. |
2.4 |
|
Urea |
50 kg |
6.5 |
4.4 |
![]()
![]()
![]()