![]()
![]()
![]()
The production of fertilizers started in Iran in 1945, in a small factory near the city of Karaj. Within ten years it had reached a production potential of around 60 tonnes. The main products were single super phosphate (SSP), thermo phosphate, bone powder and potassium nitrate. It was in 1955 that 176 tonnes of mineral fertilizers were imported into the country by the government for the first time. Along with this importation, the private sector also purchased 305 tonnes of mineral fertilizer. Later, the sugar industry also started to import on its own behalf. In the 1960s there were more than 17 different types of mineral fertilizers used in the country including five different N-fertilizers, four P-fertilizers, three types of Kfertilizers and more than five varieties of mixed fertilizers.
In the 1970s, with the establishment of Razi Petrochemical Industries, the government banned imports by the private sector. This company produced mainly triple superphosphate (TSP), diammonium phosphate (DAP) and ammonium sulphate (AS).
The National Petrochemical Company manufactures a total of 1.8 million tonnes of urea and ammonium phosphates annually. After the revolution, at the initiative of Soil and Water Research Institute (SWRI) and as a result of soil testing, it became evident that a comprehensive plan for developing fertilizer production in the country was necessary. As a result, production by the private sector of fertilizers, including micronutrients, was promoted. This has led to the manufacture of a range of fertilizers since 1995. Over two hundred small manufacturers in different parts of Iran have been issued with permits to produce in total about two million tonnes of NPK compound fertilizers. Since 1995 many manufacturers have begun to produce micronutrient fertilizers such as zinc sulphate, copper sulphate, manganese sulphate, iron sulphate and boric acid. Several plants have recently begun the manufacture of superphosphate fertilizers (SSP or TSP) in locations where high-grade rock phosphates are plentiful. Several production units are engaged in making various types of sulphur materials such as sulphur coated urea, whose local name is Sari fertilizer, etc.
The 200 private fertilizer manufacturing units employ some 40 000 workers, directly or indirectly. However, the total number of plants that have good production capability, with an annual production capacity of a hundred thousand tonnes of quality fertilizers, does not exceed five in all, the others being small-scale producers. Total production from the sector reaches only about 0.5 million tonnes annually. Due to unstable demand and purchasing programmes, many manufacturers are facing problems with production and schedules.
In view of these problems, in 2001 the Organization of Professional Fertilizer Producers (OPFP) was established at the initiative of some active manufacturers. The objective is to coordinate and direct the members' activities so as to meet the demand quantitatively and qualitatively. At present some 80 percent of the manufacturers claim membership of the organization.
The total production of mineral fertilizers between April and September 2004 by all production units amounted to 1 314 thousand tonnes (Table 8). Of this total, 979 thousand tonnes were produced by the state-owned industries, a reduction of 5 percent compared with last year. The private sector produced 336 thousand tonnes, an increase of 28 percent in comparison with last year.
In 2004, 57 percent of mineral fertilizers, 80 percent of pesticides, and 100 percent of seeds were produced nationally, by both the public and private sectors.
TABLE 8
Production of mineral fertilizers, April to
September 2004
|
Fertilizer |
Production ('000 tonnes) |
|
|
2003 |
2004 |
|
|
Urea |
777 |
758 |
|
Ammonium phosphate |
151 |
123 |
|
AN |
103 |
90 |
|
AS |
13 |
8 |
|
Different fertilizers |
261 |
335 |
|
Total |
1 304 |
1 314 |
Source: Ministry of Commerce, 2004.
Figures 8 and 9 show trends in fertilizer consumption during the past four decades.
TABLE 9
Fertilizer use by agro-ecological zone,
2001/02
|
Zone
|
Thousand tonnes product
|
|||
|
Number |
Name |
Irrigated |
Rainfed |
Total |
|
1 |
Central |
239 |
61 |
300 |
|
2 |
Caspian Coastal Plain |
262 |
107 |
369 |
|
3 |
North Western |
264 |
183 |
447 |
|
4 |
Central Zagros |
323 |
101 |
424 |
|
5 |
Khuzestan |
228 |
78 |
306 |
|
6 |
Arid Central |
239 |
63 |
302 |
|
7 |
Southern Zagros |
353 |
108 |
461 |
|
8 |
Southern Coastal Plain |
41 |
10 |
51 |
|
9 |
Arid Southern |
211 |
44 |
256 |
|
10 |
Khorasan |
278 |
84 |
362 |
| |
Total |
2 437 |
839 |
3276 |
FIGURE 8
Trends in fertilizer consumption changes
during the past four decades
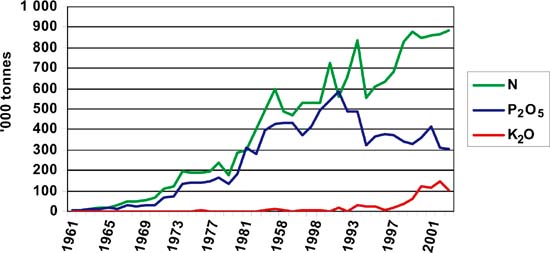
The improvements in fertilizer use are recorded in Table 10.
The development in recent years of the importation and consumption of potassium fertilizers, starting from almost zero, may be noted.
The predicted fertilizer use in 2004/05 is shown in Table 11.
Domestic fertilizer production cannot meet the total demand (Table 12). Additional supplies are provided by imports by the private sector. For example, in the period from April to September 2004, imports by the private sector amounted to 275 thousand tonnes, of which 198 thousand tonnes were compound fertilizers and 52 thousand tonnes phosphate fertilizers. Based on the research carried out, the annual fertilizer needs in the country for the next 15 years is calculated and shown in Table 13.
FIGURE 9
Increasing fertilizer use in Iran since
1961
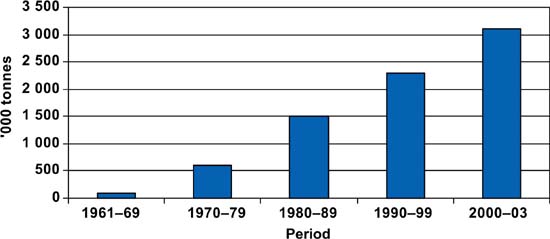
TABLE 10
Fertilizer use trends ('000
tonnes)
|
Fertilizer |
1991 |
1999 |
2004 (forecast) |
|
Urea |
920 |
1 372 |
1 727 |
|
AN |
120 |
158 |
175 |
|
AS |
12 |
28 |
150 |
|
Ammonium phosphate |
1 020 |
371 |
413 |
|
TSP |
- |
324 |
350 |
|
Potassium sulphate |
- |
128 |
150 |
|
MOP |
- |
85 |
100 |
|
Sulphur coated urea |
- |
4 |
20 |
|
Ammonium phosphate sulphate |
- |
- |
300 |
|
SSP |
- |
- |
80 |
|
Microbial phosphate fertilizer |
- |
- |
10 |
|
Golden bio-phosphate |
- |
- |
10 |
|
Compound macro-fertilizer* |
- |
4 |
200 |
|
Sari fertilizer |
- |
- |
15 |
|
Organic granulated sulphur |
- |
- |
50 |
|
Zinc sulphate and other fertilizers |
- |
- |
30 |
|
Total |
2 072 |
2 470 |
3 780 |
|
N:P2O5:K2O+ micronutrient % |
100-76-00+0 |
100-44-15+0.8 |
100-50-15+1.5 |
* The formula for compound macro-fertilizer is 15-10-15+1 percent Zn.
TABLE 11
Forecast fertilizer use in
2004/05
|
Type |
('000 tonnes) |
|
Urea |
1500 |
|
AN |
150 |
|
AS |
150 |
|
DAP |
350 |
|
TSP |
300 |
|
SSP |
100 |
|
Golden biophosphate |
25 |
|
P-solubilizer phosphate |
50 |
|
15-10-15 + 1 percent Zn1 |
600 |
|
15-10-15 + 1 percent Zn2 |
125 |
|
Compound (fertigation) |
25 |
|
S coated urea (SCU) + 1 % Zn |
50 |
|
SOP |
200 |
|
MOP |
250 |
|
Bio-organic sulphur |
150 |
|
Zinc sulphate (granular) |
30 |
|
Zinc sulphate (powder) |
20 |
|
Potassium magnesium sulphate |
20 |
|
PGPR & other biofertilizers |
20 |
|
Other micronutrients |
85 |
|
Total |
42003 |
1 On MOP basis
2 On SOP basis
3 Plus 500 000 tonnes of organic fertilizers
TABLE 12
Projected demand and supply of fertilizers in
2004/05, ('000 tonnes)
|
Fertilizer |
Demand |
Domestic production |
Public imports |
Total |
|
Urea |
1 888 |
1 430 |
211 |
1 641 |
|
AN |
215 |
180 |
- |
150 |
|
AS |
148 |
20 |
56 |
76 |
|
DAP |
413 |
280 |
- |
280 |
|
TSP |
423 |
5 |
238 |
243 |
|
SSP |
80 |
40 |
- |
40 |
|
Potassium sulphate MOP |
200 195 |
- |
53 63 |
53 63 |
|
Potassium nitrate |
5 |
3 |
- |
3 |
|
Compounds (crops) |
450 |
5 |
- |
5 |
|
Compounds (orchards) |
45 |
1 |
- |
1 |
|
Compounds (irrigation) |
5 |
10 |
- |
10 |
|
Zinc sulphate powdered |
50 |
4 |
- |
4 |
|
Zinc sulphate granulated |
20 |
5 |
- |
5 |
|
Sulphur coated urea |
20 |
1 |
- |
1 |
|
Magnesium potassium sulphate |
5 |
15 |
- |
15 |
|
Granular organic sulphur |
53 |
2 |
- |
2 |
|
Microbial phosphate |
5 |
- |
- |
- |
|
Azotobacter inoculant |
2.5 |
1 |
- |
1 |
|
Chickpea Rhizobiuminoculant |
0.02 |
0.02 |
- |
0.02 |
|
Bean Rhizobiuminoculant |
0.02 |
0.02 |
- |
0.02 |
|
Total |
4 220 |
2 222 |
621 |
2 843 |
Source: Ministry of Commerce, 2004.
TABLE 13
Fertilizer demand and forecasted requirements
up to 2017/18, ('000 tonnes)
|
Fertilizer |
Nitrogen |
Phosphate |
Potash |
Sulphur |
Micro-nutrient |
Total1 |
|
2003/04 |
2 400 |
840 |
470 |
50 |
100 |
3 860 |
|
2004/05 |
2 600 |
900 |
500 |
100 |
100 |
4 200 |
|
2005/06 |
2 600 |
900 |
500 |
125 |
125 |
4 200 |
|
2006/07 |
2 700 |
950 |
550 |
125 |
125 |
4 400 |
|
2007/08 |
2 800 |
950 |
550 |
150 |
150 |
4 600 |
|
2008/09 |
2 800 |
950 |
550 |
150 |
150 |
4 600 |
|
2009/10 |
2 900 |
1 000 |
600 |
200 |
150 |
4 850 |
|
2010/11 |
2 900 |
1 000 |
600 |
200 |
150 |
4 850 |
|
2011/12 |
3 000 |
1 000 |
600 |
250 |
150 |
5 000 |
|
2012/13 |
3 000 |
1 000 |
600 |
250 |
150 |
5 000 |
|
2013/14 |
3 100 |
1 000 |
600 |
300 |
200 |
5 200 |
|
2014/15 |
3 200 |
1 000 |
600 |
300 |
200 |
5 300 |
|
2015/16 |
3 300 |
1 000 |
600 |
300 |
200 |
5 400 |
|
2016/17 |
3 500 |
1 100 |
700 |
400 |
200 |
5 900 |
|
2017/18 |
3 600 |
1 100 |
750 |
500 |
250 |
6 200 |
1 Excluding organic and biological fertilizers, estimated annual use about 500 000 tonnes.
In Iran there are no reliable records of the amount of fertilizer used by each individual crop, apart from wheat. The total amount of fertilizer used by province is known. Also the amount of fertilizer used on wheat is known. Based on this information, estimates of fertilizer use in 2001/02 on wheat, orchards and other crops are given in Table 14.
TABLE 14
Annual fertilizer use on different crops in
2001/02 (%)
|
Fertilizer |
Wheat |
Other crops |
Orchards |
Others |
|
Nitrogen |
43 |
40 |
15 |
2 |
|
Phosphate |
42 |
41 |
15 |
2 |
|
Potash |
24 |
59 |
15 |
2 |
|
Macronutrient |
40 |
45 |
17 |
2 |
|
Micronutrient |
47 |
47 |
13 |
2 |
|
Total |
41 |
42 |
15 |
2 |
Source: ASSC, 2004; Agronomy Department, 2004.
![]()
![]()
![]()