


To help understand trade's role in contributing to food security and poverty reduction, this chapter begins with an overview of the role of trade in the world economy. We build on this overview to explore how trade patterns are shifting, contrasting the differences between developed and developing countries in international agricultural trade.2
The global economy, including agriculture, is integrating rapidly through trade. At the same time, the exports of developing countries are becoming increasingly diversified, so that these countries are less dependent on agricultural exports than they were in the past. Moreover, developing countries are rapidly becoming their own best markets for agricultural products.
Exports of processed agricultural products are expanding and now account for almost half of global agricultural trade. This phenomenon is being driven by demographic, social and economic trends that are transforming the agricultural and food markets in developing countries. Supermarkets, for example, are rapidly emerging as a major force in developing countries.
The LDCs face particular challenges in world agricultural markets. They are much less integrated into the world economy than are developing countries as a whole, and this feature is particularly striking for their agriculture sectors. As is the case for developing countries as a group, the LDCs have seen their agricultural exports decline as a share of total exports, but their agricultural imports, mostly food, have not fallen as a share of total imports and they now face a large and rapidly growing trade deficit in agriculture.
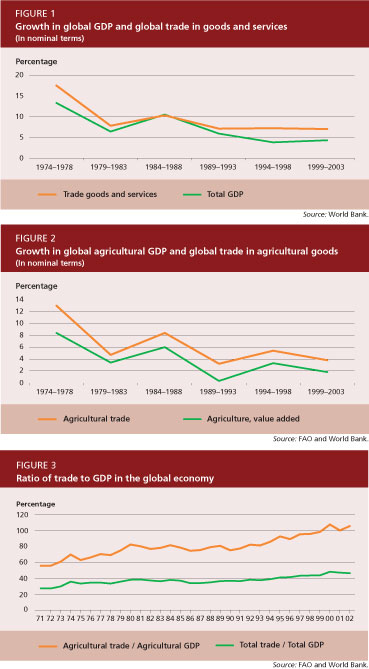
The past several decades have witnessed a dramatic increase in the integration of the world economy through trade. Figure 1 illustrates the average annual growth rates of global GDP and global exports of goods and services. Global trade in goods and services is expanding more rapidly than global GDP.
International trade in agricultural products has also expanded more rapidly than global agricultural GDP, although at lower rates than for overall trade in goods and services and overall GDP (Figure 2). Slower growth in agricultural output and trade reflects the declining relative importance of agriculture in the world economy and in world trade.
The result of the more rapid expansion of trade (exports plus imports) relative to output is illustrated in Figure 3. Trade intensity, expressed as a ratio of total trade in goods and services to total GDP, has increased from less than 30 percent three decades ago to almost 50 percent today. This trend has been even more dramatic for agricultural trade (including fisheries and forestry), which has grown from around 60 percent to more than 100 percent during the same period. The high trade intensity of agriculture reflects the complementary nature of agricultural production in different agro-ecological zones and a high level of intra-industry trade in the sector.
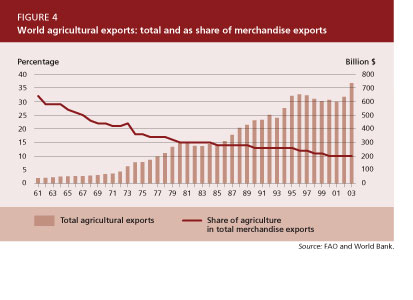
Nevertheless, the increasing importance of agricultural trade relative to agricultural output has not prevented agricultural trade from losing its relative importance as a component of international trade. Indeed, while agricultural trade continues to expand, its share in total merchandise trade continues to fall, from close to one-third four decades ago to around 10 percent today, as seen in Figure 4.
The past four decades have also seen major changes in geographical patterns of agricultural trade. An increasing share of global agricultural exports originates from developed countries. The European Union (EU) countries account for most of this growth; their share of total agricultural exports has increased from slightly more than 20 percent in the early 1960s to more than 40 percent today. A large portion of this increase is accounted for by intra-EU trade, which represents around 30 percent of world agricultural trade.
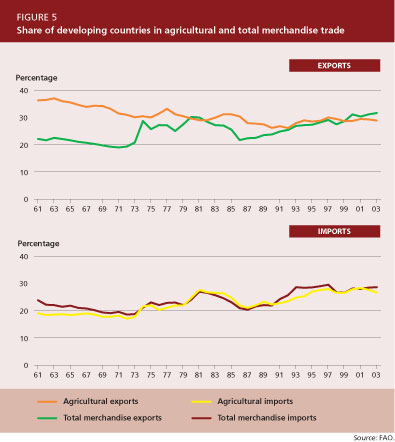
Conversely, during the past four decades, the developing countries have seen their share of world agricultural exports decline from almost 40 percent to around 25 percent in the early 1990s before rebounding to around 30 percent today. This contrasts with the steadily increasing share of developing countries in total merchandise exports. Over this same time period, the share of global agricultural imports purchased by developing countries has increased from less than 20 percent to around 30 percent (Figure 5).
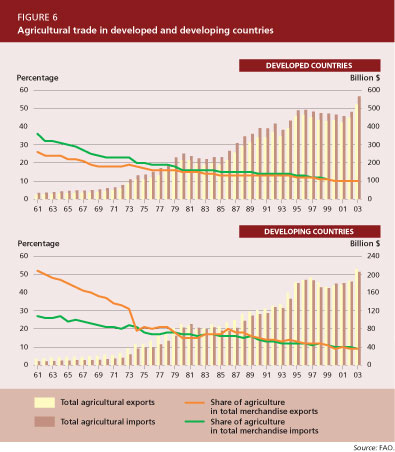
The role of agricultural trade in the overall trade patterns has changed in both developed and developing countries. Over the past four decades, the developing countries have seen a major decline in the share of agricultural exports in their total merchandise exports, together with a slower decline in the share of agriculture in their total imports (Figure 6). They have moved from a positive net agricultural trade position, with exports exceeding imports by a significant proportion, to a situation in which agricultural imports and exports have been roughly balanced in recent years.
Developed countries have seen their share of both agricultural exports and imports decline more slowly over the same period (Figure 6). Today, for both developed and developing countries, agricultural trade is roughly balanced and corresponds to around 10 percent of both total merchandise imports and exports.
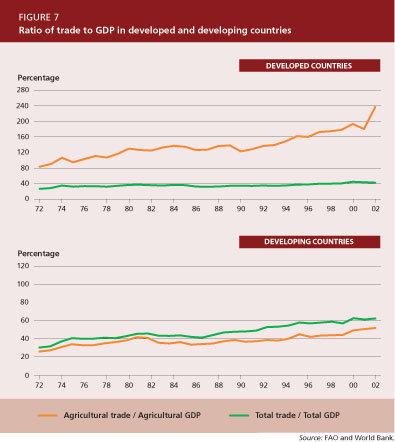
Both the developed and the developing country groups have seen an increasing degree of integration of their agriculture sectors into world markets as expressed by the ratio of agricultural trade (exports plus imports) to agricultural GDP (see Figure 7). This is extremely pronounced for developed countries, due to very high levels of exchange of agricultural products in particular among the EU countries.
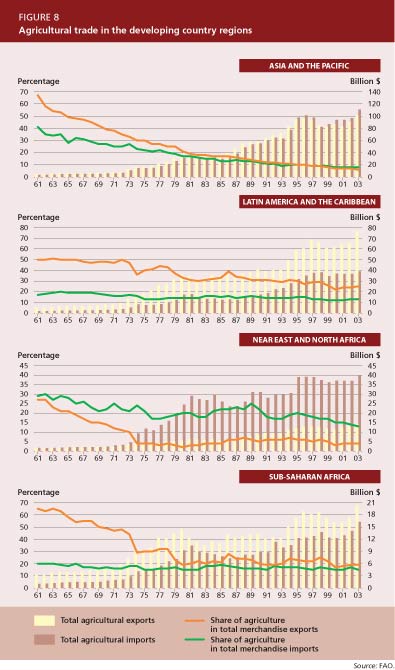
As seen in Figure 8 on page 18, the role of agricultural trade varies among the developing country regions. Only Latin America and the Caribbean region has maintained a strong positive net agricultural exporter position. Indeed, agricultural exports continue to occupy a major share of the region's total merchandise exports, although the share has approximately halved over the past 40 years, from around 50 percent to between 20 and 30 percent in the most recent years.
Sub-Saharan Africa has seen an even sharper decline in the share of agriculture in its exports, from more than 60 percent four decades ago to around 20 percent today. The region remains a net agricultural exporter but with its agricultural imports and exports closer to balance than in the case of Latin America and the Caribbean.
For Asia and the Pacific, both agricultural exports and imports account for less than 10 percent of total exports or imports today; only in the most recent years has the region seen an agricultural net import position.
The Near East and North Africa region is characterized by a significant agricultural trade deficit, which emerged after 1973, as imports expanded rapidly following the oil price boom. Since then, agricultural exports have accounted for at best slightly more than 5 percent of total merchandise exports and agricultural imports now account for around 15 percent of total merchandise imports.
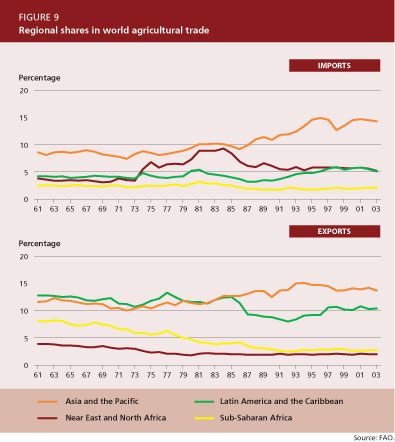
The changes in agricultural trading patterns of the developing country regions are reflected also in their share of international agricultural trade (Figure 9). With the exception of Asia and the Pacific, all regions have seen their share of world agricultural exports decline, although Latin America and the Caribbean region has recaptured some market share in the course of the 1990s.
One of the most striking phenomena evident from Figure 9 is the gradual marginalization of sub-Saharan Africa on international agricultural export markets; the region's share of global agricultural exports has declined gradually from almost 10 percent four decades ago to some 3 percent today. On the import side, the opposite pattern emerges: all developing country regions have seen their share in world agricultural imports increase, with sub-Saharan Africa being the only exception.
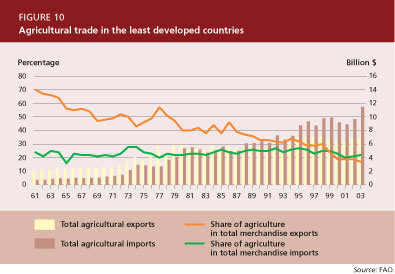
The LDCs represent a particular case in terms of long-term trends in global agricultural trade. The agricultural exports of this group of countries have declined dramatically as a share of their overall exports, while agricultural imports have consistently represented around 25 percent of their total imports (see Figure 10). The LDCs have moved from a position of net agricultural exporters to one of net agricultural importers, and since the late 1980s their agricultural trade deficit has widened rapidly.
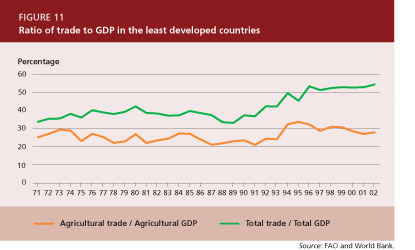
At the same time, the LDCs display a strikingly low degree of integration of their agriculture sector into world markets compared with the developing countries overall (Figure 11 - see also Figure 7). In the mid-1960s, their agricultural trade (exports plus imports) corresponded to slightly more than 20 percent of their agricultural GDP, representing about the same ratio as that of the developing countries overall. Since then, however, the ratio for the LDCs has increased only slightly, to around 30 percent, while for the developing countries overall it has increased to around 50 percent.
There has been a tendency in recent decades towards increased intensity of agricultural trade within regions (Tables 1 and 2).
Within the developed countries, agricultural trade remains largely and increasingly self-centred: some 80 percent of developed country agricultural exports are destined to other developed countries and more than 70 percent of developed country agricultural imports originate in other developed countries.
Particularly significant is the role of trade among EU countries, with more than 70 percent of EU country exports going to, and more than 60 percent of their imports coming from, other EU countries. Agricultural trade among the EU countries represents 30 percent of total world agricultural trade.
Trade between Canada and the United States of America, although much smaller in both absolute and relative terms than intra-EU trade, has grown rapidly since 1980, reflecting the growing importance of the North American Free Trade Agreement (NAFTA), and prior to that the US-Canada Free Trade Agreement, in shaping their trade flows.
In contrast, although agricultural trade among the developing countries has been increasing, particularly during the 1990s, they still depend to a large extent on the developed countries, both as outlets for their agricultural exports and as suppliers of their agricultural imports.
The proportion of developing country agricultural exports going to other developing countries grew from 31 percent in 1990 to 40 percent in 2002, while on the import side the share of developing country imports originating in other developing countries expanded from 36 percent to 45 percent over the same period.
This trend towards increased weight of trade among other developing countries since 1990 is common to all regions and reflects a growing share of agricultural trade taking place within individual regions.
The share of processed products in agricultural trade has been increasing for both developed and developing countries, but remains much higher for the former group (see Figure 12).
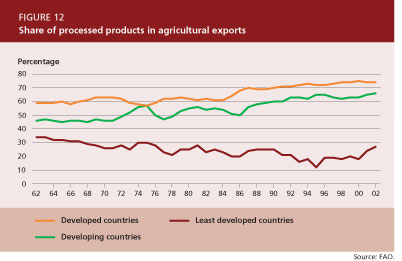
There are wide differences among the developing countries. For the LDCs, the share of processed products in total agricultural trade is significantly lower than for the overall group and has been gradually declining. Only in the second half of the 1990s did the share of processed products in LDC agricultural exports begin to increase.
The rapid growth in processed agricultural trade has less to do with agricultural trade policy reform than with the massive demographic and economic transformations that are sweeping through the developing world. Urbanization, the participation of women in paid employment and rising incomes have increased the opportunity cost of purchasing and preparing bulk foods and help explain the rapid shifts towards processed foods that are occurring in both international trade and domestic markets.
Related to the growth in processed food trade is the rapid expansion of supermarkets in many developing countries. Research suggests that in Latin America, where this trend is most advanced, the quantity of fruits and vegetables purchased from local producers by supermarkets to supply local stores is 2.5 times higher than the total exports of produce from Latin America to the rest of the world (Reardon and Berdegué, 2002).
Many of the supermarkets that are emerging in developing countries are owned by multinational chains based in Europe, Japan and North America. These companies face saturated markets and intense competition in their home markets and they have been attracted by the higher profit margins to be obtained by investing in these new markets. The liberalization of policies governing foreign direct investment in the retail sector has facilitated the trend.
These global chains diffuse management practices that promote efficiency in logistics and inventory management, leading to centralized procurement and consolidated distribution patterns. The organization of retail trade is being transformed in terms of larger volume per supplier, fewer suppliers, the rapid disappearance of small family-owned retailers and a reduction in the role of central markets. A shift is occurring away from traditional wholesalers and brokers towards specialized wholesalers and towards export firms with new domestic market functions. Agrifood market institutions are being affected also, with a rapid rise in private standards and a gradual rise in the use of contracts.
These emerging supermarkets do not cater only to higher-income consumers. In Asia and Latin America, they are expanding into poorer neighbourhoods, smaller towns and rural areas, targeting lower- and middle-class consumers. The purchasing practices of the supermarkets are transforming agrifood markets in developing countries, with important implications for small farmers and rural communities. Fundamental changes in the smallholder farming structure need to occur in order for them to be able to supply according to the supermarkets' standards.
Farmers have to produce what the supermarkets demand in terms of both quantity and quality. They often have to comply with certification requirements that are more stringent than official food safety standards. Meeting the demands of procurement officers requires levels of skill and technology that small farmers often do not have. They may have to invest - individually or collectively - in irrigation, greenhouses, trucks, cooling sheds and packing technologies, among other things. They need to be able to sort and grade their produce, meet timing and delivery requirements, and document their farming practices. In addition, they need to be able to bridge the gap between delivery and payment, which presupposes access to credit.
Downstream, the changes have potential benefits for consumers in terms of greater variety, reduced seasonality and lower prices of food products. In terms of food safety, tracing the source of food contamination has become easier, but there is also a risk that unsafe food that may enter into the food chain is distributed rapidly.
TABLE 1
Destination of agricultural exports by region (percent)
Exporting region |
Year |
Destination | ||||||||
Developed countries |
EU-15 |
Canada and United States |
Countries in transition |
Developing countries |
Asia and the Pacific |
Latin America and the Caribbean |
Near East and North Africa |
Sub- Saharan Africa | ||
World |
1980 |
73 |
50 |
10 |
3 |
27 |
10 |
6 |
8 |
3 |
1985 |
74 |
48 |
15 |
2 |
26 |
8 |
5 |
9 |
3 | |
1990 |
78 |
53 |
13 |
2 |
22 |
8 |
5 |
7 |
2 | |
1995 |
75 |
48 |
12 |
5 |
25 |
11 |
6 |
6 |
2 | |
2000 |
75 |
43 |
15 |
5 |
25 |
11 |
6 |
6 |
2 | |
2002 |
76 |
44 |
15 |
6 |
24 |
11 |
6 |
6 |
2 | |
Developed countries |
1980 |
74 |
53 |
9 |
3 |
26 |
8 |
7 |
9 |
3 |
1985 |
76 |
53 |
14 |
2 |
24 |
7 |
5 |
9 |
3 | |
1990 |
81 |
60 |
11 |
2 |
19 |
7 |
4 |
6 |
2 | |
1995 |
80 |
55 |
11 |
6 |
20 |
8 |
5 |
5 |
2 | |
2000 |
81 |
50 |
14 |
6 |
19 |
8 |
5 |
5 |
1 | |
2002 |
81 |
51 |
14 |
6 |
19 |
8 |
5 |
5 |
2 | |
EU-15
|
1980 |
82 |
76 |
4 |
3 |
18 |
2 |
3 |
10 |
4 |
1985 |
84 |
76 |
8 |
2 |
16 |
2 |
2 |
9 |
3 | |
1990 |
88 |
82 |
5 |
2 |
12 |
2 |
2 |
6 |
2 | |
1995 |
89 |
79 |
4 |
6 |
11 |
2 |
2 |
5 |
2 | |
2000 |
89 |
73 |
6 |
5 |
11 |
3 |
2 |
5 |
2 | |
2002 |
90 |
73 |
6 |
6 |
10 |
2 |
1 |
4 |
2 | |
Canada and United States
|
1980 |
65 |
29 |
14 |
3 |
35 |
13 |
14 |
6 |
2 |
1985 |
67 |
22 |
22 |
1 |
33 |
11 |
12 |
7 |
3 | |
1990 |
70 |
22 |
24 |
1 |
30 |
12 |
10 |
6 |
1 | |
1995 |
67 |
18 |
25 |
2 |
33 |
15 |
11 |
6 |
1 | |
2000 |
67 |
13 |
32 |
1 |
33 |
12 |
14 |
6 |
1 | |
2002 |
65 |
12 |
35 |
1 |
35 |
13 |
15 |
5 |
1 | |
Countries in transition
|
1980 |
89 |
63 |
8 |
14 |
11 |
1 |
1 |
8 |
1 |
1985 |
88 |
58 |
7 |
18 |
12 |
2 |
2 |
8 |
0 | |
1990 |
88 |
66 |
4 |
12 |
12 |
1 |
1 |
10 |
1 | |
1995 |
92 |
44 |
1 |
46 |
8 |
2 |
0 |
5 |
0 | |
2000 |
87 |
39 |
2 |
39 |
13 |
5 |
0 |
7 |
0 | |
2002 |
84 |
40 |
2 |
36 |
16 |
8 |
0 |
8 |
0 | |
Developing countries |
1980 |
67 |
35 |
14 |
2 |
33 |
18 |
5 |
7 |
2 |
1985 |
69 |
35 |
17 |
3 |
31 |
13 |
5 |
11 |
2 | |
1990 |
69 |
33 |
19 |
2 |
31 |
14 |
6 |
8 |
2 | |
1995 |
63 |
28 |
17 |
3 |
37 |
19 |
8 |
8 |
3 | |
2000 |
62 |
25 |
19 |
3 |
38 |
18 |
8 |
8 |
3 | |
2002 |
60 |
25 |
18 |
4 |
40 |
19 |
8 |
9 |
4 | |
Asia and the Pacific
|
1980 |
61 |
24 |
12 |
2 |
39 |
27 |
2 |
9 |
2 |
1985 |
62 |
21 |
14 |
3 |
38 |
24 |
1 |
10 |
2 | |
1990 |
63 |
21 |
12 |
2 |
37 |
26 |
2 |
8 |
2 | |
1995 |
57 |
16 |
12 |
3 |
43 |
32 |
1 |
7 |
2 | |
2000 |
57 |
15 |
14 |
2 |
43 |
32 |
1 |
7 |
2 | |
2002 |
52 |
14 |
12 |
3 |
48 |
35 |
1 |
8 |
3 | |
Latin America and the Caribbean |
1980 |
75 |
44 |
23 |
4 |
25 |
2 |
18 |
4 |
1 |
1985 |
75 |
43 |
25 |
3 |
25 |
4 |
11 |
9 |
2 | |
1990 |
75 |
39 |
31 |
2 |
25 |
4 |
14 |
6 |
1 | |
1995 |
67 |
33 |
27 |
3 |
33 |
8 |
19 |
5 |
2 | |
2000 |
68 |
28 |
30 |
3 |
32 |
7 |
18 |
5 |
1 | |
2002 |
66 |
28 |
28 |
4 |
34 |
10 |
17 |
7 |
2 | |
Near East and North Africa
|
1980 |
72 |
65 |
1 |
5 |
28 |
2 |
0 |
23 |
4 |
1985 |
61 |
44 |
7 |
4 |
39 |
2 |
0 |
35 |
1 | |
1990 |
68 |
51 |
6 |
4 |
32 |
3 |
1 |
27 |
1 | |
1995 |
64 |
43 |
5 |
11 |
36 |
4 |
1 |
30 |
1 | |
2000 |
63 |
42 |
5 |
10 |
37 |
4 |
1 |
30 |
2 | |
2002 |
58 |
38 |
4 |
10 |
42 |
6 |
1 |
33 |
2 | |
Sub-Saharan Africa |
1980 |
85 |
71 |
9 |
2 |
15 |
3 |
0 |
3 |
8 |
1985 |
86 |
71 |
14 |
2 |
14 |
4 |
0 |
2 |
8 | |
1990 |
75 |
67 |
5 |
1 |
25 |
5 |
0 |
2 |
18 | |
1995 |
71 |
59 |
5 |
2 |
29 |
8 |
1 |
5 |
14 | |
2000 |
61 |
46 |
5 |
2 |
39 |
11 |
1 |
8 |
19 | |
2002 |
66 |
50 |
6 |
3 |
34 |
8 |
1 |
6 |
20 | |
Source: UN Comtrade database.
TABLE 2
Origin of agricultural imports by region (percent)
Importing region |
Year |
Origin | ||||||||
Developed countries |
EU-15 |
Canada and United States |
Countries in transition |
Developing countries |
Asia and the Pacific |
Latin America and the Caribbean |
Near East and North Africa |
Sub- Saharan Africa | ||
World
|
1980 |
67 |
36 |
23 |
2 |
33 |
12 |
13 |
2 |
6 |
1985 |
66 |
37 |
21 |
2 |
34 |
13 |
14 |
2 |
5 | |
1990 |
71 |
43 |
21 |
2 |
29 |
11 |
11 |
2 |
4 | |
1995 |
69 |
39 |
22 |
4 |
31 |
13 |
12 |
2 |
4 | |
2000 |
69 |
36 |
20 |
5 |
31 |
13 |
13 |
2 |
3 | |
2002 |
69 |
38 |
18 |
5 |
31 |
12 |
13 |
2 |
3 | |
Developed countries |
1980 |
68 |
38 |
23 |
2 |
32 |
10 |
13 |
2 |
7 |
1985 |
67 |
41 |
20 |
2 |
33 |
11 |
15 |
2 |
6 | |
1990 |
73 |
48 |
19 |
2 |
27 |
10 |
12 |
2 |
4 | |
1995 |
72 |
46 |
19 |
4 |
28 |
11 |
12 |
2 |
4 | |
2000 |
72 |
43 |
18 |
5 |
28 |
11 |
12 |
2 |
3 | |
2002 |
73 |
46 |
16 |
5 |
27 |
10 |
12 |
2 |
3 | |
EU-15
|
1980 |
73 |
54 |
16 |
3 |
27 |
6 |
10 |
2 |
8 |
1985 |
73 |
59 |
10 |
3 |
27 |
6 |
12 |
2 |
7 | |
1990 |
79 |
68 |
8 |
3 |
21 |
5 |
9 |
2 |
5 | |
1995 |
79 |
68 |
8 |
4 |
21 |
5 |
9 |
2 |
5 | |
2000 |
79 |
63 |
7 |
4 |
21 |
5 |
9 |
2 |
4 | |
2002 |
80 |
65 |
5 |
5 |
20 |
5 |
9 |
2 |
4 | |
Canada and United States
|
1980 |
54 |
14 |
29 |
1 |
46 |
10 |
30 |
1 |
5 |
1985 |
57 |
19 |
30 |
1 |
43 |
10 |
28 |
1 |
4 | |
1990 |
60 |
17 |
34 |
1 |
40 |
11 |
27 |
1 |
2 | |
1995 |
59 |
14 |
38 |
1 |
41 |
13 |
25 |
1 |
2 | |
2000 |
61 |
15 |
38 |
1 |
39 |
13 |
24 |
1 |
1 | |
2002 |
61 |
16 |
37 |
1 |
39 |
13 |
24 |
1 |
1 | |
Countries in transition
|
1980 |
68 |
31 |
22 |
8 |
32 |
6 |
19 |
4 |
2 |
1985 |
64 |
28 |
6 |
20 |
36 |
13 |
17 |
5 |
1 | |
1990 |
67 |
43 |
7 |
12 |
33 |
6 |
13 |
8 |
7 | |
1995 |
80 |
44 |
5 |
29 |
20 |
5 |
9 |
2 |
3 | |
2000 |
77 |
35 |
6 |
33 |
23 |
7 |
10 |
3 |
2 | |
2002 |
74 |
38 |
6 |
27 |
26 |
8 |
13 |
3 |
3 | |
Developing countries |
1980 |
62 |
24 |
26 |
2 |
38 |
23 |
9 |
2 |
4 |
1985 |
64 |
23 |
27 |
2 |
36 |
21 |
10 |
3 |
3 | |
1990 |
64 |
22 |
30 |
1 |
36 |
19 |
11 |
3 |
3 | |
1995 |
59 |
18 |
30 |
3 |
41 |
20 |
14 |
3 |
3 | |
2000 |
58 |
16 |
28 |
3 |
42 |
20 |
15 |
4 |
4 | |
2002 |
55 |
12 |
27 |
5 |
45 |
21 |
17 |
4 |
4 | |
Asia and the Pacific
|
1980 |
55 |
7 |
31 |
0 |
45 |
38 |
5 |
1 |
2 |
1985 |
58 |
9 |
30 |
1 |
42 |
34 |
5 |
1 |
2 | |
1990 |
59 |
10 |
32 |
0 |
41 |
31 |
6 |
1 |
3 | |
1995 |
57 |
10 |
31 |
3 |
43 |
31 |
7 |
1 |
3 | |
2000 |
55 |
10 |
24 |
4 |
45 |
32 |
8 |
1 |
4 | |
2002 |
52 |
8 |
22 |
5 |
48 |
34 |
10 |
1 |
3 | |
Latin America and the Caribbean |
1980 |
66 |
22 |
40 |
0 |
34 |
3 |
31 |
0 |
0 |
1985 |
65 |
17 |
45 |
0 |
35 |
3 |
31 |
0 |
0 | |
1990 |
67 |
18 |
45 |
1 |
33 |
3 |
29 |
0 |
0 | |
1995 |
59 |
14 |
42 |
1 |
41 |
3 |
37 |
0 |
1 | |
2000 |
61 |
10 |
48 |
0 |
39 |
3 |
35 |
0 |
1 | |
2002 |
63 |
8 |
51 |
0 |
37 |
3 |
34 |
0 |
1 | |
Near East and North Africa
|
1980 |
69 |
43 |
16 |
5 |
31 |
10 |
8 |
7 |
7 |
1985 |
70 |
42 |
17 |
4 |
30 |
12 |
7 |
8 |
3 | |
1990 |
69 |
41 |
19 |
4 |
31 |
11 |
7 |
10 |
3 | |
1995 |
67 |
34 |
22 |
8 |
33 |
11 |
8 |
10 |
3 | |
2000 |
62 |
29 |
19 |
6 |
38 |
13 |
10 |
12 |
4 | |
2002 |
57 |
23 |
16 |
10 |
43 |
10 |
15 |
14 |
4 | |
Sub-Saharan Africa |
1980 |
70 |
48 |
17 |
0 |
30 |
12 |
5 |
1 |
12 |
1985 |
67 |
47 |
14 |
0 |
33 |
12 |
12 |
1 |
7 | |
1990 |
62 |
53 |
7 |
0 |
38 |
16 |
2 |
2 |
18 | |
1995 |
54 |
40 |
12 |
1 |
46 |
21 |
9 |
2 |
15 | |
2000 |
51 |
33 |
11 |
1 |
49 |
16 |
7 |
2 |
23 | |
2002 |
45 |
27 |
11 |
1 |
55 |
22 |
8 |
3 |
22 | |
Source: UN Comtrade database.
Several key trends in international agricultural trade have important implications for small farmers and the food-insecure. While policy-makers are gradually recognizing these implications, local, national and international policy and programmes need to adapt rapidly if they are to avoid further marginalizing these groups.
2 Agricultural data in this chapter include crops, livestock, forestry and fisheries products in bulk and processed forms.
