


FAO estimates the number of undernourished people in the developing countries at 815 million (Table 10). While two-thirds of the total numbers of undernourished are found in Asia, the highest prevalence is found in sub-Saharan Africa, where 33 percent of the population is undernourished.
These are disturbing numbers given the global community's commitment to food security concerns, its capacity to produce more than enough food for every human being and its power to use modern information systems to pinpoint exactly where food is needed and to mobilize rapid transport systems to move food quickly around the globe.
As discussed in previous chapters, increased openness to international trade is unlikely, on its own, to lead to major improvements in economic growth or poverty reduction, and the same is true for food insecurity. Complementary policies, including public investments in pro-poor growth strategies and safety nets, are crucial if trade liberalization is to support food security strategies. Expanding markets through trade can provide growth opportunities, encourage efficiency, and remove scale and scope constraints in the case of small, low-income economies with limited domestic markets. This chapter examines the issue of food security and discusses how trade and trade liberalization can help promote food security.
Participation in international trade does allow countries access to larger markets for their products. At the same time, it provides access to larger and less-expensive food supplies than if they had to rely on domestic production alone. International trade can also be a powerful channel for technology transfer, without which the prospects for productivity increases are limited significantly.
It is this potential for international trade to promote economic growth, reduce inequality and improve food security that FAO wishes to promote. FAO recognizes that greater participation in international trade is a fundamental component of an overall mix of policies that foster economic growth and reduce poverty and food insecurity.
TABLE 10
Food and hunger indicators by region
East Asia |
Latin America and Caribbean |
Near East and North Africa |
South Asia |
Sub-Saharan Africa |
Developing countries | |
Per capita food consumption (kcal/person/day) | ||||||
1964-66 |
1 957 |
2 393 |
2 290 |
2 017 |
2 058 |
2 054 |
2000-02 |
2 874 |
2 848 |
2 975 |
2 397 |
2 247 |
2 659 |
Millions of people undernourished | ||||||
1990-92 |
275 |
59 |
25 |
291 |
166 |
817 |
2000-02 |
152 |
53 |
39 |
301 |
204 |
815 |
Millions of people in poverty ($1/day) | ||||||
1990 |
472 |
49 |
6 |
462 |
227 |
1 218 |
2001 |
271 |
50 |
7 |
431 |
313 |
1 089 |
Source: FAO, 2003a, 2004b and World Bank, 2005b.
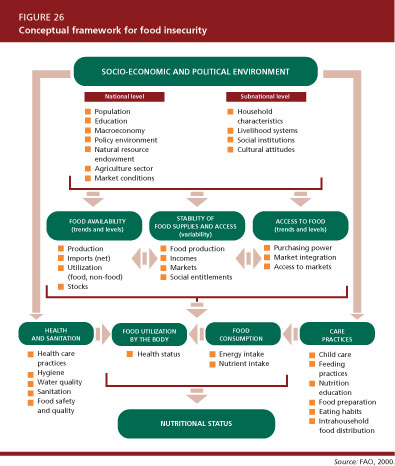
Food security exists when all people, at all times, have physical, social and economic access to sufficient, safe and nutritious food to meet their dietary needs and food preferences for an active and healthy life.
FAO focuses on four dimensions of food security:
Vulnerability refers to the full range of factors that place people at risk of becoming food-insecure. The degree of vulnerability of individuals, households or groups of people is determined by their exposure to the risk factors and their ability to cope with or withstand stressful situations. Food insecurity is a complex phenomenon, attributable to a range of factors that vary in importance across regions, countries and social groups, as well as over time (Figure 26). These factors can be grouped in clusters representing the following four areas of potential vulnerability:
To achieve success, strategies to eliminate food insecurity address these underlying causes by combining the efforts of those who work in diverse sectors such as agriculture, nutrition, health, education, social welfare, economics, public works and the environment. At the national level, this means that different ministries or departments need to combine their complementary skills and efforts to design and implement integrated cross-sectoral initiatives that must interact and be coordinated at the policy level. At the international level, a range of specialized agencies and development organizations must work together as partners in a common effort.
Trade influences these food security dimensions directly and indirectly through both general trade and agricultural trade in particular. For example, to the extent that increased participation in and integration into international trade fosters economic growth, increases employment opportunities and improves the income-earning capacity of the poor and food-insecure, it enhances access to food. In addition, openness to agricultural trade can promote food security by augmenting food supplies to meet consumption needs and reduce the variability of overall food supplies.
Increased integration of international markets has stirred widespread concerns that openness to agricultural trade may jeopardize food security in developing countries. The concern is that exposure to international markets may increase the instability of food supplies and prices, disrupting markets and undermining incentives for local production. Is this fear supported by the evidence?
In Figures 27 and 28, agricultural trade (exports plus imports) as a share of agricultural GDP is plotted against two measures of hunger: (i) the proportion of the population that is undernourished and (ii) underweight prevalence in children under five years of age. Because changes in trade volumes would take time to have an impact on food security, the trade openness measure is lagged by a three-year period. If, indeed, agricultural trade were harmful to food security, then a high degree of agricultural trade openness would tend to be associated with a high proportion of undernourished people in the population. In neither of the two figures is this expectation borne out by the evidence. Without implying any causal relationship, the evidence does not suggest that engagement in agricultural trade is associated with high levels of undernourishment but, rather, the opposite.
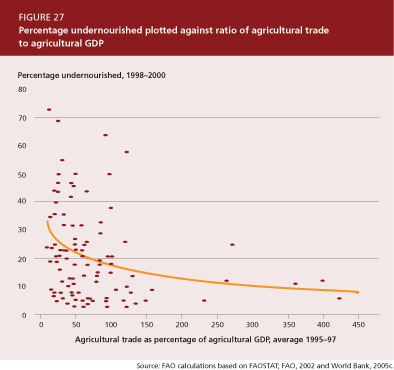
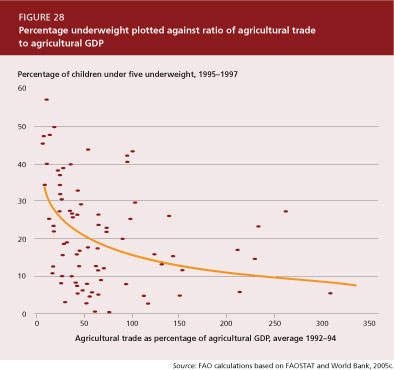
However, another notable point that can be observed in the Figures is the wide degree of dispersion of the data. Each level of trade openness is associated with a wide range of hunger indicators. This suggests that the impact of agricultural trade and trade liberalization on food security is mediated by many other factors, such as markets, infrastructure, institutions and the complementary policy environment in which trade liberalization takes place. The importance of well-functioning markets, in particular, cannot be overemphasized.
The evidence does not point to a negative relationship between agricultural trade and food security; on the contrary, a higher degree of openness to trade is associated with lower levels of undernourishment. While this statement may hold in general, it is also true that some households lose in the process of trade liberalization, leaving their food security compromised. Hence, domestic policy reform must accompany trade reforms to enhance the positive effects of trade and to cushion any negative impacts on the hungry.
As discussed in Chapter 5, economic growth originating in agriculture and coupled with growth in rural non-farm activities can have a strong positive impact on reducing poverty and hunger, provided there is equal access to assets - both private and public assets. Agriculture is crucial. Enhanced agricultural incomes increase demand for non-agricultural goods, providing a boost to non-farm rural incomes and thus broadening income growth in rural areas.
Agricultural trade can contribute to an agriculture-based development strategy and the liberalization of trade in agricultural products can have beneficial effects. Developed countries can contribute by opening up to trade in agricultural commodities and processed agricultural products and by preventing their domestic farm-support programmes from placing subsidized commodities on world markets to the detriment of developing country producers. Developing countries, on the other hand, can ensure that their own trade regimes are as conducive as possible to stimulating growth in the agriculture sector.
The review of the empirical evidence on trade liberalization in Chapter 4 suggests that the largest gains to developing countries tend to come from their own trade-liberalizing measures and domestic reforms. In this respect, it is likewise important to note that the agriculture sector can also be strongly affected by protectionist policies directed at other sectors of the economy, as discussed in Chapter 3.
While agricultural trade can conceivably play an important role in reducing poverty and food insecurity, the precise effects of trade liberalization on food security are nevertheless complex. At a conceptual level, the relationship between trade reforms and food security can be seen in a reform-response-result framework (Figure 29) (FAO, 2003b; Morrison, 2002; McCulloch, Winters and Cirera, 2001).
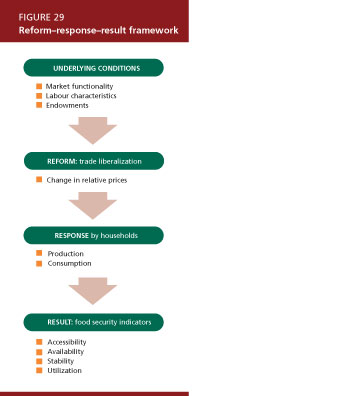
For a given set of underlying conditions, a reform - in this case trade liberalization - changes relative prices. To the extent that prices and hence incentives change, this will elicit a production and consumption response by households. This response determines the household food-security result. Whether this result is a net improvement or deterioration is an empirical question, the answer to which is dependent on the underlying conditions. Underlying conditions can be grouped into three categories: market functionality, labour characteristics and endowments.
Market functionality refers to the prevailing institutional and policy environment, taking into account policy reforms other than the trade reform under way. It also incorporates physical and technical infrastructure such as transport and communication networks. Labour characteristics encompass human attributes, including education, health standards, asset ownership and the pre-existing level of food security. Endowments are a household's material attributes such as natural resources, climate, remoteness, land specificity and geographical proximity to borders. The case of cashew market liberalization in Mozambique (Box 10) illustrates the importance of underlying conditions to the success or failure of liberalization.
BOX 10 Mozambique liberalized its cashew sector in the early 1990s in response to recommendations from the World Bank. Opponents of the reform have argued that the policy did little to benefit poor cashew farmers while bankrupting factories in urban areas. Using a welfare-theoretic framework, McMillan, Rodrik and Welch (2002) analyse the available evidence and provide an account of the distributional and efficiency consequences of the reform. They estimate that the direct benefits from reducing restrictions on raw cashew exports amounted to $6.6 million annually, or about 0.14 percent of Mozambique's GDP. However, these benefits were largely offset by the costs of unemployment in the urban areas. The net gain to producers was probably no greater than $5.3 million, or $5.30 per year for the average cashew-growing household. It was estimated that the loss in real income to urban workers was around $6.1 million, which is roughly equivalent to the direct efficiency gain generated by liberalization. The apparent reason for the failure of the cashew reform was because it paid little attention to some key realities. First, traders and intermediaries rather than poor farmers captured most of the benefits. Second, because the world market for raw cashews is less competitive than that for processed cashews, Mozambique suffered a loss in its external terms of trade. Third, poor political management of the reform undercut the dynamic gains that could have resulted. The key to securing dynamic gains would have been a credible commitment to a new pricing regime - possibly complemented with compensatory programmes - that would have made the costly investments that were necessary worthwhile for farmers, entrepreneurs and workers. Liberalization could have reinvigorated the rural sector by reversing the collapse in cashew tree planting. In the urban sector, it could have heralded a restructuring of production by promoting more rational investment. However, farmers refused to plant trees, cashew processors refused to take their resources elsewhere and urban workers refused to look for other jobs. Source: McMillan, Rodrik and Welch, 2002. |
To the extent that prices actually change following trade reform (see the discussion of price transmission in Chapter 5), a farm household may have different possible supply (production) responses: intensifying or expanding existing production, diversifying or changing the input mix (e.g. using off-farm labour) or continuing production unchanged. Many of the poor and food-insecure are removed from formal market mechanisms; thus, in the absence of policies aimed directly at linking them to markets, they will most likely continue production unchanged. For such households trade reform alone cannot provide any beneficial effects.
The consumption (demand) response determines the food security result through the channels of access, availability and stability. A key question concerning the access channel is: what happens to a household's ability to buy food? This is affected by two indicators: income and the price of food. That is, are households able to produce or earn sufficient income to purchase the food they are unable to grow for themselves?
Availability is needed for households to be able to convert demand to consumption. Increased openness to trade will generally improve links to export markets, which, in turn, can be used to connect isolated rural poor to imported food produce.
Stability can also be affected by trade. A number of empirical studies (e.g. Anderson, 2000) have found that more open trade in agriculture improves price stability rather than aggravating it: if countries want the assurance of stable and predictable food supplies, they should seek more open trade, not more self-sufficiency. More open trade allows food to move from areas where it is in surplus to areas of deficit, and it enhances the capacity for deficit regions to feed themselves, both within and among countries (Runge et al., 2003).
The magnitude and direction of the relationship between trade liberalization and specific situations of food insecurity are empirical questions. While trade openness can contribute to improved food security, trade liberalization also has its costs. The resulting changes in relative prices and reallocation of productive resources can have a negative impact on some households' food security.
Tracing the impact of agricultural trade policy reform on household food security is not easy in practice. Many factors affect the way reforms feed through to the household level and there are likely to be both winners and losers. There are two dimensions to this. On the one hand, different typologies of households in different circumstances are likely to be affected in different ways. For some, the immediate effect of trade policy reform is likely to be beneficial; for others it may be negative.
Another aspect is the time dimension. While trade openness is expected to provide long-term benefits, many households face heavy costs, particularly in the short run. Indeed, policy reform imposes adjustments within countries as the incentive structure in the economy changes and productive factors are shifted towards those sectors in which the country has a comparative advantage.
Facilitating adjustment, while mitigating any adverse impacts on poor and food-insecure households, is a major policy challenge. Policies must be implemented that enhance the capacity of households to respond to the changed incentives. In this regard, access to well-functioning markets is essential - not least well-functioning labour markets. At the same time, compensation mechanisms and social safety nets are necessary to assist the negatively affected vulnerable households.
Trade policy reform offers opportunities to the poor and the food-insecure, but the adjustment process must be managed carefully with adequate protection of the vulnerable and food-insecure. The case studies examined below illustrate this point.
Countries that have liberalized agricultural trade during the last two decades under structural adjustment programmes and the AoA have experienced a range of food security outcomes. FAO recently carried out 15 country case studies18 to examine the impacts of macroeconomic and trade policy reforms on food security (FAO, 2005a). A synthesis of the studies and the main findings are summarized in the following section and policy implications from the perspective of food security are drawn.
The structural characteristics of an economy, the existence and functioning of market institutions and the past policy context have an important bearing on the outcome of reforms and the appropriateness of alternative reform processes in country-specific contexts.
The countries in the FAO study sample are at different stages of development in the transformation from agrarian to industrialized economies. They vary from low-income agrarian economies (e.g. Malawi and the United Republic of Tanzania) with the majority of their populations engaged in agricultural activities, to predominantly middle-income countries with relatively low rural population densities (e.g. Chile and Peru). In the middle-income countries, structural transformations have already reduced the relative significance of agriculture to their national economies, to consumers and to rural incomes. India and, especially, China are special cases in this context because of their very large populations, their distribution between rural and urban areas and the absolute size of their industrial sectors.
Agriculture accounts for more than one-quarter of GDP in 9 of the 15 countries, exceeding 35 percent in 5 of them. Chile and Peru are the exceptions in that agriculture accounts for less than 10 percent of GDP in both cases.
In general, these structural characteristics imply differing impacts of liberalization on economy-wide effects and consumers' welfare, and of trade policy changes on agriculture and the rural population. For the low-income agrarian countries, the impact of agricultural growth, by virtue of the greater importance of the sector at their stage of development, is likely to be much more important for reducing poverty than in middle-income countries. For this latter category of countries, although the incidence of poverty is greater in rural areas, the absolute number of poor is small compared with that in urban areas.
During the 1950s and 1960s, most of the governments of the countries in the sample intervened in their economies with the objective of accelerating the development process through rapid industrialization. The typical strategy pursued was one of import substitution, the counterpart of which in the agriculture sector being food self-sufficiency. In this regard, the countries in the sample pursued policies typical of those discussed in Chapter 3.
The fundamental challenges (and dilemmas) faced were (i) how to provide farmers with incentives to produce (i.e. remunerative and stable prices) while at the same time maintaining low prices of basic foods and agricultural supplies for the non-agricultural population (mainly urban dwellers/consumers) and (ii) how to correct for market failures (including missing markets) in the provision of basic services to the agriculture sector (e.g. regarding credit, essential inputs, technical and market information, and marketing and distribution infrastructure). Most of the governments intervened to influence both output and input prices and to provide basic services to the agriculture sector. In some cases, the intervention covered all agricultural products; in other cases it was confined to strategic products, either for domestic consumption or exports.
From a macro perspective, many of the countries in the sample had experienced periods of relatively rapid economic growth in the 1960s and 1970s before economic deterioration led to the need for policy reforms. The reforms that were implemented were often precipitated by a crisis in the economy signalled by both low growth and serious macroeconomic disequilibria - high inflation, fiscal deficits, current account deficits, and financial sectors in critical trouble associated in part with the foreign debt crisis of the early 1980s. Such constraints induced significant budget cuts generally and, more relevantly for agriculture, specific cuts in subsidized credit, marketing programmes and infrastructure.
In broad terms, the primary objective of the structural adjustment and liberalization programmes was to make domestic agriculture more market-oriented. The principal policy strategy adopted to achieve this objective was reform on several fronts: a reduction in average protection, deregulation, privatization and macroeconomic stability. The most important elements of policy reforms relating to agricultural trade were:
The sequencing and depth of reforms implemented varied across the countries and in some cases there were policy reversals. However, by the early 1990s, tariffs had been substantially reduced in most of the sample countries and were further reduced by 2001 (see Table 11). In the specific case of agriculture, average applied tariffs in 2001 were below 25 percent in all the sample countries except three - India, Morocco and Nigeria. Non-tariff barriers had largely been replaced by tariffs. However, a major issue that remained was the desire of governments to protect their agriculture sectors from world price fluctuations and to counteract export subsidies.
TABLE 11
Average applied and bound MFN tariffs (percent)
Applied MFN tariffs |
Bound MFN tariffs |
|||||
Year |
Agricultural products |
All products |
Year |
Agricultural products |
All products |
|
Africa |
||||||
Cameroon |
1994 |
24 |
19 |
|||
2002 |
24 |
18 |
1998 |
80 |
- |
|
Ghana |
1993 |
20 |
15 |
1995 |
97 |
92 |
2000 |
20 |
15 |
||||
Kenya |
1994 |
43 |
35 |
1996 |
97 |
96 |
2001 |
23 |
19 |
||||
Malawi |
1994 |
31 |
31 |
1996 |
111 |
76 |
2001 |
16 |
13 |
||||
Morocco |
1993 |
29 |
25 |
1997 |
66 |
43 |
2003 |
52 |
33 |
||||
Nigeria |
1988 |
37 |
34 |
1995 |
150 |
119 |
2002 |
53 |
30 |
||||
Senegal |
2001 |
15 |
12 |
1996 |
30 |
30 |
Tanzania, United Republic of |
1993 |
28 |
20 |
1995 |
120 |
120 |
2003 |
20 |
14 |
||||
Uganda |
1994 |
25 |
17 |
1996 |
77 |
73 |
2003 |
13 |
9 |
||||
| Asia | ||||||
China |
1992 |
46 |
43 |
|||
2001 |
19 |
16 |
2001 |
14 |
10 |
|
India |
1990 |
66 |
66 |
|||
2001 |
42 |
32 |
1996 |
115 |
49 |
|
| Latin America | ||||||
Chile |
1992 |
11 |
11 |
|||
2002 |
7 |
7 |
1999 |
26 |
25 |
|
Guatemala |
1995 |
14 |
10 |
|||
2002 |
11 |
7 |
1999 |
51 |
38 |
|
Guyana |
1996 |
23 |
12 |
1998 |
93 |
58 |
2003 |
23 |
12 |
||||
Peru |
1993 |
18 |
18 |
|||
2000 |
17 |
14 |
1998 |
31 |
30 |
|
Source: UN Comtrade database; World Bank/UNCTAD.
The external economic environment of the past 20 years includes a downward trend in the real international market prices of many agricultural commodities, particularly maize, rice, coffee, cocoa, groundnuts and cotton. These declines have, however, been periodically reversed. Some products experienced more price fluctuations than others.
The movements in international prices are the result of many factors. For most tropical commodities, such as coffee, cocoa and tea, supply increases at the global level (due to increased productivity and the emergence of major new producers) have been the principal cause of the downward trend in international prices. However, for basic foodstuffs such as cereals, meat, dairy products and edible oils, which are typically import-competing in the sample countries, depressed international prices were mainly attributable to the high levels of domestic and export subsidies employed by developed countries. The international agricultural markets most distorted by high levels of support and protection included cereals (wheat, maize and rice), sugar, dairy products, meats and oilseeds.
In the absence of domestic policy measures aimed at maintaining agricultural prices, the downward trend in international prices translates to a downward trend in real farmgate prices. This can also apply to semi-tradeable products such as sorghum, millet, cassava and yams, whose prices tend to follow those of the major grains in the longer run.
In some cases, the reforms were associated with increases in most real domestic producer prices (e.g. Guyana, Nigeria, the United Republic of Tanzania and Uganda) in each period of reform. In other cases, there were periods of rising real producer prices and periods in which they fell (e.g. Cameroon and Kenya). In others, the reform periods were characterized by real price declines (e.g. Guatemala and Malawi).
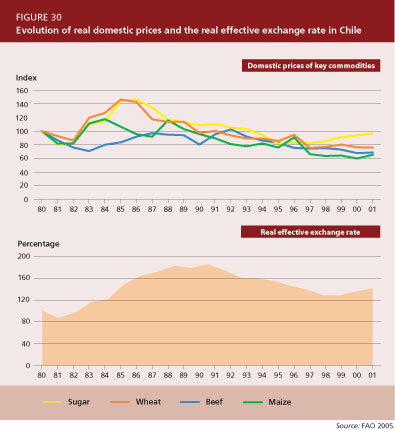
The reasons for this heterogeneity in domestic price responses are complex, but the studies point to a number of key determinants. These can be broadly categorized as those that affect prices at the border and those that modify the price within the domestic economy, whether owing to direct price interventions or to institutional factors. The periods of rising real domestic prices were generally associated with real exchange-rate devaluations. The release of government controls over prices and marketing systems also led to gains in producer prices (especially for export crops) in some cases. On the other hand, import liberalization appears to have contributed to a decline in the real domestic prices of some commodities.
Two examples are illustrative. In Chile, a system of state controls over prices and marketing designed to keep food prices low for consumers was removed and the real exchange rate was devalued. In comparison with the pre-reform period (1964-73), these changes brought about significant increases in real domestic prices of all major farm products, including wheat, maize, beef and sugar, although all those prices exhibited a gradual downward trend during the 1990s. The reforms generally succeeded in improving the transmission of international price movements to domestic prices, with the exceptions of wheat and maize prices owing to the application of automatic adjustments in border protection brought about by the national safeguard (price band) mechanism (Figure 30).
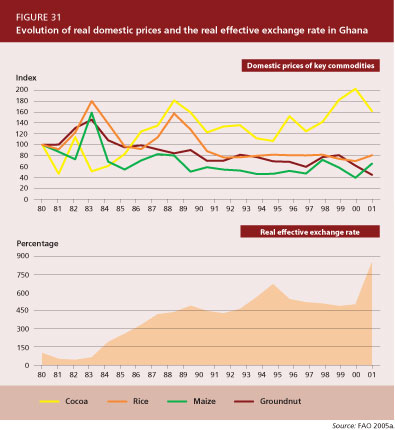
In Ghana, the reforms were associated with declines in real domestic producer prices of import-substituting crops, including maize, rice and yams (Figure 31). The domestic producer price of cocoa, a major export crop, increased. The exchange rate liberalization appears to have benefited cocoa, but as a result of world price trends plus import liberalization, the opposite result occurred for import substitutes.
There is some evidence that output has responded positively to real price increases and negatively to decreases; however, this was not always the case. The pattern of production response was found to be almost identical for export crops and for food crops. Of the 150 episodes for which data on both price and production changes are presented in the studies, in only 66 percent of cases is the response in the direction expected, with 34 percent of cases either reporting an increase in production when prices are falling or a decrease in production in the face of increasing prices. In Kenya and the United Republic of Tanzania, sectoral output fell in spite of real price increases. Malawi and Peru showed the opposite effect of increasing output across a range of products, in spite of declining prices.
Thus, overall, the picture is mixed regarding the apparent output response to price changes. This suggests that although producers respond to a combination of price incentives (determined both internationally and domestically), associated non-price constraints, or the alleviation of these, appear to play a critical role in determining whether a response occurs within the reform period (acknowledging that lags in response may explain in part these unexpected responses) and also the extent of the response.
As with the price changes, there are many reasons for the heterogeneity in production responses. Some have to do with changing world market conditions, as alluded to above. Where export opportunities increase as a consequence of the opening of a previously protected market, export expansion can occur despite falling international prices being more fully transmitted to domestic producers, as a result of concurrent reductions in local export restrictions.
Similarly, increases in domestic prices may not reflect increased farmgate prices, as more powerful actors in the supply chain extract the increased rent associated with an increase in world prices. In other cases, domestic policy and institutional change can help explain the production response. For example, substantial rises in input prices may dampen the potential stimulus of increases in output prices; in other cases the withdrawal of support for rural credit may affect production negatively.
There were significant differences in the relative growth of agricultural exports and imports and, hence, in the direction of change of the ratio of food imports to agricultural exports among the sample countries (Table 12). After a period of strong growth in the first and/or second half of the 1980s, the growth rate of exports declined in the 1990s, falling sharply in the period 1992-97 for all countries except Chile and Senegal. In most cases, this pattern was associated with falling export prices rather than declines in volume.
In some cases not only did the total value of exports expand, but trade liberalization appears to have encouraged a diversification of export products. While the economic significance of traditional, tropical exports continued, there was a notable growth in non-traditional crops (e.g. fruits from Chile and Guatemala, cut flowers and string beans from Kenya or asparagus from Peru). In contrast, food imports generally rose - on average more quickly than agricultural exports in most cases. The net effect on the agricultural trade balance varied across countries.
TABLE 12
Ratio of total value of food imports to total value of agricultural exports
Country |
Average ratio | ||
1970-84 |
1985-94 |
1995-2002 | |
Africa |
|||
Cameroon |
0.2 |
0.3 |
0.3 |
Ghana |
0.2 |
0.4 |
0.6 |
Kenya |
0.2 |
0.2 |
0.4 |
Malawi |
0.1 |
0.2 |
0.2 |
Morocco |
1.3 |
1.1 |
1.6 |
Nigeria |
2.2 |
2.5 |
3.0 |
Senegal |
1.2 |
2.1 |
3.7 |
Tanzania, United Republic of |
0.2 |
0.3 |
0.5 |
Uganda |
0.1 |
0.2 |
0.4 |
| Asia | |||
China |
0.8 |
0.5 |
0.7 |
India |
0.6 |
0.4 |
0.5 |
| Latin America | |||
Chile |
2.8 |
0.2 |
0.3 |
Guatemala |
0.1 |
0.2 |
0.3 |
Guyana |
0.3 |
0.2 |
0.3 |
Peru |
1.2 |
1.9 |
1.4 |
Source: FAO.
In many African countries, food imports have increased not only because of reductions in border measures and exchange rate movements, but also because in the 1990s per capita food production fell in a number of countries (e.g. Kenya, Morocco, Senegal and the United Republic of Tanzania) (Table 13).
The implications of reforms for food security are difficult to gauge directly, and are best captured through a series of indicators that encompass both macro (national aggregate) and micro (household) characteristics. Such indicators can be categorized according to the three main facets of food security: availability, stability and accessibility.
There appears to have been a strong association between per capita food production and per capita availability of nutrients in the 1990s. The per capita food production index increased for 11 of the sample countries, including many significant improvements; however, Kenya, Morocco, Senegal and the United Republic of Tanzania experienced a worsening of this indicator that was particularly severe in the case of Morocco and the United Republic of Tanzania (see Table 13).
Among the countries whose food production index declined, only Kenya escaped simultaneous declines in nutrient availability. In other words, even if foreign exchange per se was not a limiting factor, other factors were evidently at work that prevented food imports from making up the production shortfall. A probable linkage in this regard operates via the effect of production on rural incomes, and the dependence of nutrition on income levels. Lack of sufficient income translates into lack of sufficient purchasing power to induce the marketing system to bring in needed quantities of imports.
The share of food imports in total imports rose in the period after 1995 in all countries in the sample except China, India and Peru (Table 14). A rising trend in this share reflects many factors, including population and economic growth, foreign exchange liberalization and relaxation of trade barriers. However, a rise in the ratio of food imports to total export earnings (goods and services) minus debt service suggests that food security at the national level (as reflected by the capacity to import) has become increasingly compromised. In the period following 1995, this ratio increased for eight of the countries in the sample, but declined for six others; it was particularly high (in excess of 20 percent) for Senegal, the United Republic of Tanzania and Uganda.
Any impact of policy on the availability, accessibility and stability of food supplies at the national level is mediated by a range of institutional and regional parameters that affect what happens to individual households. Trends in household food security can be gauged from data on poverty and estimates of the proportion of undernourished.
Those countries that have experienced relatively strong rates of growth in real GDP per capita and/or in real agricultural value added per capita over the past decade tend to report positive outcomes with respect to the number of people below the national poverty line (see Table 13). However, it should be noted that the reductions in poverty have often varied across regions, and categories of farmers, in these countries.
For those countries experiencing relatively small increases in real GDP over the past decade, the indicators for the poor are generally less encouraging. The case studies suggest therefore that the effects of the policy reforms on rural household incomes tend to depend significantly on the performance of the agriculture sector, including with respect to food production, and the overall response of the economy. This linkage reflects the relative importance of farm, off-farm and remittances in rural household income. In those countries in which the growth indicators, post-reform, were inadequate, there was a greater possibility that poverty would be exacerbated.
In addition to being closely associated with poverty levels, food security is reflected in data on undernourishment. Table 13 summarizes estimates of undernourishment and their trends. For most of the sample countries, the effects of reforms were felt between 1990 and 2001. In 2000-02, the United Republic of Tanzania had the highest prevalence of undernourishment, at 44 percent of the population; however, less than 10 percent of the population were undernourished in Guyana, Nigeria and Morocco and less than 5 percent in the case of Chile.
TABLE 13
Changes in the proportion of the population undernourished,
food production,
rural poverty and economic growth
Proportion of population undernourished |
Change in proportion under- nourished |
Real growth in per capita food production1 |
Incidence of rural poverty2 |
Real growth per capita3 |
||||||
GDP |
Agricultural value added |
|||||||||
1979-81 |
1990-92 |
2000-02 |
1990/92- 2000/02 |
1989/91- 2001 |
Early 1990s |
End 1990s |
1990-2002 |
1990-2002 |
||
Africa |
||||||||||
Cameroon |
22 |
33 |
25 |
-8 |
6 |
59.6 |
49.9 |
-1.2 |
2.0 |
|
Ghana |
64 |
35 |
13 |
-22 |
48 |
63.0 |
49.0 |
1.9 |
0.7 |
|
Kenya |
24 |
44 |
33 |
-11 |
-6 |
46.3 |
59.6 |
-0.7 |
-1.5 |
|
Malawi |
26 |
49 |
33 |
-16 |
67 |
- |
66.5 |
1.1 |
5.1 |
|
Morocco |
10 |
6 |
7 |
1 |
-17 |
18.0 |
27.0 |
1.1 |
3.8 |
|
Nigeria |
39 |
13 |
9 |
-4 |
18 |
48.0 |
76.0 |
0.3 |
0.9 |
|
Senegal |
23 |
23 |
24 |
1 |
-3 |
- |
- |
1.0 |
-1.1 |
|
Tanzania, United Republic of |
28 |
35 |
44 |
9 |
-22 |
41.0 |
39.0 |
1.1 |
0.8 |
|
Uganda |
33 |
23 |
19 |
-4 |
1 |
59.4 |
39.0 |
3.6 |
1.0 |
|
Asia |
||||||||||
China |
30 |
17 |
11 |
-6 |
74 |
32.9 |
3.2 |
8.2 |
2.9 |
|
India |
38 |
25 |
21 |
-4 |
13 |
30.1 |
21.0 |
3.7 |
0.6 |
|
| Latin America | ||||||||||
Chile |
7 |
8 |
4 |
-4 |
25 |
39.5 |
23.8 |
4.2 |
1.6 |
|
Guatemala |
18 |
16 |
24 |
8 |
3 |
- |
- |
1.2 |
0.1 |
|
Guyana |
13 |
21 |
9 |
-12 |
84 |
45.0 |
40.0 |
3.5 |
3.8 |
|
Peru |
28 |
40 |
13 |
-27 |
51 |
70.8 |
64.8 |
1.3 |
2.0 |
|
1 Overall per capita food production growth between 1989/91 and 2001 in constant 1989/91 prices.
2 Percentage of the population below the national poverty line. Starting and ending years differ for countries in the table, but are generally from 1990 to 2001, except for China where the beginning incidence of poverty is for 1978.
3 Average annual percentage.
Source: FAO, 2005a; World Bank, 2005c; FAO, 2003b.
Over the period 1990-92 to 2000-02, FAO estimates of the proportion of the population undernourished declined in 11 of the 15 countries. The only countries for which undernourishment increased significantly were Guatemala and the United Republic of Tanzania. There is a strong correlation between changes in the prevalence of undernourishment during the 1990s and changes in average food availability, and in particular per capita food production (Figure 32 and Table 14).
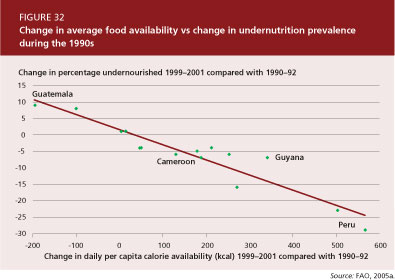
TABLE 14
Per capita availability of calories and protein, 1980/82-1999/2001
Calories (kcal/day) |
Protein (g/day) | |||||
1980-82 |
1990-92 |
1999-2001 |
1980-82 |
1990-92 |
1999-2001 | |
Africa |
||||||
Cameroon |
2 260 |
2 123 |
2 240 |
57 |
51 |
56 |
Ghana |
1 661 |
2 094 |
2 621 |
38 |
46 |
54 |
Kenya |
2 164 |
1 924 |
2 044 |
56 |
51 |
53 |
Malawi |
2 269 |
1 886 |
2 164 |
66 |
51 |
54 |
Morocco |
2 772 |
3 017 |
3 002 |
73 |
84 |
81 |
Nigeria |
2 065 |
2 559 |
2 768 |
49 |
57 |
63 |
Senegal |
2 343 |
2 283 |
2 275 |
67 |
67 |
63 |
Tanzania, United Republic of |
2 186 |
2 078 |
1 970 |
54 |
51 |
48 |
Uganda |
2 139 |
2 291 |
2 371 |
49 |
55 |
57 |
| Asia | ||||||
China |
2 400 |
2 708 |
2 974 |
56 |
66 |
85 |
India |
2 067 |
2 368 |
2 492 |
51 |
57 |
59 |
| Latin America | ||||||
Chile |
2 646 |
2 612 |
2 851 |
71 |
73 |
78 |
Guatemala |
2 332 |
2 352 |
2 160 |
59 |
60 |
55 |
Guyana |
2 517 |
2 350 |
2 536 |
61 |
61 |
73 |
Peru |
2 143 |
1 979 |
2 602 |
55 |
49 |
64 |
Source: FAO.
Within the agriculture sector of each country, reforms affected producers differently, depending upon cropping patterns. Producers of exports generally gained, as did wage-earners in production and processing in the export sector. In contrast, import-competing producers who lost some of their protection were generally adversely affected in the short run. However, their long-run welfare depended on their capacity to increase productivity and/or change cropping patterns. In many cases, farmers had little flexibility to adjust their production and output mix, and as a consequence the losses of this subset of farmers were probably long-term.
Producers of non-tradeable goods were generally less directly affected by trade reform, although they may have been harmed indirectly by consumers switching to lower-priced importables, or may have benefited indirectly from the higher price of exportables where such price rises occurred. Small farmers tend to be producers of non-tradeables, and their household members tend to be relatively more involved in rural non-farm labour. To the extent that increased employment opportunities became available in the rural non-farm economy, small farm households benefited from the reform process. Whether or not greater employment was caused directly by trade liberalization is, however, unclear.
There were also differences in real income effects on urban and rural consumers. It is well known that low-income households - urban and rural - spend a large proportion of their incomes on food. To the extent that trade liberalization lowers food prices, household income of the net-consuming poor may increase in real terms. Certainly, low-income consumers (small farmers are often net consumers too) benefited from trade liberalization as lower protection reduced the price of food relative to wage rates. This is clearly the case for those countries in the sample where farmers are a small proportion of the population (e.g. Chile) and/or most farmers are wage earners. However, where agriculture accounts for a large share of employment and farmers are self-employed, the loss of income for low-income farmers may outweigh any real income effects through the importables in their consumption baskets.
Significant factors that influence the food security outcomes include the infrastructural and institutional context in which agriculture operates, the sequencing of reforms and the consistency of implementation of the reforms.
With the reduction of government controls over prices and marketing systems, macroeconomic reforms and the relaxation of trade barriers, particularly to exports, agricultural price incentives have improved in most, but not all cases in the countries studied. Changes in the real exchange rate, either as a result of exchange-rate policy or of inflation exerted a particularly strong influence on those incentives. When the exchange rate remained at an overvalued level, or appreciated following reforms, agricultural price incentives tended to deteriorate; the opposite was true when exchange rates depreciated.
Improvements in agricultural price incentives have generally led to increases in outputs (in two-thirds of the cases), but other factors dominated the incentive effect in the remaining countries. Withdrawal of available rural credit and a rise in input prices were among the reasons noted for a weak or negative supply response. In many cases also, when institutional reforms were undertaken to reduce government interventions in agricultural markets the private sector was not always fully equipped to replace government activities, resulting in an extended period of incomplete or inadequate services to producers.
Export agriculture has tended to benefit more from the reform packages than have import-competing crop sectors. While a dynamic export sector helps reduce poverty and food insecurity, producers in the import-competing sectors, especially small-scale producers whose assets are inadequate, may suffer losses, particularly when they are unable to switch to alternative productive or employment opportunities.
The rate of poverty reduction depends on aggregate economic performance (i.e. the creation of job opportunities, both on- and off-farm, at a rate that is faster than the rate of population growth). For largely agrarian-based economies, and where poverty is mostly rural, economic performance also depends to a great extent on the performance of the agriculture sector. Through this linkage, improvements in agricultural prices exert a positive effect on reducing poverty.
Food security, however, can be negatively affected by price increases if measures are not taken to ensure that smallholders and other poor rural households benefit in terms of real income improvement from the reform process.
The underlying premise of the domestic and trade policy reforms undertaken by the countries studied was that greater market orientation would improve the sector's performance and ultimately promote poverty reduction and improve food security. The results from the reform experiences of the countries have been mixed. Nevertheless, a number of consistent themes emerged from the case studies.
18 The case studies covered the following countries: in Asia: China and India; in Latin America: Chile, Guatemala, Guyana and Peru; in North Africa and the Near East: Morocco; and in sub-Saharan Africa: Cameroon, Ghana, Kenya, Malawi, Nigeria, Senegal, United Republic of Tanzania and Uganda. For a discussion on the methodology used, see also FAO (2003b, Chapter 11).
