![]()
![]()
![]()
The following document was prepared in conjunction with the Poverty Mapping Project Group (PMPG) of the Food and Agriculture Organization of the United Nations (FAO) and presents a comparative inventory of globally consistent geospatial data resources. The PMPG is involved in two separate but related activities:
The development of a standard set of Core Global Databases (CGDB) for use across all UN agencies in collaboration with the CGDB Task Force (TF) of the United Nations Geographic Information Working Group (UNGIWG).
The development of global GIS databases for the Food Insecurity and Vulnerability Information and Mapping Systems (FIVIMS) Programme, entitled the FIVIMS Global GIS Database (FGGD).
In an effort to respond at least partially to these activities, the PMPG adopted as a baseline the sixteen core data layers which had been identified by UNGIWG in mid-2004 and further categorized them into a topical index covering eight areas of data specialization. In summary, these topical areas included: human population and settlement; human health; transportation; geology/geomorphology; elevation and bathymetry, water resources and hydrology, land use and land cover, boundaries and areas of special interest. Working again from this CGDB-TF baseline, FAO-PMPG further refined the number of CGDB layers required and broadened the topical index to the ten areas inventoried for this report. These ten topical areas represent the minimum baseline for which data will be required to meet the evolving needs of both the FAO FIVIMS-FGGD system and any virtual UN library of CGDB data.
The actual inventory of CGDB data layers presented in this report is based on review of Web sites, geospatial data servers, and on-line searchable metadata databases. This inventory follows in-house inventories: first compiled in the late 1990s; an informal 2002 inventory conducted as part of the FAO African Water Resources Database project; and lastly, a hydrological and base mapping specific geospatial inventory conducted in March of 2003, again for FAO. The primary difference between the inventory presented in this report and these earlier inventories was the requirement to consider each data source identified against a list of CGDB data layers versus a more generalized one focused on globally available data sources.
In order to narrow the results of the inventory, the following two restrictions were applied to the data reviewed and presented. The first of these restrictions was that the data should be globally consistent in regards to the data source, scale, and methods used for data capture or processing. The second restriction considered either: the actual scale of vector data, including a maximum scale of 1:5 000 000 and - given data availability - a minimum scale of 1:250 000; and, for raster data, a maximum nominal pixel size or posting of 5 kilometres but more commonly 1 kilometre. An extensive survey of predominately smaller scale or lower resolution data prepared for the Millennium Ecosystem Assessment can be found at www.millenniumassessment.org.
With respect to globally consistent vector data sources, in comparison with the inventories prepared previously, no substantively new or greatly improved public domain framework databases were identified. Although, some progress has been made for certain continental, regional, and many country specific efforts towards the availability of value-added spatial and attribute data, the absence of improved vector data at the scale of 1:1 million or larger was found to be the norm. On the other hand, in regard to access to global or nearly-global consistent raster data, a comparative wealth of high to medium resolution satellite image and digital elevation modelling data are either already available or are stated to be made available during 2005.
Unfortunately, given the lack of consistent on-line metadata databases and/or data inventories, the tabular inventory presented in this report is likely not exhaustive or complete. Where possible, UN sources for data are specified. However, as particularly for vector data, most of these sources represented either dated or relatively unimproved translations of individual layers from a larger source data library, the latest edition of the source library is included in the inventory instead.
Similarly, in order to further reduce the amount of information presented in the inventory, unless the data reviewed represent significant value-added "editions" of a source database, only the source database or broader data library have been included. In addition, some effort was also made to not include data from the same penultimate sources where possible. For example: the inclusion of data from the 1:1 million Digital Chart of the World (DCW) have in general been replaced or superseded by a discussion of the 1:1 million Vector Smart Map Level 0 (VMap0) data library. The inventory does not cover country and/or project specific data which might be available from sources such as UNEP-GRID, FAO's GeoNetwork, or the regional and country offices of various UN agencies.
The inventory of core data layers has been divided into ten topical subsections: boundaries; human health; human population; transportation; bathymetry and elevation; geophysical; surface hydrology; satellite imagery and derivative land cover; climatic; and agricultural and economic productivity databases. The grouping of the individual CGDB core data layers into the above topical subsections was made in order to categorize the data layers and ease the presentation of the inventory.
Due to time constraints, the Derivative Land Cover subsection of the report is incomplete and the topical section on Agricultural and Economic Productivity, which was to provide a transition to possible future efforts related to FAO’s PMPG, has yet to be fully populated. The topical data sections of the inventory are followed by a brief discussion of Virtual Base Maps and their potential utility to UN as a cost-effective means of providing spatial referencing capabilities for small field offices, field work requiring GPS units, and to facilitate on-line map serving.
Where possible, figures containing map graphics are used to present direct comparisons of the data reviewed for the inventory. An area of north-western Namibia in southern Africa was in most cases used for these comparisons. This area was chosen in order to more realistically assess the quality of data available for developing versus developed countries globally. However, in some cases, more generalized overviews of data were prepared for Africa as a whole or for the area surrounding Mount Kilimanjaro in northern Tanzania.
Lastly, estimates of the level of effort required to translate and conduct any additional processing required to make the source of data identified for the inventory both more accessible and usable by FAO, the UN as a whole and UNGIWG co-operators are provided where appropriate[1].
The requirement to address the availability of data on a layer by layer basis for each of the CGDB core data layers complicated the preparation and format of this report. As an example of this, in order to avoid the duplication of descriptive text, it is in general much easier to: outline an individual data library such as the 1:1 million VMap0; detail any limitations and required processing, and summarize the level of effort needed to complete any processing for the data library as a whole versus on a layer by layer basis. As a means of decreasing the duplication of text, Section 3 of this report contains an overview of specific globally consistent data libraries, i.e. predominately vector databases containing any where from 12 to over 40 distinct data layers. However, even with this overview, the overall length of the report is extensive.
Lastly, because not all of the representational or analytical uses for the CGDB layers contained in the inventory could be anticipated, the premise used for evaluating the data sources identified and determining any levels of effort (LOE) required for processing, was the potential utility of each data layer for supporting poverty and food insecurity mapping, emergency preparedness and response, general base mapping, and then spatial referencing. As the majority of UN organizations seem to have adopted GIS software from the Environmental Systems Resources Institute (ESRI), estimates of any LOE associated with the post-processing of the various data sources, were based at a minimum on the translation of these sources into the ESRI Shapefile, Grid, or Coverage formats.
1.4.1 Summary matrix of Core Data Layers
A matrix ranking the overall utility of the major data sources identified for the inventory to each CGDB core data layers is presented in Table 1.3.1. In this matrix, a combination of colour, textual and numerical codes are used to define and rate the data sources. The rating values listed in the matrix reflect the combined rating of each data source for both the purposes of base mapping and analysis based on an evaluation of its scale, reliability/accuracy, currency, availability, uniqueness, and global consistency. For this reason, data of limited analytical utility might be rated highly based on their suitability for base mapping at one particular scale.
The source data listed in the matrix are representative and do not contain all of the potential data layers identified and discussed under the various topical subsections of the inventory contained in Part Two of this report. To date, almost 40 primary source databases or libraries have been identified as being of intrinsic importance to the inventory of core data layers. The matrix presented in Table 1.3.3 contains an evaluation of 22 of these databases or libraries.
As will be discussed in Section 3, the U.S. National GeoSpatial-Intelligence Agency (NGA) Vector Smart Map Level 1 (VMap1) 1:250 000 source data library is not listed in the matrix due to the inconsistent global coverage currently available for this data source library. The VMap1 data will, however, provide near-global coverage once the NGA and its partners have declassified and released the library in full to the public. Although not listed in the matrix, it should be noted that for regional and country based areas of interest where the VMap1 does provide complete coverage, see Figure 3.41, this data library currently provides the highest resolution source of vector data available within the public domain.
Summary Matrix Rating the General Utility of Globally Consistent Databases by CGDB Core Data Layer
The following section provides a brief description of certain terms as they are used specifically in this report. This section does not represent a GIS primer, but is rather used as a mechanism to introduce certain key concepts and to avoid the duplication of descriptive text during the presentation of the inventory.
Many of the points raised in this report are centred on a discussion of data which are, at a minimum, consistent globally as to the scale or pixel size - resolution - used to represent the features contained within each dataset presented or reviewed. Although these scales and resolutions may represent data which have been generalized from a more detailed source, in most cases these terms are used to reflect the relative level of source detail from which the data were captured, sensed, or generated. When referring to such terms in this report, the terms: larger scale or higher resolution will invariably be used to reflect a greater level of detail; and smaller scale a relatively larger area and less detail.
A wide variety of data from multiple sources are discussed in this report. In order to avoid confusion, two broad classifications are used. The first classification is the simplest and includes datasets and data layers. These two terms are used interchangeably to denote a single topical grouping of data, e.g. roads, that is consistent in regard to the scale and the type of features, i.e. points, lines, polygons, or pixels, used to depict the data. Because numerous datasets are often layered in a GIS to create thematic maps, datasets can also be referred to as layers. Similarly, a roads dataset may only be one layer in a broader compendium of spatial data including political boundaries, rivers, population centres, etc. Such compendiums are often referred to as a library or more generally a database. The terms library and database are again used interchangeably in this report.
The term library may also however, refer to a particular format used to organize data for retrieval and distribution. A discussion of the individual formats used to store and retrieve geospatial information is not provided in this report except as an ancillary discussion regarding any processing which may be required to harmonize and reformat the data. One common data format, or library, used currently to describe vector data is the Vector Smart Map (VMap) standard developed for use by the U.S. military establishment, NATO, and other partners. The VMap standard is based in the Vector Product Format (VPF) which will again not be described in this report other than to point out that the VPF format for data storage, retrieval, and documentation specifically uses the term library in its description of data entitled with the VMap acronym or released under the VPF format. In this report, any data identified by either the VMap acronym or as conforming to the VPF format/standard, the term "library" will also be used to denote the fact that multiple data layers will be available under the topical data indexes for each VMap tile.
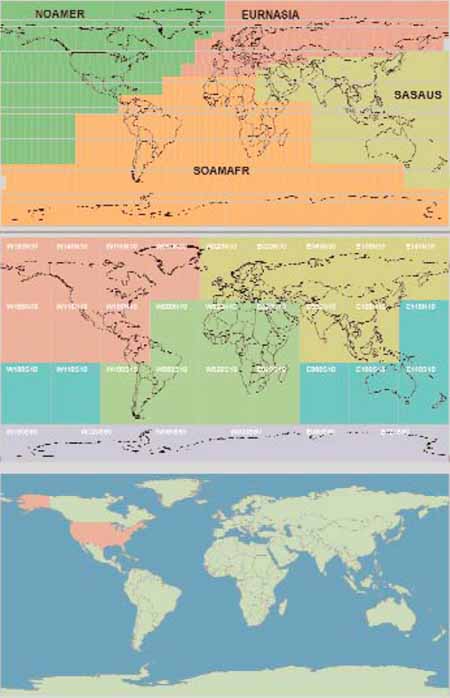
Perhaps, one of the chief problems users will encounter when attempting to access seamless datasets for country, regional, or continentally specific analyses will be the tiling inherent in many of the reference data available for their area of interest (AOI). Tiling can take on many forms and is commonly used to break large datasets, in particular raster data, into smaller more manageable units for access and delivery. Figure 2.3 below shows the tiling used for three different databases, the VMap Level 0 1:1 million vector database, the GTopo30 raster DEM database, and a Gazetteer database organized on a country by country basis. The colour shading on this figure represents the actual CD-ROM compilations used to deliver the individual tiles of the various source databases.
From a post processing standpoint, the tiling of either the raster or the point databases - as shown in the bottom two panes of Figure 2.3 - are in general less problematic than those encountered for the linear and polygonal data derived from a vector library as depicted in the top pane. This is because, the linear and polygonal features crossing tile boundaries must actually be segmented or clipped at these boundaries, whereas raster and point features are by definition discrete entities or units.
The term data harmonization, or simply harmonization, is used throughout this report to represent the fairly extensive group of processing tasks which may be required to develop a consistent data layer from within - or possible between different versions or editions of - the layers contained in a specific data library. Such tasks can include the reformatting, edge-matching, and mosaicing of data features necessary to ingest and then integrate "tiled" data for the creation of seamless data layers. More commonly, however, the term can also be used to denote a set of more complex tasks necessary to create a consistent dataset from a variety of topical data layers which may exist in a data library. For example, a VMap library will contain both linear and polygonal representations of coastlines and political boundaries, and the harmonization of the two can result in the correction of errors and omissions between the two. Similarly, in relation again to VMap data libraries, changes in the standard and potential degenerative processing over time, have in some cases led to discrepancies regarding both the inclusiveness and then direct comparison of features between editions. As a result, a harmonization process may be necessary to correct and then create more robust baselines of specific data layers on a layer by layer basis.
Figure 2.3
Organizational or tile layout of VMap0.Ed3/4,
GTopo30 DEM and GEOnet Gazetteer databases
Data legends provide the means to both classify and attractively represent spatial data for the purposes of base mapping at potentially different scales. Although not specifically discussed in the inventory or in estimates of the LOE required to process the source databases identified, the creation of data legends can be extremely time consuming. This is particularly true if multiple attribute fields in the source data need to be considered. For this reason, the consolidation of attributes from multiple source fields is often recommended if not required. For example, in the case of surface water body data, one attribute might be used to differentiate water bodies from wetlands, and another to classify the perenniality of the feature. In this case, the addition of a single numeric attribute field encoding both perennial and non-perennial water bodies, as well as perennial and non-perennial wetlands would be sensible. The process of attribute consolidation becomes more complex when more than two fields need to be considered. The consolidation of feature attribute codes can also ease the process of creating seamless versions of source databases which employ a tiling structure. However, as this may in specific cases result in the loss of the original separate attribute encoding, such a process should be carefully considered beforehand.
The U.S. National GeoSpatial-Intelligence Agency (NGA) is the base source for many of the datasets and libraries discussed in this report. The NGA, as it is currently entitled, was more recently known as the U.S. National Imagery and Mapping Agency (NIMA) during the mid to late 1990s, and then as the U.S. Defence Mapping Agency (DMA) back through the 1970s, 80s, and early 1990s. Although many of the datasets included in the inventory were released under previous acronyms for this agency, the NGA acronym will be used throughout this report even when referring to data released previously under the DMA or NIMA acronyms.
Many of the source databases discussed in this report have been either produced by or derived from funding associated with the United States Government (USG) including its military and intelligence establishments. Because of this, under the U.S. Freedom of Information Act (FOIA), unclassified data produced using USG public funding are subject to eventual release and public access into what is commonly known as the public domain. In broad terms, data released into the public domain cannot be copyrighted, restricted, or licensed by the USG source entity once it is released. At the most, the USG source entity can charge a cost-reimbursable fee for providing any public access to the data.
Access via the various data servers available across the Internet, have at least for casual users, removed any fee requirement for accessing USG public domain data. However, the United States Geological Survey (USGS) is often the formalized point of distribution and sales on behalf of such USG entities as the NGA. In general, when access to the full source data, including the most up-to-date revisions and any data newly released into the public domain, is required the USG sale outlets such as the USGS Store will likely represent the best option instead of on-line servers.
Regarding non-fee based access to and the distribution of USG source data, one of the key issues is the "clear" release of a data library or archive, in toto, into the public domain. Historically, the declassification of individual data tiles on a selective basis and any invested commercial or non-USG contribution regarding the generation, content, or processing of source data have contributed in some cases to the slow release of certain data into the public domain. Classic examples of this would include the selective declassification and release of the tiles associated with the VMap Level 1 (VMap1) 1:250 000 vector data libraries and commercial partnerships in the LandSat satellite image programmes, which introduced licensing fee requirements and prohibited the onward distribution of these data.
Fortunately, once data are "clearly" released into the public domain, such data can be distributed unencumbered by restrictions. That is, unless, the data were accessed via a commercial entity that as "repackaged" the data and can thus claim copyright to even raw unimproved USG source data. Essentially, both private and commercial entities can use copyright to protect even public domain data if they have either: facilitated a user's access to the source data; or more commonly, to protect any value-added investment made in direct translations or derivative products.
Copyright is a legally-defined publishing term, and is used to protect the rights of authors as well as distribution agents to published works. Data are also protected under copyright law, and although a formalized registration of copyright can be filed with various international bodies, the minimum that is required from an author's or distributor's standpoint is that they publish their data. This can be accomplished through a variety of means, but the essential requirement is that the end user be notified of the copyright claim. Usually this is done using verbiage and the addition of the © symbol followed by the date of publication. For electronic data, such a claim is most often included in an End User License Agreement or EULA.
A EULA can be used to both grant and limit each individual user's specific rights to the data, and can include uses not stipulated in the agreement. In respect to USG public domain data, an important consideration is whether these data were sourced from a private or a commercial entity, as such an entity can claim copyright and thereby potentially restrict the forward distribution of both the source and any derivative data. Effectively, these data have been removed from the public domain, irrespective of the level of any value-added content or processing. Further, based on the EULA, licensing fees and further restrictions may apply if multiple users require access to the data, and can be extended to include both derivative digital products and hardcopy maps published or used in reports.
Copyright and EULAs do not of necessity always restrict the rights of end users and can in fact be used to help prevent the direct repackaging of public domain data for commercial uses. Although such prevention is not open to USG institutions in relation to public domain data, UN Organizations and private entities have a number of options open to them to protect both the original source data and value-added derivatives based on USG public domain sources.
A General Public Licence (GPL) is the digital publishing standard used to publish LINUX and GNU source code. GPL allows users to do whatever they wish with derived software, data, or products as long as they “explicitly and obviously” pass on the right for others to do likewise. GPL helps to prevent the direct repackaging and copyrighting of “public domain” software and data for profit.
Another method for potentially restricting the commercial repackaging of data is the copyright and publication of the data under a fair quotation EULA. With a fair quotation EULA, users are granted the right to distribute source and derivative data, possibly including published map products, as long as the original EULA and metadata which accompany the distribution have not been revised. Depending on the verbiage contained in the EULA, fair quotation can also extend to the direct citation of the source data when used - even in part - for inclusion in derivative datasets or in the production of map products, graphics or reports. An example of a fair quotation EULA for a commercial "product", would be those covering at least some of the data contained in the ESRI Data & Maps CD-ROM series. These data are provided by the company as a "lost leader" data product and are distributed along with the commercial distribution of certain GIS software packages. ESRI grants users of data from this series the right to use, distribute derivatives, and publish these data subject to citing ESRI as the source, in either whole or part, of the data.
Restricted distribution can apply to any data type whether commercial or public domain. This type of EULA description, in general, denotes that the data cannot be distributed in any form by the user. The restriction may also apply to the potential dissemination of the data in house and may extend to the inclusion of the data in hardcopy maps and reports.
For copyrighted public domain data, this type of EULA restriction is generally fairly open and is usually limited to the requirement that each user registers with the source entity originally producing the data. Fortunately, although a restricted distribution EULA does not usually allow currently registered users to distribute the source data, it does not inhibit its use for analysis, map production, or reporting. An example of a restrictive distribution EULA would be that covering the latest edition of the U.S. Oak Ridge National Laboratory's LandScan population data. However, in regards to public data sourced from USG institutions, the use of even such a minimal restriction has not been tested and its continued application is likely open to contention.
On the other hand, for commercially copyrighted data bearing a restricted distribution EULA, the term generally denotes that further licensing fees may apply to any distribution or use of the data by additional users. This restriction will also apply to derivative data based either in whole or part on the original data, and may include the use of the source or derivative data in printed maps and reports.
Restricted access is subject more to an intelligence classification of the source data than to a EULA specifying end-user rights. The term implies that either the data are still classified and open to only approved users, or that the data have not yet been clearly released into the public domain and are accessible to only approved users and/or institutions. Such data cannot be distributed and even derivative data or results might be subject to further restrictions.
Public domain data published with a non-commercial EULA stipulate that the data covered cannot be included as either a part of, or in conjunction with, a commercial data product. This form of copyright/EULA is similar to the Fair Quotation EULA but is generally more stringent. This form of copyright is the one currently favoured by FAO and a number of other non-governmental organizations. Like GPL and Fair Quotation, the purpose of this EULA is to prevent the direct repackaging of data for commercial resale.
It is unclear however, if such a restriction would apply to either private or commercial entities that wish to repackage the source data and distribute it on either a cost reimbursable basis or for only a nominal processing fee (without infringing on, for example, a FAO original copyright), or such entities wishing to translate the data into a different format. For example, the translation of the data from an ESRI format into either the MapInfo format or a different proprietary format for distribution possibly as a lost leader GIS data product, again without infringing on the original copyright. As such translations may help to more widely disseminate data, they should not of necessity be prohibited as long as it is stipulated in the EULA that a copy of any translations be provided back to for example the FAO without any copyright encumbrance.
As a specific non-commercial copyright may also limit the onward distribution of data, the UNCS for example, is not in favour of a EULA stipulating non-commercial use, and will likely adopt either: a fair quotation EULA for the copyrighting of the 1:10 - 1:1 million scale Quick Impact Databases currently under development; or the full and "clear" release of these data into the public domain according to guidelines similar to those governing USG unclassified data.
In order to again avoid the duplication of descriptive text under the data inventory section of this report, the following section has been prepared to introduce the major globally consistent data libraries which are currently either available or under development. Because there is little or no overlap between topical raster databases and the individual core data layers discussed in this report, all of the data libraries discussed in this section are vector based.
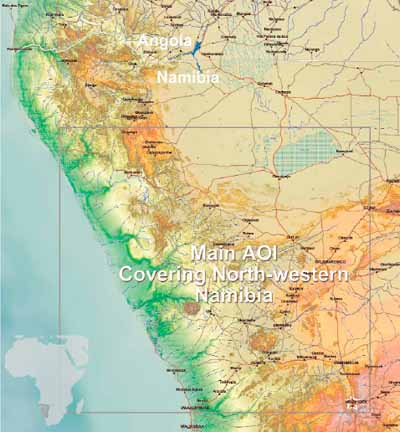
In order to facilitate a direct comparison of data from multiple sources, an area of interest (AOI) centred over north-western Namibia was selected. This AOI is presented in Figure 3.1.
This area was chosen somewhat arbitrarily in order to approximate the general availability of data providing coverage of developing countries. The data in this figure are based on elevation and bathymetric digital elevation models (DEMS) and a subset of the DCW/VMap0 vector data layers compiled for FAO's African Water Resources Database (AWRD). It should be noted, however, that the selection of this AOI may not in all cases allow for either a completely representative depiction or comparison of the data presented in the inventory sections under Part Two of this report.
Figure 3.1
AOI covering north-western
Namibia
Rather broad estimates of the level of effort (LOE) required to produce seamless and for the most part value-added derivative versions of the data libraries are discussed and provided in the following subsections. Additional estimates regarding any LOE specific to a CGDB core data layer are also provided under Part Two of this report, An Inventory of CGDB Core Data Layers.
The LOE estimates provided are intended to be vendor neutral and reflect the minimum effort required to complete the tasks outlined specific to the data under consideration. These estimates are, however, based on direct experience processing data predominately for Africa.
Based on information originally prepared in a printed form for U.S. Board on Geographic Names under the U.S. Department of the Interior, NGA's predecessors prepared extensive gazetteers of named locations outside of the continental US. Although the first digital editions of these gazetteer data comprised a set of CD-ROM disks, i.e. the Digital Interim Geographic Names Data, Series: GAZGN, Item: DIGNAMES, Edition: 002, since the late 1990s, the NGA has opted for an Internet based delivery system regarding the 3.9 million plus named locations in this database. As of December 2004, just over 5.5 million names and alternate names are codified within the GEOnet Names Server (GNS) Database.
Via NGA's GNS server, www.nima.mil/gns/html, users can search for a specific location based on a name refined by: country; a set of nine broad feature classifications; a set of some 450 feature designation codes; and/or some combination of the above. The feature classification set is comprised of: A = Administrative regions; P = Populated places; V = Vegetation; L = Locality or area; U = Undersea features; R = Streets, highways, roads, or railroads; T = Terrain-Hypsographic features; H = Hydrographic features; and S = Spot features. From these and the more descriptive designation codes, users can search for cities, prominent structures, hilltops, mountains, mountain ranges, lakes, the confluence of streams, undersea locations, and a host of other infrastructural, physiographic, political, and cultural feature types.
The GNS database provides the baseline for many, if not all, of the gazetteers available either commercially or from private sources. The full encoding attribution for each location includes: latitude and longitude in degrees:minutes:seconds (DMS) and decimal degrees; diacritical and non-diacritical representations of the name; sort name attributes; two topical feature classifications, e.g. a generalized hydrographic class followed by a specific subclass such as reservoirs; an attribute field, for such data as elevation or census population, which is invariably empty; and, a universal transverse mercator (UTM) map reference.
The positional information for each location was captured from 1:250 000 source maps and was originally reported as DMS of longitude and latitude. Based on previous processing, the accuracy of many locations has been generalized to the nearest minute, leading to a relative accuracy of ±1 800 metres. The accuracy for non-generalized data containing a full DMS coordinate reference would be ±31metres, which belies the minimum 1 mm/250 m accuracy of information captured from the source maps. The database is updated on a continuous basis dependant on NGA priorities. The GNS Web site states that approximately 20 000 of the database's features are updated monthly. However, the frequency for low priority countries or areas can be measured in decades rather than years.
According to information available from the United Nations Group of Experts on Geographical Names (UNGEGN) Web site, the GNS data source along with the currently limited sets of country specific gazetteer information available from National Mapping Authorities (NMAs) will form the cornerstone of a global gazetteer database envisioned for the UN. A fairly refined example of the GNS database being accessed on a selective basis for the retrieval of specific named locations can be seen at the Alexandria Digital Library Gazetteer Server www.alexandria.ucsb.edu. This type of query based retrieval provides an excellent resource for the spatial referencing of individual locations, but is not suitable for specifying either an analytical AOI or the generation of base maps meeting specific user requirements.
In the past, the NGA has considered full ASCII data "dumps" of the GNS gazetteer to organizations on a case by case basis and more recently has facilitated FTP access to both the full database and selected country updates in ASCII format. A complete updated version of the GNS database is posted by NGA to the FTP site monthly and given pre-existing processing routines, the initial level of effort (LOE) required to reformat the full global GNS data into a generic GIS Shapefile format based on country and then continental composites is seven days. Considering previous processing of this database for continental landmasses it would be expected that the LOE could be broken down to include the following tasks: the attribution of a field encoding whether any generalization }to the nearest minute of latitude/longitude occurred; an evaluation of errors previously noted, i.e. whether locations lying between -0.015 decimal degrees of either the Equator and/or the Prime Meridian have still been shifted into a positive coordinate space; and a more complete review of any quantitative attributes, e.g. population estimates, contained in the database.
The LOE for the creation of semi-automated processing routines to accommodate updates on a monthly basis can be estimated at three days. The correction of duplicate or incorrectly attributed place names contained in the GNS database is not, however, addressed in the above levels of effort.
With the exception of the US, Europe, and a number of other data sources available from the NMAs of predominately developed countries, the NGA's Vector Smart Map Level 1 (VMap1) 1:250 000 scale vector database represents the largest scale vector data library - which has in part - been released into the public domain. As the VMap1 data are specifically detailed as a potential CGDB core data source of large to medium scale vector data, before proceeding with a discussion of other public domain databases and libraries which provide a more complete global coverage, a brief discussion of the VMap1 data library is appropriate.
The structure of the VMap1 data library is comprised of 12 topical index layers based on the standard Vector Product Format (VPF). This structure is the same as the one used for the 1:1 million scale VMap0 library discussed later under Section 3.6. The 12 topical index layers comprising the VPF format are summarized in Table 3.4.1.
Table 3.4.1
General VMap Level 1 and Level 0 data
library layers
|
VMap Topical Index |
Indicative VMap Data layers |
|
Library Reference |
Linear: Roads, Coast/Shorelines, Political/AdministrativeBoundaries, and Named Locations |
|
Tile Reference |
1 by 1 degree tile boundaries (5 by 5 s for VMap0), Tile descriptive text and annotation |
|
Boundaries |
Barrier lines, Boundaries text, Coastline, Marker points, polygonal and linear Political and Administrative boundaries |
|
Data Quality |
Data quality coverages contain information concerning the quality of data contained within the library. Data quality line, area and text features are included as required to describe the map source data quality |
|
Elevation |
Depth Contours, Elevation Area Data Quality, ElevationContours, Elevation Point Data Quality, Spot Elevations, VoidElevation Areas |
|
Hydrography |
Aqueducts/Canals, Coastal Areas and Islands, Dam LineFeatures, Danger Areas, Danger Point Features, Hydrography text/annotation, Lakes and Reservoirs, Land Subject toInundation, Miscellaneous Points and Lines, Rapids andW aterfalls, Water Courses and Bodies, Wells and Springs |
|
Industry |
Agricultural Structures, Disposal Areas, Extraction Areas andPoints, Industrial Lines, Industry text/annotation,Mines/Quarries, Obstructions, Processing Points, Rigs andWells, Storage Tanks/Points, Towers, Treatment Areas |
|
Physiography |
Bluffs/Cliffs/Escarpments, Cuts-Embankments and Fills,Ground Surface Areas, Land Ice/Glaciers, Landform Areas,Landform Lines, Landform Points, Physiography Data Quality,Physiography text/annotation, Physiography Void Areas, SaltPans Sebkhas Sand Dunes |
|
Population |
Building Area and Point Features, Built Up Area Points,Built Up Areas, Fortification Sites, Huts, Landmark Sites,Parks, Population Text/Annotation, Race Tracks, Ruins |
|
Transportation |
Airport/Airfield, Bridge/Overpasses, Cableways and Lift Lines,Ferries and Fords, Harbors and Ports, MiscellaneousAeronautical, Pier/Wharf/Quay Lines, Railroads and Sidings,Roads, Runway Lines, Runway Points, Sheds, Interchanges, Rest Points, Trails and Tracks, Transportation Data Quality,Transportation text/annotation, Tunnels |
|
Utilities |
Communication Towers and Disks, Pipelines, Power Stations,Power Transmission Lines, Pumping Stations,Telecommunication Lines, Utilities Text/Annotation |
|
Vegetation |
Crop and Grasslands, Firebreaks, Marshes/Swamps, Trees,Forests and Orchards, Tundra, Vegetation Text/Annotation |
Table 3.4.1 presents an indicative list of data layers which can be separated from a VMap baseline dependant on whether the source is a VMap1 or VMap0 library. The primary differences between the two libraries can be attributed to the relative difference in scale, with not only the level of detail changing, but also number of data layers represented and the specificity of encoding used to attribute individual features. Given these differences, with attribute encoding consolidation and the various processes associated with the seamless mosaicing, between 30 and 40 individual topical data layers can be derived from a VMap source data library.
Each VMap1 database encompasses 1° by 1° “tiled” area. To facilitate access to and the delivery of the VMap1 database, a variable number of these VMap1 library tiles have been organized into what can best be described as zones. Similar to the consolidation of VMap0 tiles for delivery onto four CD-ROMs, see Figure 2.3, the number of 1° by 1° degree VMap1 tile libraries and the overall extent comprising each VMap1 “zone” are different. There are 234 of these zones globally and despite NGA's repeated efforts to make the VMap1 data available publicly, only 67 of these zones are currently available for purchase from the NGA's public distribution source via the USGS. Figure 3.4.1 depicts the current and near-term projected availability of VMap1 zones worldwide.
Figure 3.4.1
Public domain availability of VMap1
zones
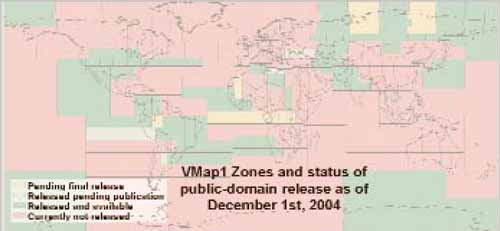
The NGA also distributes individual VMap1 zones via its Internet based GeoSpatial Data Server, however, the availability of the individual VMap1 database "tiles" on this server is not up-to-date, and only 55 of the zones identified via the USGS were available at the time of this review for download. The USGS distributes each VMap1 zone on a single CD-ROM in NGA's VPF format at a cost of US$55 per zone.
East View Cartographic (EVC) was the only value-added distributor of VMap1 data identified during the inventory. The attributes representing the current availability of the VMap1 zones depicted in Figure 3.4.1 were provided courtesy of this company. Based on these attributes it would appear that EVC may have access to VMap1 zones data which are not currently available for purchase from the NGA's public distributor, the U.S. Geological Survey (USGS).
According to pricing available on-line via EVC's Web site, EVC charges US$195 per VMap1 zone. This price should include a derivative translation of these data into one of a number of common commercial GIS formats from the NGA's native VPF format. Additionally, EVC employs a standard price of US$50 per zone if all available zones are procured as a block. Given the availability of VMap1 zones in mid-2004, this equates to a cost of US$3 500 for the 70 VMap1-Zones available from EVC at the time the on-line review of potential data resources was conducted.
Additional volume and other discounts applicable to the UN may also further reduce any up front costs regarding EVC VMap1 derivative data. However, additional licensing fees would also apply to the utilization of these data when accessed by multiple users. Such license fee restrictions would be subject to direct negotiation with EVC, but would potentially be applied on a per organization versus user by user basis. However, EVC has indicated that the company would claim copyright to any data provided, irrespective of whether such data were provided in the original VPF or some derivative commercial GIS format. This copyright would include, at least for the UN, a more favourable EULA, but further licensing fee restrictions would also apply to any derivative data and may negatively affect the UN's onward distribution rights for any data directly sourced from EVC, (ECV, 2004).
A contact name for an officer at NGA who could answer questions concerning the direct access by the UN to VMap1 data for the purposes of emergency preparedness and response could not be established. However, on review, UNGIWG has indicated that it does have such a contact and the UNCS has obtained 65 VMap1 zones courtesy of ESRI in the ArcSDE export format. Although a time frame and distribution format has yet to be established, UNCS plans to make these data freely available once the VMap1 data have been consolidated, (UNCS, 2004a).
Figure 3.4.4 below depicts a comparison of some of the core VMap1 data layers as derived from the VMap1 reference Zone V1-208 providing coverage of the Namibian AOI.
Based on this figure it should be evident that there are internal differences as to the completeness of the data contained between the individual VMap1 tiles compiled for this zone. These differences can in part be attributed to the map sources used within this zone, and then differences in the classification and encoding of features between individual VPF tiles and data layers.
Based on the processing of two VMap1 zones either downloaded from the NGA's GeoSpatial Data Server or purchased on CD-ROM from the USGS, the estimated LOE to conduct a basic and at least intra-zone seamless translation of each VMap1 zone would be 1.5 days per zone. Such a translation would include selected inter-layer data consolidation within each topical VMap1 index, as well as some attribute data encoding consolidation where deemed appropriate and necessary.
Given the limited VMap1 data sample acquired for the inventory, a more robust estimate of the LOE required to conduct additional seamless inter-zone edge-matching, including the consolidation attribute encoding and related data processing tasks, is more difficult to estimate. However a conservative estimate would be 0.5 days per adjacent zone.
Figure 3.4.4
Overview of VMap1 data layers for the
Namibian AOI
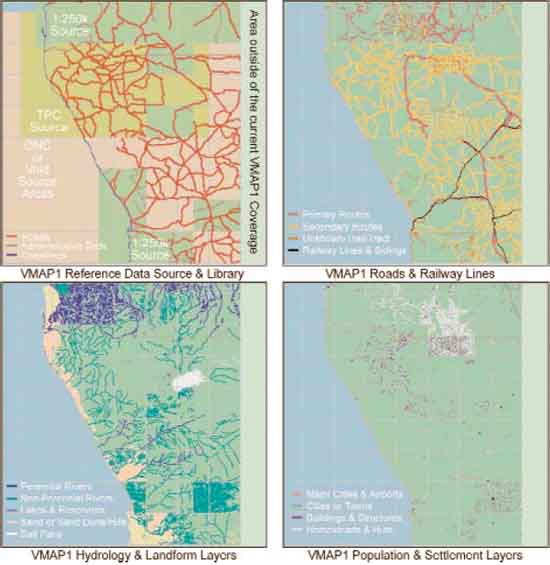
Relative accuracy assessments of VMap1 library features in regards to 1:250 000 or other component source maps could not be determined due to repeated failures to access/download the appropriate VMap1 Mil-Spec, Mil-V-89033, from the NGA. However, based on VPF tables associated with the zone covering at least the Namibian AOI, the absolute horizontal accuracy of VMap1 features is 130 m and the absolute vertical accuracy of contours and related spot elevations is 50 m. Based again on the Namibian AOI, the dates of the source maps upon which the VMap1 data are based varied widely. The range of dates for these source maps was between 1966 and 1991. In addition to the temporal differences, as shown in the upper left pane of Figure 3.4.4, the map sources also varied from the general VMap1 1:250 000 base and included 1:500 000 TPC charts and even 1:1 million ONC charts. Due to this, the horizontal and vertical accuracy will vary from the minimums listed above.
With regard to the maintenance of coordinate accuracy for derivative data, the VPF metadata tables accompanying the VMap1 sample data specify that a tolerance of 0.000005 is required to maintain the accuracy and topological integrity of these data. This indicates that double precision coordinate processing will be required for processing into ESRI's Shapefile or Coverage formats. Further, some degradation of these data would be expected for translations into 8-bit formats such as the original Intergraph/Bentley DGN and earlier MapInfo and AutoCad formats.
The 1:250 000 World Vector Shoreline Plus (WVS+) data library represents what is likely an under utilized source of globally consistent geospatial data lying within the public domain. The WVS+ was derived originally by the NGA in the mid to late 1980s using primarily Digital Landmass Blanking (DLMB) raster data based on a 3 arc second (nominal 90 meter resolution) pixel stepping. Where DLMB data were unavailable, the WVS+ was backfilled with digital data derived from cartographic sources. The original WVS data were processed into NGA's Vector Product Format (VPF) in 1995 and this data library was renamed the WVS+. In comparison with the VMap0 and earlier coarser scale databases, the WVS+ provides the highest resolution demarcation of coastlines that is globally available. This assessment will likely remain true until processing of the full resolution Space Shuttle Radar Topography Mission (SRTM) elevation data (see Section 8.2) can be assessed as a potential source for a more definitive determination of coastlines. The WVS+ library, released in the Spring of 2004 shortly after the on-line inventory was prepared, is currently in its Third Edition.
In addition to the global 1:250 000 coastal baseline, the WVS+ library also includes: five generalized coastline data layers at the scales of 1:1 000 000, 1:3 000 000, 1:12 000 000, 1:40 000 000, and 1:120 000 000; Bathymetric contours at the scales of 1:3 000 000, 1:12 000 000, and 1:40 000 000; a fairly limited marine/oceanic gazetteer; and 1:250 000 country boundaries derived from the Operational Navigation Charts (ONCs), Tactical Pilotage Charts (TPCs), and the Joint Operation Graphics.
According to the WVS+ product specifications and metadata (NGA-WVS+, 2000), the accuracy of WVS+ 1:250 000 data layer requires that 90 percent of all identifiable shoreline features be located within 500 metres (2.0 mm at 1:250 000) circular error of their true geographic positions with respect to the WGS84 datum. An independent assessment conducted in-house by Veridian Corporation, found the WVS 1:250 000 feature offsets to be generally be less than 1/3 of a nautical mile and a review for missing features indicated that the WVS was may be incomplete concerning the identification of very small reefs or rocks, (Viridian, 2004). Because 3 arc second (90 m) stepping of the DLMB raster baseline data becomes apparent at larger scales, the minimum representative scale at which this database is used for the purposes of base mapping should not exceed 1:150 000.
NGA distributes the WVS+ database via the USGS's on-line store at a cost of US$270. However, based on a direct comparison of the WVS+ to data from earlier WVS revisions conducted during the preparation of this report, some point generalisation or weeding was noted within certain WVS+ data layers. Based on this comparison and the processing of the WVS+ data for continental Africa and the surrounding Island States, the estimated LOE required to process the WVS+ data library from the tiled VPF format into seamless datasets would be roughly nine days. Such a processing would also include a harmonization of the extant WVS+ encoding in relation to the ISO standard and encoding based on ongoing UN data efforts.
The Digital Chart of the World (DCW) represents the NGA's first attempt to produce a consistent 1:1 000 000 (1:1 M) scale global geospatial database. The name of this database to some degree reflects the source maps used for the baseline, i.e. the 1:1 million scale ONC charts. Subsequent to the initial release of the DCW, the specification for future editions of the data library was changed by the NGA to the Vector Smart Map Level 0 (VMap0) standard utilizing the VPF spatial data format. As a result of this change, the DCW acronym is most commonly used to denote either the 1992 first edition of the "VMap0" data library or to some degree a commercial version of the database sold and distributed by ESRI.
Together the DCW and VMap0 represent the largest scale multi-theme vector databases that provide consistent coverage of the world’s terrestrial landmasses. The products differ with respect to: the format used to store and distribute the spatial data, i.e. ESRI's coverage format versus the NGA's VPF format; the addition of bathymetric, ocean water body, and a variety of generalized reference layers to the VMap0; the dropping of a formalized gazetteer layer from the VMap0; and, then any updates made to the spatial data features residing in the various library layers of each subsequent edition of the VMap0. In addition to these differences, changes between the two standards have also resulted in variations as to the inclusiveness of certain features encoded for individual layers. For example, certain wetland feature classifications were dropped due to the change in standards.
According to the VMap0 metadata, the database contains more than 1 900 megabytes of vector data organized into ten primary thematic layers. The database includes major road and rail networks, major hydrologic drainage systems, major utility networks (cross-country pipelines and communication lines), all major airports, elevation contours (1000 foot(ft), with 500ft and 250ft supplemental contours), coastlines, international boundaries, and populated places (NGA-VMap0, 1997). The ten primary VPF topical index layers, see Table 3.4.1 above, result in some 30 to 35 individual datasets when seamless datasets are mosaiced and compiled from the VMap0 library.
According to the original ESRI based metadata (ESRI, 1993), the accuracy of the DCW, and by extension the VMap0, would include the following: Horizontal Accuracy, 2 040 metres rounded to the nearest 5 metres at 90 percent circular error, World Geodetic System (WGS 84); Vertical Accuracy, 90 percent linear error, mean sea level; the accuracy of contours collected from ONC source is +152.4 metres; and, the accuracy of spot elevations collected from ONC source is +30 metres. NGA VPF documentation provided with the VMap0 specifies that processing using tolerances less than 0.000005 are required in order to maintain the positional accuracy and topological integrity of VMap0 data. Similar to processing in conjunction with the VMap1 library, this indicates that double precision coordinate geometry is required during any processing or translations into for example the ESRI ArcInfo Coverage format. The minimum representative scale for the vector data contained in either the DCW or VMap0 libraries should not be larger than 1:750 000.
The VMap0 data library is distributed by the NGA via the USGS as a set of four CD-ROMS at a cost of US$100.
The current edition of the VMap0 data library is the Fifth Edition (VMap0.Ed5). This edition was released in the fourth quarter of 2000, indicating that a further revision might again be pending in 2005 or 2006. Because, the fourth edition of the VMap0 was only released for the NOAMER portion of the library, the VMap0.Ed5 represents the first major revision to the library as a whole since 1997. It should be noted, however, that the currency of individual spatial data features contained in the VMap0 is dependant on the date of the cartographic sources which are documented in the Data Quality layer of the library and not the release date for any specific VMap0 edition. Using Africa as an example, the revision dates of the source ONC Charts for the VMap0.Ed5 vary from 1979 to 1989.
A review of the various VPF metadata files associated with the third, fourth, and fifth editions of the VMap0, indicates that the principal differences between the VMap0.Ed5 and earlier VMap0 editions can be summarized as follows:
The tiling structure of the VMap0.Ed5 data library has been changed to a two-tiered tiling scheme where: 15°x15° tiles are used over continental landmasses and 30°x30° tiles are used over oceanic areas. Additionally, the NOAMER and the SASAUS libraries no longer extend across the 180 degree line(s).
Globally, second order subnational boundaries, i.e. states or provinces, have been added based predominately on the supplement to ESRI's ArcWorld database. The ArcWorld database itself was derived principally from WDB2/RWDBII-Sv1.1 database discussed in Section 3.7.
Due to the inclusion of the second order subnational boundaries provided by ESRI and Global Mapping International, the VMap0.Ed5 includes commercial proprietary data which may need to be taken into consideration in regards to the production of certain VMap0 derivatives.
The majority of the names missing or unknown in previous VMap0 editions of the Built-Up Areas polygonal data layer have been updated with a valid name for the VMap0.Ed5.
A name attribute field has been added to the surface water body, river, and canal data layers of the VMap0.Ed5 HYDRO topical index library and names encoded where possible, e.g. surface water bodies (15 percent) and river features (17 percent) based on the original DCW annotation features and either the United States Geological Survey's (USGS) Geographic Names Information System (GNIS) for North America or the NGA's GNS gazetteer for the remainder of the world.
The connectivity of linear road and rail features was reviewed and purportedly updated where necessary for the VMap0.Ed5 to accommodate network/routing operations.
With the exception of North Korea, the Airport data layer of the VMap0.Ed5 was updated based on a January 2000 version of the NGA/US-Department of Defence's Digital Aeronautical Flight Information File.
The vegetation data layer of earlier VMap0 editions was replaced in the VMap0.Ed5 by one derived from 1 km Advanced Very High-Resolution Radiometer (AVHRR) image mosaics, i.e. the Global Land Cover Characterisation Database. These mosaics were then classified using the Anderson-Hardy Land Use-Land Cover classification scheme and then converted into VMap0 equivalent feature codes.
Lastly, the boundaries between polygonal features from selected VMap0.Ed5 data layers were harmonized or made coincident given the following order of precedence: 1) coastline (BND), 2) water body drainage features (HYDRO), 3) built-up urban or peri-urban areas (POP), 4) physiographic features (PHYS), and 5) vegetation(VEG).
Further, in order to facilitate the update and review process for the VMap0.Ed5, the VMap0.Ed3/4 was translated back into ESRI's ArcInfo coverage format and the tiled coverages combined into single continuous coverages across the full geographic extent of the library to facilitate efficient processing. These coverages were later split according to the revised VMap0.Ed5 tiling scheme, and various selective updates made to the individual layers of the VMap0 based on data availability. A direct comparison with the DCW digital baseline was also made to ensure that no major features had been omitted between editions, (NGA-VMap0, 2000).
A comparison covering continental Africa conducted during the preparation of this report, found that the major "Undifferentiated Wetland" feature class - that had been dropped between the original migration from the DCW to VPF standard - was however, still not accounted for in the VMap0.Ed5. Additional comparisons have also shown that the Annotation Layers of the original DCW are in general more robust and useful than the degraded textual labels which can be derived from the VPF format. Given these finding, it would therefore be recommend that the DCW still be considered as the source for processing wetland and annotation feature layers.
Although the NGA refers to the VPF data format as a robust spatial data standard, the International Steering Committee for Global Mapping (ISCGM) and guidelines based on the Global Spatial Data Infrastructure (GSDI) Clearinghouse most often refer to the VPF format as an open spatial data exchange standard. The chief limitation of the VPF format as a spatial data exchange standard however, is the tile structure that divides and effectively segments the features contained in the individual VMap0 data layers. As a result, although data accessed from the "raw" VMap0 may be used to support certain types of cartographic representation, both analytical and query based thematic style base mapping require the further processing of the VMap0 into a more seamless format[2].
In addition to the above limitation, as evidenced by both hydrological and populated place data layers, the extant encoding of the VMap0 does not in all cases capture or allow the subclassification of feature types for the purposes of base mapping or analysis. As a result, the addition of further attribute encoding and classifications based on a composite of the existing codes and attributes would be highly recommended. In the case of certain hydrological data layers, such a consolidation of encoding may also require a harmonization process between both the VMap0 and its antecedent baseline the DCW in order to create a more robust seamless dataset. While for populated places, both the consolidation of VMap encoding and then the further classification of such features based on whether both a valid name has been attributed for a feature, and then whether this attribute uses a full uppercase or only a proper title-case, may also be indicated.
The seamless consolidation, potential harmonization, and then composite value-added encoding of feature data attributes in the VMap0 and possibly the DCW denote the minimum tasks which should be considered regarding the utilization of these data libraries in support of the generalized base mapping and potential analytical tasks envisioned for the FAO-FGGD and any virtual UN database. Specific to any analytical uses of the VMap0 versus improvements undertaken to facilitate basic data retrieval and thematic representation in conjunction with the production of base maps, the chief limitation of both the DCW and VMap0 libraries is the lack of overall connectivity between the linear features representing both roads and rivers. In the case of these features, the nodes representing the end points of lines do not always meet or join cleanly due generally to undershoots. A problem that is further exacerbated for hydrological network type analyses as linear river features do not always connect with water body and wetland linear outlines derived from multiple features based on a variety of the VMap0 data layers.
The lack of overall connectivity regarding specific VMap0 data layers, however, is not in all cases related to limitations with the VPF format. Rather, the issue is often a by-product of the original digitization of layers such as road and hydrological features captured from the source ONC charts. Nevertheless, the combined result of the above limitations is that the linear layers of the VMap0 cannot be used immediately for spatial network types of analysis. In the VMap0.Ed5, the issue of connectivity related to linear transportation network features/layers has purportedly been addressed. However, given the variability and quality of the source data comprising such a network, the direct utility of these data still needs to be verified.
Taking the above limitations under consideration, it is none the less evident that the VMap0 library as a whole is undergoing improvement in slow but steady increments. With the issues of connectivity and feature discrepancies between the original DCW and later editions of the VMap0 in some cases being at least addressed, if not resolved. Due to the steady improvements which are evident with each subsequent edition of the VMap0, the FAO-PMPG and UNGIWG CGDB-TF should establish the timeframe under which the NGA may be releasing the VMap0 6th Edition before undertaking any extensive processing based on the VMap0.Ed5.
In addition to commercial databases discussed in Section 3.9, three public domain data libraries which purportedly address at least some of the above limitations of the VMap0 were identified for the inventory. These three libraries include: the Global GIS Database effort sponsored by the American Geological Institute (AGI) and the USGS; the African Water Resources Database (AWRD) sponsored by FAO; and, the 1:1 million Quick Impact Database (QID), currently covering Africa and the Middle East, sponsored by the UNCS.
The AGI-USGS Global GIS Database effort provides seamless continental compilations of the VMap0 delivered on individual CD-ROMs or a global compilation delivered on a single DVD. Data compiled for the Global GIS Database are delivered in ESRI Shapefile format. Unfortunately, although the Global GIS Database includes data from sources other than the VMap0 (see Section 9), not all of the VMap0 data layers are represented in the database and those which are included do not contain any robust consolidation of features across tile boundaries or any value-added data encoding/attribution.
In comparison, although limited to continental Africa and associated Island States, FAO's AWRD effort addresses both of these issues, as well as including: derivative and truly seamless translations of all the layers of VMap0 source library, and hydrological layers harmonized between both the DCW and VMap0 sources. The AWRD currently contains 34 distinct data layers processed either directly from the VMap0 and/or the DCW, or a robust harmonization of the two source libraries. The AWRD does not however, address the issue of connectivity between linear river features and derivative outlines based on various surface water body and wetland features, or the connectivity of the transport infrastructure. The AWRD will be released in early 2005, pending a review of the predominately VMap0.Ed.3/4 data layers of the archive and selective revisions based on the VMap0.Ed5.
The third VMap0 derivative source database identified in the public domain is the pending UNCS-QID 1:1 million scale database covering Africa and portions of the Middle East. Based on a synergy of data development efforts, despite issues concerning copyright, the harmonized hydrological layers of the AWRD may provide at least the African portion of the current UNCS-QID 1:1 million scale data effort. According to e-mail communications, although not detailed in the specifications for the QID 1:1 million database, integrity tests in relation to the production of this library will purportedly ensure both the connectivity and naming of hydrological features, as well as the connectivity of the roads portion of the transport infrastructure.
In addition, to the above enhancements, the 1:1 million QID database will also include specific attributes as to the relative population density for populated place features. When completed, the 1:1 million QID library will contain 21 seamless vector data layers including: a Map Index; Islands; Political and related Administrative or Disputed Area Boundaries; Roads; Rail; Railway Yards; Bridges; Tunnels; Ferry Routes; Airports; four Populated Place point layers; Urban Sprawl or polygonal Populated Places; a point representation of Physical or Physiographic Places; linear Drainage; Surface Water Bodies; Springs/Waterholes; and Dams/Weirs. A review of the QID 1:1 million database is however, still pending the publication of these data.
Estimates of the LOE required to process the VMap0 library are to some degree contingent on whether any or all of the processing considerations raised in the previous subsections are included in the specifications. For example, the simple or straight forward translation of the approximately 34 baseline layers of the VMap0 into a seamless format would average between seven and ten days per continental landmass. However, the LOE required to globally process the VMap0 based on the more robust specifications, e.g. those used for either the AWRD or the UNCS QID 1:1 million databases, are almost an order of magnitude greater. An estimate of the LOE required to process the VMap0 and selected data layers of the DCW based on more stringent specifications are provided, on a layer by layer basis, in Appendix A of this publication.
The table presented in this appendix represents a revised version of one prepared for the Spatial Standards and Norms Task Force of FAO in 2003, "Suggested Hydrological Standards and Base Mapping". The LOE estimates provided in this table are based on fairly hard numbers derived from processing the DCW, as well as the fourth and fifth editions of the VMap0 for continental Africa. In all, approximately 6.35 days were required to process DCW data layers dropped during the migration from the DCW to VPF standard, and a further 27.2 days were spent processing and revising the VMap0 source layers. Using the 34 days required to process Africa as a standard, and assuming seven equivalent landmasses worldwide, the estimated LOE for globally processing the VMap0/DCW libraries into robust seamless derivatives would be approximately 204 person days.
It is estimated that between 25 to 30 days of the above LOE, i.e. that portion associated with the post processing of the VMap0 "back" into seamless continental coverages, could be saved if the UN could gain access to the seamless ArcInfo coverages/libraries created by NGA and ESRI for the processing the Fifth Edition of the VMap0.
The original World Data Bank and its successor the World Data Bank II (WDBII) represent perhaps the first globally consistent vector databases of coastlines, roads, inland water bodies, rivers, and populated places. These data were originally digitized by the U.S. Central Intelligence Agency (CIA) from ONC and other source maps during the late 1970s and early 1980s. According to an intermediate processing of these data for the Micro World Data Bank II, the base map scales used ranged from 1:750 000 to 1:4 000 000 with a nominal scale of 1:3 000 000 (Pospeschil, 1988). Most, if not all, of the lineage data associated with this database have been lost over time.
With the release of the DCW/VMap0, the WDBII data library has to some degree been treated as a legacy database. Due to this, the WDBII has not been utilized as fully for either base mapping at scales ranging from 1:2 million through 1:5 million or for continental analyses which the database can support. A number of WDBII derivative databases have been created over time, however, a fully revised edition of these data was released in 2001 employing ESRI's Shapefile format. For the purposes of this monograph, this edition of the WDBII will be referred to as the Relational World Data Bank II Database in Shapefile format v1.1 or RWDBII-Sv1.1.
For the RWDBII-Sv1.1, the revised WDBII were translated from an Intergraph geospatial data format into ESRI's Shapefile format. Although, the spatial baseline for the translated library did not contain completely updated features, some improvements over the original WDBII can be identified. Additionally, diacritical names for populated place and hydrological features were also added to improve the WDBII baseline. However, during the translation to ESRI Shapefile format for the RWDBII-Sv1.1, as regards the rivers data layers, the relational name attribute was dropped. A further revision of these data may be available to USG agencies sometime during 2005, but the potential status of future RWDBII-Sv1.1 editions in the public domain could not be established.
Based on metadata forwarded by the U.S. Department of State (DOS) covering the RWDBII-Sv1.1 library, the database has been released into the public domain subject to the fair-quotation of the USG as the source and the inclusion of the metadata in any distribution or derivatives. These metadata did not include any spatial accuracy assessments for the library and specific lineage information has again been lost. According to the metadata, the minimum representative scale at which the RWDBII-Sv1.1 can support base mapping should not exceed 1:2 million. Regarding the currency of the data library: subnational administrative boundaries should be current as of 1997; national boundaries, with a few exceptions, current as of 2001; and roads and related transport feature data layers would vary widely based on regional updates undertaken at various times between the 1980 baseline and 1997 (US-DOS, 2004).
The RWDBII-Sv1.1 database is comprised of 39 data layers: 5 point, 23 line, and 11 polygon. Each polygon layer is also represented as a separate linear layer, so there are in reality some 28 distinct layers in the library. These layers can be summarized into six topical classifications: Population, two layers administrative capitals and places; Transport, eight layers ports, airports, railroads and roads; Hydrology, seven layers rivers and lakes; Coastline, four layers oceanic coastlines and mixed inshore water body and offshore oceanic islands; Administrative, four layers complete global country and first order subnational and limited second and third order subnational; lastly, Miscellaneous, three layers time-zones, law of the sea and general gazetteer.
Given the ESRI Shapefile format of the RWDBII-Sv1.1 it was expected that the LOE for processing this library would be very low. However, upon a review which found inconsistencies between polygonal and linear representations of coincident features and differences between both coastlines/administrative and water bodies/islands the LOE estimate for processing the RWDBII-Sv1.1 was revised upwards to 32 days. This LOE would include: the consolidation of the various drainage and transport data layers into topical composite layers; the robust harmonization of difference between linear and polygonal versions of topical layers, including the rigorous integration of linear and polygonal attribute encoding; and lastly, the general consolidation of attribute encoding to better support spatial referencing, base mapping and potential analytical demands.
Based on tests conducted using the various layers of the RWDBII-Sv1.1 library subsequent to the preparation of Part Two of this inventory, the tasks outlined above would effectively require the rebuilding of the library largely from the ground-up using the linear feature layers. The expected layer order for this process would start with coastlines, then water bodies and double-lined rivers, the integration of the mixed oceanic and “inland” islands, and lastly the national and initial administrative boundary layers. After the above process is completed, it is likely that an additional LOE would be required to determine if any connectivity can be established between the resulting hydrological feature layers[4]. The same would also be true for any determination of the connectivity between road, rail, and populated place data layers of the library.
The UNCS Quick Impact Data (QID) data library is being developed under a project funded by the UN Foundation entitled, “Creating a UN Geographic Database”. The purpose of this project is to enable UN staff to prepare country profile level maps for use in reports and briefings. The data library is designed to provide world geographic data coverage at the 1:5 million and 1:10 million levels of detail based on circa 1980s Russian 1:5 million and 1:10 million scale base maps. The development of the database was contracted to East View Cartographic (EVC), Inc. based on specifications prepared by the UNCS. At the time this section of the inventory was prepared in May 2004, EVC had completed processing of the baseline data layers, including the translation and update of geographical names and international and provincial boundaries based on more current UN country profile maps and other materials.
Based on the specifications, the organizational content of both the 1:5 million and 1:10 million databases will be very similar in relation to the number and content of data layers. Each database will be comprised of 11 data layers and include: a Map Index; point Oceanic Island features; Political and related Administrative or Disputed Area Boundaries; Roads; Railways; Airports; Populated Place point features; Urban Sprawl polygonal areas; Physical or Physiographic point features; linear Drainage; and Surface Water Body polygons. As with the specification for the 1:1 million QID database in Section 3.6.3, the attribution of a name for population, airport, and drainage features is indicated in the 1:5 million and 1:10 million QID specification. As are the encoding of a relative population density ranking for populated places. Although, not detailed in the specifications, the task of ensuring the connectivity of transport and hydrological features will also purportedly be addressed.
With regard to accuracy, in relation to the source maps, the specifications state that no more than 95 percent of features will be displaced by more than 0.6mm at map scale, (UNCS, 2001). This should equate to ±3 km for the 1:500 000 scale QID and ±6 km for the 1:100 000 scale database. Although the 1:5 and 1:10 million QID library data were not available for review, using a simple rule of thumb that the largest scale at which vector data can be used representatively on base maps will lie between two-thirds and three-quarters of the base scale, the largest scales at which these data libraries can be employed should be 1:3 million and 1:6 million respectively.
When completed, it is anticipated that the 1:5 million and 1:10 million QID library will be published by the UNCS into the public domain under a very liberal fair-quotation EULA.
Three commercial data vendors were contacted directly to obtain samples of global databases or libraries of vector data in conjunction with the preparation of this report. These three companies were: ALLM GeoData (ALLM), American Digital Cartography (ADC), and Europa Technologies (EuropaTech)[7]. ALLM provides essentially a gazetteer service, while ADC and EuropaTech provide a variety of vector data products which are derived predominately from the NGA's DCW and VMap0 libraries, and possibly the NGA's GEOnet gazetteer database. Product literature associated with data from these companies indicates that each company's product-line is subject to periodic updates and enhancements from sources other than the NGA baselines.
The purpose of this section is to provide a brief overview of each company’s vector product offerings, estimates of the costs associated with each product, and its terms of use. Where relevant, an evaluation of each product in relation to its potential utility to support a specific CGDB data layer is provided under the topical subsections of Part Two of the inventory.
The ALLM Global Gazetteer, www.allm-geodata.com, holds some 4.7 million populated place names, approximately 3 million of which currently contain geocoding information. ALLM uses the NGA-GEOnet gazetteer database as a partial baseline, but estimates that their product contains 25 percent more "data" than the NGA source. The product is updated continuously as new data are geolocated or attributes based on national sources are made available, (ALLM, 2004a).
Table 3.9.1
Continental and global summary of ALLM
Gazetteer locations
|
Summary |
Locations |
Provinces |
Postcodes |
Lat/Long |
Area codes |
Population |
Accents |
Variants |
|
Europe |
1 978 585 |
1 701 154 |
991 904 |
1 032 003 |
137 426 |
141 200 |
445 433 |
11 665 |
|
Middle East |
295 400 |
265 963 |
12 142 |
55 961 |
2 2 379 |
38 953 |
204 582 |
565 |
|
North America |
234 178 |
231 602 |
74 489 |
220 487 |
71 324 |
29 329 |
925 |
294 |
|
Africa |
547 490 |
347 037 |
80 902 |
445 152 |
1 408 |
14 377 |
58 980 |
616 |
|
Central America |
239 939 |
229 783 |
81 970 |
181 235 |
4 560 |
34 583 |
25 980 |
148 |
|
Far East |
1 162 146 |
960 993 |
423 692 |
715 307 |
4 738 |
24 295 |
193 425 |
823 |
|
South America |
242 536 |
232 848 |
47 464 |
173 750 |
3 552 |
10 280 |
39 546 |
279 |
|
Oceania & Antarctica |
65 607 |
53 391 |
26 418 |
48 074 |
33 240 |
3 625 |
809 |
68 |
|
Global Summary |
4 700 274 |
3 622 343 |
1 712 563 |
2 823 895 |
221 600 |
293 017 |
968 871 |
14 390 |
Table 3.9.1 summarizes the types of attributes available from ALLM and the number of features represented continentally and globally.
Pricing for ALLM's Global Gazetteer is dependent on the quantity and type of information ordered. In its on-line reference literature, ALLM likens this to ordering a pizza, where the user pays first for a base product including a basic topping, i.e. country, name, and lat/long, and then additional charges are added for any additional toppings ordered, e.g. a population estimate. Base pricing for the ALLM product starts at US$33/1000 records, with an additional cost of US$16.50 incurred for every thousand records containing valid encoding for any additional attributes. Volume discounts are applicable based on the number of locations ordered and the number of additional attributes, i.e. toppings, requested conditional on the number of records containing a valid encoding reference. This discount starts at 10 percent for orders of more than 100 000 records, and rises linearly to 50 percent for 500 000 records, eventually reaching 75 percent if for more than 4 million records are ordered, (ALLM, 2004b).
For example, if all 293 017 locations having a valid population attribute were required: the base charge would equal this number divided by 1000 and then multiplied by 33, or US$9 670; the charge for the population attribute would similarly equal this number divided by 1000 and then multiplied by 16.50, or US$4 835; and a 20 percent discount would apply based on the +200 000 volume to arrive at a total price of US$11 605.
A price of US$60 000 was quoted by ALLM if all 2.8m geocoded place names were ordered without any additional attributes. Regarding the potential utilization of ALLM data for updating secondary or derivative data sources, ALLM has indicated that their data is sold for the purposes of updating without issue and is covered in the copyright, (ALLM, 2004a). In order to facilitate the comparison and review of its digital product line, ALLM provided a sample of its data holdings covering the Namibian AOI and authorized its use in conjunction with the preparation of this report.
According to available product literature, ADC's WorldMap, www.adci.com, contains the most complete and detailed global 1:1 million scale vector data library available, (ADC, 2004a). ADC does not currently provide any raster data products. However, in addition to its WorldMap product, ADC also produces specific continental products for Africa, Central and South America, and India. ADC's India product contains numerous 1:250 000 scale data layers in addition to the 1:1m scale baseline. All four of ADC's continental products also contain a derivative 1:250 000 scale WVS+ coastline layer and a vegetation data layer based on the global AVHRR Land Cover database.
ADC updates its products every 12-18 months and a new edition was scheduled for release after the on-line inventory was completed during the first quarter of 2004. In addition to incorporating updates based on new editions from NGA sources, ADC also includes information from a variety of external commercial, national, and international sources. Specific to the CGDB inventory, ADC's product was reviewed in regards to its potential utilization for providing updated: Coastlines, Administrative Boundaries, Populated Places, Transport Hubs and related Infrastructure including road and railway lines.
ADC does not generally provide the individual layers of its product line separately. This stricture is however open to negotiation dependant on the volume of any order. ADC quoted an approximate price of US$10 481 for the potential use of the WorldMap product within seven UN Organizations (a total of 50 users). Distribution of maps based on ADC products within the UN, for example in a PDF graphic format, would be allowed under the product copyright/EULA subject to a fair-quotation of ADC as a source data provider. However, ADC would impose rather stringent copyright restrictions on the utilization of their data products either directly in derivative datasets or for the purposes of updating secondary attributes, (ADC, 2004b).
ADC provided a sample of its WorldMap product covering the Namibian AOI and authorized its use in order to facilitate comparisons of data layers represented in the company's product-line.
Europa Technology (EuropaTech), www.europa-tech.com, licenses a range of global 1:1 million scale data products, based on the inclusiveness of the number of layers comprising each product. For this reason, similar to ADC, EuropaTech does not generally consider the licensing of the individual layers of its product line. EuropaTech's premier product is Global Discovery. This product contains all of the vector data layers available from its various other product offerings and includes raster image background layers of elevation and bathymetry. The company's Global Insight product is its premier product offering only vector data.
EuropaTech's product literature indicates that although the DCW/VMap0 data libraries were used as a baseline, the layers comprising EuropaTech's various offerings have undergone over 12 man-years of updates in order to create the leading range of products in its class, (EuropaTech, 2003). According to e-mail communications, EuropaTech's products are updated quarterly and are well known to the UNCS and several other UN organizations including WFP, WHO and UNHCR (EuropaTech, 2004). In regards to the CGDB inventory review, the Global Insight Plus product was evaluated towards its potential utilization for providing updated: Administrative Boundaries, Populated Places and Census Estimates, Transport Hubs and Infrastructure. The hydrological layers of the Global Insight Plus, including any purported network connectivity, were not included in the inventory after a review covering continental Africa determined there were no comparative differences between these and public domain layers derived directly from the VMap0.Ed.3/4. The name attributes for the VMap0.Ed5 water body and river were also found to be missing from the version of Global Insight provided for review.
EuropaTech offers UN missions a 50 percent discount on their standard pricing of US$2 495 for its Global Insight Plus product. Pro-rated based on a five seat-licence allowing a maximum of 50 users, the price for this product would be US$6 238. Similar to ADC, EuropaTech's EULA allows for the internal distribution of hardcopy or graphical maps based on their data within the UN subject to a fair-quotation of EuropaTech as a source data provider. The open distribution of such maps over the internet would be subject to further negotiation and potential licensing fees. EuropaTech also imposes rather stringent copyright restrictions on the utilization of their data products either directly in derivative datasets or for the purposes of updating secondary attributes, (EuropaTech, 2004).
EuropaTech provided a full global sample of the company's Global Discovery product and authorized its use in conjunction with this manuscript in order to facilitate an evaluation of the company's data holdings.
|
[1] The LOE estimates provided
are meant to be vendor-neutral and represent only that effort required to
directly process the data under immediate consideration. As a result, the LOE
necessary to access either a source library or database as a whole and to then
prepare these data for processing may not in all cases be represented.
Similarly, the task of metadata documentation is not included in the
estimates. [2] It is arguable whether the issue of the VPF tiling format is more of a limitation of GIS systems vis-à-vis the VPF format, rather than an inherent limitation of the format itself. This is in particular true of any processing related to linear networks, where the inherent inter-tile node connectivity of the latest edition of the VPF format is not maintained. However, the issue is further complicated by the additional complexity added to directly utilizing VPF formatted data when an AOI spans multiple VMap distribution CDs. For example, although the sizes of the VMap0 tiles depicted on Figure 2.3 have been increased for the VMap0.Ed5, processing for Africa is still complicated by having to access data from VPF libraries contained on three separate CD-ROMs. [3] Access to the RWDBII-SV1.1 data library was not granted until after the comparative inventory sections of this report were prepared. As a result, a direct comparison of RWDBII-SV1.1 feature layers to other sources by CGDB layer was not undertaken. [4] The RWDBII-Sv1.1 contains center line derivatives for so-called double lined rivers unfortunately, these features only link the main stem of a river and do not intersect with tributaries. [5] The text in this subsection has been revised based on a review by UNCS of a preliminary draft, (UNCS 2004b). [6] The inclusion of products from the companies represented in this report in no way implies an endorsement of any kind by the FAO regarding either the companies or their data products. [7] Commercial data products from companies such as AGIS Software, Cerro Verde Geotech, Delorme, ESRI, Manifold GIS, PhD Associates, and PowerNet were reviewed but omitted from consideration in the inventory based on both the currency of the products offered in regards to revisions of the source data library and the level of value-added processing. The omission of data from these companies in no way reflects negatively on the products reviewed or the companies associated with them. Digital data potentially available from organizations producing maps and map atlases, e.g. John Bartholomew & Sons Ltd. or the National Geographic Society, were not evaluated in conjunction with this report. |
![]()
![]()
![]()
)