![]()
![]()
![]()
This section has been introduced into the inventory in order to provide reviewers with a brief overview of some of the analytical efforts which are being undertaken to either place people on the landscape in relation to a host of environmental considerations or to delineate areas representing a range of human potential and constraints such as agricultural productivity and factors influencing the alleviation of poverty.
Effectively, this and the following section on virtual base maps represent the topical domains where the datasets discussed in the previous sections of the inventory come together either for the purposes of analysis and/or for thematic representation onto a map. This section of the inventory was also written to represent not only a focal end to the inventorying of “primary” spatial data sources, but to provide a transition to any future outputs which may result from FAO Poverty Mapping Project Group’s (PMPG) Food Insecurity and Vulnerability Information and Mapping Systems (FIVIMS) Programme.
Again, one of the primary purposes for which this inventory was prepared, was to detail potential sources of spatial data at higher resolution than have been previously compiled for efforts such as the Millennium Ecosystem Assessment (MEA), www.millenniumassessment.org. Further, given that the inventory prepared for the MEA already details the relative wealth of global monitoring and derivative raster datasets, i.e. those having a cell size at or greater than 5 arc minutes, which have been output based on a composite of the “primary” data layers presented earlier, such sources of data will not be discussed. Rather, even though the data sources presented in this section may in some case be based on highly aggregated inputs, they have been included based on their uniqueness or correspondence to an FAO specific database or as a potential test bed for the FIVIMS Programme. In order to do this adequately, for the first time in this manuscript some discussion of historic aspatial tabular databases which can be linked or at least roughly associated with country or subnational spatial boundary layers will also be undertaken.
Section 9.5 introduced soils as a key data layer that when combined with elevation information, i.e. slope and potentially aspect, climatological and hydrological data can provide an effective baseline for the analysis of agricultural suitability and to some degree sustainability. The combination of some or all of these data layers into a derivative output dataset is often referred to as agro-ecological zoning (AEZ) or assessment.
The further addition of layers representing human factors such as population density, land use and/or land cover change and ethno-agricultural land practices, including livestock, can also be used to create further composite data outputs which are more directly illustrative of environmental sustainability. Because any resulting composite suitability data will be representative of both agricultural potential and status, these data can be used as a spatial baseline in a number of analyses such as soil and land degradation, crop suitability, agricultural sustainability and land use planning, nutrient loading and response, and emergency response and mitigation. Similarly, such composite data are also useful in more generalized development planning focused on more effective natural resources management and the potential alleviation of poverty via the identification of inputs and management practices promoting sustainable agricultural practices.
Two activities sponsored at least in part by the Land and Water Development Division of FAO have been selected for this section of the inventory as indicative of both the availability of agro-ecological zoning/suitability data and then their application globally. These two initiatives represent slightly different focuses and then representative scales to the assessment of agro-ecological zoning.
The first of these activities sponsored in part by FAO is entitled Global Agro-Ecological Assessment for Agriculture in the Twenty-First Century (GAEA21). The GAEA21 is a collaborative effort of the International Institute for Applied Systems Analysis (IIASA) and FAO. The dataset and methodological materials related to the publication are available either as a CD-ROM published as Number 21 in the FAO Land and Water Digital Media Series, www.fao.org/landandwater/lwdms.stm or on-line from an IIASA Web interface at www.iiasa.ac.at/Research/LUC/gaez.html. The GAEA21 was published in 2002 and replaces the previously published Number 11 in the above media series.
The GAEA21 and its predecessor are widely recognized as more robust replacements to earlier AEZ efforts such as the 1:10 million Global Assessment of Human-induced Soil Degradation (GLASOD). GLASOD was originally produced as a cartographic product that was later digitized and refined during 1990-91 as a spatial and related tabular database. However, while ground-breaking at the time of publication, it was subsequently recognized that a broader methodological approach to AEZ modelling was required. Therefore, although the GAEA21 activity to some degree builds on past AEZ efforts, it was also designed to include a more cross-sectoral approach that was similar to the methodologies more recently developed for the SOTER/WOCAT activities discussed under Section 9.6. This would include the integration of: time-series climatological and agricultural productivity data; a greater range of physical and environmental factors; and lastly, human population and socio-economic criteria. The FAO Land and Water on-line resource located at www.fao.org/WAICENT/FAOINFO/AGRICULT/AGL/agll/gaez/index.htm provides a detailed description of the evolution and current focus of AEZ methodologies.
In regards to global data, the GAEA21 effort has produced a number of multi-scale raster and tabular data outputs. These outputs include 93 grids of both inputs and modelled outputs and 39 spreadsheets providing the modelling criteria and results for some 157 countries with constraints based on regionally specific assessments of agro-ecological suitability. The output grids generally consider constraints and then suitability potential for the production of a range of crops using potential mixes of input technologies. The 93 grids can be roughly divided into the following classification of inputs and outputs: Climatic Inputs (9 grids); Physiographic Slope Input (1 grid); Agro-Ecological Inputs (2 grids); Human Population Input (1 grid); Climatic,
Soil and Physiographic Constraints (9 grids); Agro-Climatically Limiting and Attainable Yields Wheat and Maize with High Inputs (9 grids); Suitability for Rain Fed Cropping with High Inputs for: Wheat, maize and cereals; Roots, tubers and pulses; Oil crops; Sugar; and Cotton (8 grids); Suitability for Rain Fed and Irrigated Crops with High Inputs (11 grids); Most Suitable Cereal based on Physical, Food Energy and Value (3 grids); Productivity for Single and Multiple Cropping of Rain Fed Cereals (4 grids); Suitability for Rain Fed Crops Excluding or Under Forest Eco-Systems (2 grids); Distribution of Rain Fed Wheat, Maize and Cereals based on Climatic Change (11 grids); and Suitability for 23 Specific Rain Fed Crops under a Maximized Mix of Inputs (23 grids).
The IIASA GAEA21 Web site contains what appears to be roughly the same gridded data for download, but two major exceptions were noted. These exceptions include a distribution of data for 27 specific rain fed crops rather than the 23 found in the last classification above, and the distribution of multiple versions or scenarios for eight of the single grids available on the CD-ROM. Based on the documentation for the GAEA21 all datasets from both sources are available as both 0.5° (55 km) and 5 arc minute (9.2 km) resolution 1 or 2 byte grids in BIL format; graphical versions of the map plates published in the manuscript based on the gridded data are also available. However, based on a review of the actual data on the CD-ROM or available on-line: 17 of the grids, primarily covering climatic input or constraint grids, are only available as 16-bit generalized 0.5° 360x720 pixel resolution grids. With the further exception of one 16-bit 5’ minute 4320x2160 pixel resolution grid, the remainder of the 75 grids are available as only 8-bit 5’ minute 4320x2160 pixel resolution grids.
As the full resolution 8-bit or 16-bit grid data are available from FAO/IIASA - potentially with a more robust non-spreadsheet linkage to the AEZ methodological criteria and results - FAO and IIASA may want to consider making these data available in ESRI’s Arc-Grid format for a supplementary on-line distribution possibly via the FAO GeoNet Server. If such a distribution cannot be coordinated, the LOE expected to process the grid data including the creation of legend classifications approximating the map plates for the publication, would be two days. However, the more difficult task of formatting and linking potential AEZ criteria and result attributes from 23 multi-book Excel Spreadsheets, would likely take between one and two weeks.
The second of the FAO sponsored activities presented as representative of AEZ methods is a joint project between the Land and Water Development Division of FAO and the Center for Environmental System Research of the University of Kassel, Germany to produce a Global Map of Irrigated Areas. The first version of this map was based on cartographic and statistical sources and version 1 of the spatial dataset was released as a half degree raster grid. This effort was followed by one focused on the production of an global spatial dataset of irrigated areas having a spatial resolution of 5', 1 minute = 2 km at the equator, based on the methodology developed for the first dataset. This follow-on activity promoted by FAO Statistics and Information on Water and Agriculture Section, is commonly referred to by the acronym AQUASTAT, www.fao.org/landandwater/aglw/aquastat/main/index.stm.
This activity is substantively different from the GAEA21 activity and the more standardized SOTER/WOCAT methodology for AEZ modelling. The project does, however, build on soils as a key input layer that is then integrated spatially with many of the same multi-sectoral data to produce cross-cutting outputs via a GIS toolset that has been released in beta for Africa. In addition to having more of a focus on irrigable land versus rain fed agro-ecological planning than the GAEA21, the AQUASTAT activity uses a river basin approach for determining the relative suitability of areas across the landscape. The river basin units used to delineate the landscape are based on a watershed model, from which broader classifications of land suitable across a range of agro-irrigation technologies can be determined based on user selected criteria.
The AQUASTAT Global Map of Irrigated Areas is currently in version v.2.1. This revision of the global dataset contains many areas which have been updated to the 5' minute (9 km) raster cell size and were in turn used to update the corresponding 0.5º areas of the v.1 dataset. The regions which have been updated currently include Latin America, Europe, Africa and Oceania. The common analytical unit used as a baseline for each regional update actually employed a cell size of 0.01º. This cell size was aggregated to a 5' cell size for integration into global dataset. With the exception of the updated data covering Australia, which depicts the actual area under irrigation in 1995, the updates for the other regions are representative of the area “equipped” for irrigation circa 1995.
In addition to updating the irrigated areas dataset, the AQUASTAT effort has also codified a tabular database that can be used to map areas based on country units in the following thematic areas: environment; land use; population; water resources; water use; drainage; sources of irrigation water; land under irrigation; irrigated crops and cropping intensity; and irrigation techniques. Other spatial data resources available via AQUASTAT include: global 5' soil moisture derivatives based on the FAO Soils Map of the World; global 1961-1990 monthly and yearly, i.e. 13 grids, of mean precipitation and evapotranspiration at cell sizes of 10 and 30 arc minutes (20 km and 60 km) derived predominantly from the CRU’s v.2 and v.1 datasets; and a separate FAO Land and Water Digital Media Series publication entitled the “Atlas of Water Resources and Irrigation in Africa”. This latter data resource combines both raster and vector data and provides a spatial toolset for analysing many of data layers discussed throughout this subsection using either a river basin or national administrative units to derive areas suitable for irrigation and then by exclusion those suitable for rain fed agricultural technologies.
The two activities discussed above as representative of the current status of AEZ planning, attempt to include human populations into their analytical frameworks using predominately the number of people per square kilometre. This is done primarily for two reasons. The first being that population density is a good surrogate indicator of pressure on land and related environmental resources; while for the second, it becomes possible to arrive at estimates of populations either at risk or that can potentially be affected by changes in land management practices. In both activities however, there is recognition that population density alone is not the only or best indicator required to place people effectively on the landscape. Rather, population density is used primarily because other sources of data which can be used as indicators shadowing the range of human activities are either unavailable or limited to gross national aggregates.
This is particularly true for the range of health, access to capital and other resources, education, infrastructure, and other criteria generally comprising a robust list of socio-economic indicators. Disappointingly, this lack of disaggregate socio-economic and cultural data can be expected to continue until concerted efforts can be made to capture the variety of subnational census data routinely captured by host governments, e.g. population, health, education, welfare and agricultural data, spatially as either points or into a harmonized framework such as the SALB second order administrative units. While such efforts may prove ultimately impractical for a number of reasons, two global subnational data initiatives which will specifically enhance the spatial specificity of AEZ planning methodologies are presented in the following subsection.
FAO is widely recognized as the main repository of global forestry, crop, livestock, and fisheries statistics via it’s FAOSTAT Web site, http://apps.fao.org/default.jsp. However, due in large part to the difficulties incumbent with the determination of both current and historical boundaries related to subnational crop, livestock and to some degree fisheries data, the only common representation of these data in FAOSTAT are national level aggregates. Further, although, FAOSTAT includes statistics related to forestry and fisheries harvests, crop and livestock production, and a host of related nutrition, price, and other indicator data, for the purposes of this inventory only the statistical data related to crop and livestock production are considered.
This was done in order to highlight the only two initiatives identified which are currently attempting to provide subnational crop reporting and livestock census data rather than the national aggregates available via FAOSTAT. These two FAO supported activities are the Global Livestock Production and Health Atlas (GLiPHA) and the Global Spatial Database of Subnational Agricultural Land-Use Statistics (Agro-MAPS). Both of these initiatives are fairly recent and incomplete, with the latter of the two currently containing a slightly more extensive archive of subnational data.
The integration of subnational agricultural productivity data into cross-cutting development planning efforts such as agro-ecological assessment and poverty alleviation is important and necessary in order to assist with the quantification of more robust indicators of past trends and current status. These indicators represent key determinants which can then be factored into analyses focused on: soil and land degradation; agricultural sustainability; emergency response and mitigation; poverty assessment and mapping; general development planning; and as potential surrogate indices representing access to economic resources and risk aversion, agricultural inputs and/or infrastructure, and coping strategies related to natural events and conflict.
The Global Livestock Production and Health Atlas or GLiPHA activity is sponsored primarily by the Animal Production and Health Division under the Agricultural Department of FAO, www.fao.org/ag/againfo/resources/en/glipha/default.html. Based on a brief review of the GLiPHA Dynamic Mapping service, www.fao.org/ag/aga/glipha/index.jsp, and the data available for download, the last extensive update for the GLiPHA database may have been in 2002.
According to text drawn from the main GLiPHA Web site cited above, “components of the atlas include vector and raster maps, databases, classification rules for country-level disease risk classification, “disease cards“ containing basic background information on selected diseases, and metadata and links to other relevant Web sites. The data contained in GLiPHA are organized into five layers or themes, which include: biophysical resources, socio-economics, livestock populations and production, animal health, and trade in livestock and livestock products. Each layer or theme in turn combines a number of subthemes, which are further disaggregated into various data items. The socio-economic layer for example comprises the subthemes food supply, human demographics and production indices, of which the latter are broken down into crops and livestock. The data is collated from 1995 onwards, permitting the presentation of time series”, (FAO-APHD 2004).
Further, dependant on a rapid and cursory review of the GLiPHA dynamic mapping service, there exists a fairly wide variability regarding any available time series between countries. Through this service users can choose to represent combinations of the data described above as a map, table or graph. Users can also set the extent of reporting from the GLiPHA mapping service by selecting the world, a region, or country. Subnational data reporting is only available for country based extents, whereas for the global and regional extents, reporting is based on national aggregate data from FAOSTAT. Country subnational data available from the GLiPHA database currently supports data for: three countries in South America; 11 from the Near East and Asia, and nine countries from Africa.
The GLiPHA database is available for download after a basic registration process and the data do not appear to be copyrighted or subject to any use/dissemination restrictions. The GLiPHA database is currently delivered in the FAO KIMS format, which does potentially limit access to these data. The sources for the vector based data in the GLiPHA library could not be exactly determined via the Web based resources and metadata. The level of effort required to process the total GLiPHA archive from the KIMS spatial and tabular formats into ESRI Shapefile and dBase formats can be estimated at between three to five days.
The second of the two FAO sponsored activities aimed at the production of a database of subnational agricultural statistics is the Global Spatial Database of Subnational Agricultural Land-Use Statistics. The results of this activity have been grouped under a database linking spatial and tabular data, termed Mapping of Agricultural Production Systems or Agro-MAPS. Agro-MAPS data are available as both a FAO Land and Water Digital Media Series publication on CD-ROM and downloads available via www.fao.org/landandwater/agll/agromaps. In addition to FAO, the two other main participants of the Agro-MAPS effort are the International Food Policy Research Institute (IFPRI), www.ifpri.org/, under the Consultative Group on International Agricultural Research (CGIAR) of the World Bank and the Centre for Sustainability and the Global Environment (SAGE), University of Wisconsin, USA www.sage.wisc.edu/.
According to a background paper outline the Agro-MAPS effort, the purpose of the resulting database is to “fill critical gaps in the data needed for analyses related to land degradation, food security, farming systems, nutrient balance and climate change. Agro-MAPS currently contains data on crop production, area harvested and crop yields. It is envisaged that other subnational land use information useful for characterizing agricultural production systems, will eventually be incorporated in Agro-MAPS”, (FAO-AgroMAPS 2003).
Although currently in beta testing and providing data for only a portion of Africa, the Agro-MAPS database is expected to provide near global coverage with: FAO preparing data for Africa and the Middle East; IFPRI Latin America, Asia, Australia and New Zealand; and SAGE, the remainder of the world. For the beta version of the database, FAO has developed an Microsoft Access driven application named Agro-MAPS Explorer. Agro-MAPS Explorer provides an interface to spatial datasets representing administrative boundaries at two levels below the national level. The encoding scheme chosen to provide a linkage between the tabular agricultural databases and spatial datasets is based directly on the one developed for the SALB effort discussed in Section 4.2.2. However, as also discussed in Section 4, given the potential disparity between administrative boundaries and then those used to collect and aggregate agricultural statistics, the process of codifying the data for the Agro-MAPS effort is problematic.
For the Agro-MAP effort, a subset of 20 primary crops representing globally significant agricultural commodities was selected for inclusion in the tabular database. Encoding for these data are based on standard FAO codes for crops and include annual reporting of: the area harvested in hectares, production in metric tonnes, the yield in metric tonnes per hectare, and potentially the portion of the harvest set aside as seed stock for subsequent planting season. The primary crop reporting data are supplemented by the addition of a similar number of regionally specific crops of importance. Given the differences in the reporting of agricultural data between countries, the time-series relevant to each individual county will vary based on the available historical record.
Based again on the FAO background paper laying out the rational and guidelines for the Agro-MAPS effort, one of the anticipated uses of the data compiled will be its use “in conjunction with other datasets, e.g. population and farming systems, to calculate a wide range of indicators that are relevant for understanding the complex issue of land degradation within different ecosystems”, (FAO-AgroMAPS 2003). With such anticipated uses in mind, the Agro-MAPS effort - if carried to conclusion - will become a central input within specific agro-ecological models and as a key indicator of goods and services under categories provisionally identified by the MEA as necessary within the broader framework of global ecosystem assessment and modelling.
In Section 13.1 an attempt was made to introduce two activities which are representative of current global efforts in regards to AEZ planning. In Section 13.2 a similar effort was made to detail two initiatives to capture subnational agricultural data. Overall, the purpose for including such discussions in this manuscript was to present AEZ methodologies as a potential mechanism for broadening the scope of development planning tools[31]. Specifically, the construction of composite suitability models which can more effectively include indicators of human needs and constraints beyond those focused on land management practices.
The edition of such criteria into AEZ methodologies is not new and is in fact included broadly within the activities discussed previously and the analytical frameworks developed to support them. However, even taking this into account and considering the acute lack of supportive source of disaggregate socio-economic data, somewhat of a paradigm shift is occurring away from AEZ specific focuses to one perhaps best described as ethno-environmental suitability modelling. In order to highlight the broadening of current AEZ analytical frameworks and a more general shift in their focus, FAO sponsored TerraStat and UNESCO sponsored Data Synthesis System for World Water Resources are presented below.
The TerraStat Global Land Resource GIS Models and Databases were developed by FAO under funding by Government of Norway to support the FAO Poverty and Food Insecurity Mapping Project. The global TerraStat database is currently in its first beta release and builds on the methods and data developed for the GAEA21 effort described earlier. In addition to integrating AEZ based inputs and human population density data, outputs from the database are based on modelling algorithms which can consider both past trends in production data and population growth rates for determining the balance of land classified as available and suitable for specific crops under various technological production regimes.
The TerraStat database and models are described in detail via Section 5.2 of the on-line reference material located at www.fao.org/sd/eidirect/gis/EIgis000.htm. Version 1 of the database was originally published in 2002 as Number 20 in the FAO Land and Water Digital Media Series under the title, TerraStat - Global land resources GIS models and databases for poverty and food insecurity mapping. The database is currently comprised of 38 raster data grids in ESRI’s Arc-Grid format at a resolution of 5 arc minutes having a nominal pixel size of 9.2 km. The TerraStat database can be divided into six topical classifications as follows: Climatic Characteristics, thermal and available length of growing season (3 grids); Population Characteristics (1 grid); Soil Indicators and Terrain Properties (25 grids including: soil acidity and pH, nutrient supply, carbon pool, moisture supply, dominant type, productivity index, and slope); Integrated Land Resources (2 grids); Potential Cropping Zones (4 grids, intermediate input suitability for rain fed wheat and maize, high input rain fed and irrigated rice, and value of the most suitable cereal); and lastly, Potential Food Self-Sufficiency (3 grids including grain production per person with high and low inputs, and potential for rain fed production based on low inputs).
The database publication was followed by the publication of the GIS interface and modelling algorithms in July of 2003. The interface is currently in beta for version 1.0 and is designed to run using ESRI’s ArcView 3.x GIS software. Due to the reliance on input TerraStat grid datasets, the ArcView add-on Spatial Analyst module is currently required to conduct any composite suitability analysis and to output grids based on user defined criteria. Currently, analyses are limited to country, regional, continental or global areas of interest. However, this limitation is expected to be improved - at least for larger subnational areas - when a global second order administrative dataset is released by FAO in support of the SALB effort sometime in 2005. Similarly, the data contained in the TerraStat database is expected to undergo a preliminary evaluation regarding its analytical suitability within the framework of larger watershed and river basins using the FAO African Water Resources Database and Toolset during the first quarter of 2005.
A beta version of the TerraStat analytical framework is available on-line and allows potential users create tabular country-by-country reports from composite layers of the TerraStat database. This resource is available at www.fao.org/landandwater/agll/ terrastat/wsr.asp.
The Data Synthesis System (DSS) for World Water Resources represents an initiative that for the first time allows for the spatial consideration of a broad range of ethno-environmental indicator data. The DSS is funded via the UNESCO International Hydrological Programme under the sponsorship of a broader UN umbrella organization known the World Water Assessment Programme (WWAP)[32]. The primary data standardization and analytical interface development work of the DSS are being conducted by Water Systems Analysis Group of the University of New Hampshire, USA, using source data provided by WWAP partners and other organizations such as the World Resources Institute, USGS, UNEP, FAO, etc.
The first phase of the DSS initiative has been ostensibly completed and was focused on proof of concept and testing as to the viability of the methods under consideration. Given this, the production of robust primary source datasets was not considered a priority during the first phase of the DSS and in many cases the most easily accessible sources of data were referenced. The results of the first phase of the DSS can be reviewed via the DSS Web site, www.wwap-dss.sr.unh.edu/index.html. These include access to an on-line analytical interface, currently in beta testing, and some thirty-five datasets covering Africa which are available for download. The DSS interface brings together a broad range of spatial biophysical data and socioeconomic statistical data that can be represented within a common geographical grid format.
The basic unit of analysis for the DSS is currently limited to megabasins, i.e. an entire river system, based mainly on limitations of regarding the highly aggregate sources of indicator data available to support the projected analytical requirements of the interface. For the initiative, the data sources described below have been resampled to standardized raster grids having a pixel resolution of 6 arc minutes or roughly 11 km at the equator. Because much of the source data used to develop the DSS indicator data layers were based on either country level statistics or those associated with individual megabasins, for the most part this cell-size does not represent any generalization of the source data but rather the opposite.
The actual methodological results of the first phase of DSS were not available at the above URL for review and comparison to existing methods of AEZ modelling. However, some indication of any methods which may result from the effort can be perhaps be anticipated based on the twelve categories into which the input indicator data are grouped for documentation and retrieval via the DSS Web site. These include: General Information (1 grid); Meeting Basic Needs (5 grids); Securing the Food Supply (6 grids); Protecting Ecosystems (6 grids); Sharing Water Resources (4 grids); Managing Risks (2 grids); Valuing Water (4 grids); Governing Water Wisely (2 grids); Water for Industry (2 grids); Water for Energy (2 grids); Ensuring Knowledge Base (3 grids); and Water and Cities (3 grids).
The sum of the number of available grids listed by the above categories exceeds the number of datasets available for download via the DSS Web site, indicating there is some inclusive duplication. Somewhat similarly, the number of datasets available as inputs for megabasin specific analyses via the on-line interface is less than those available for download, indicating that some composite analysis may also have been conducted to the input datasets. Table 13.3.2 contains a list of the 28 indicator data layers available for direct spatial analysis via the DSS interface. These layers are supplemented by the following datasets which to some degree may already be captured within the DSS analytical framework: River Basins, Political Boundaries, Land Cover, Active River Network Directions, Active River Network Stream Order, Potential River Network Directions, Potential River Network Stream Order and the Exceedance Probability of Flooding.
Table 13.3.2
DSS analytical indicators
|
Parameter |
Unit |
Symbol |
Parameter |
Unit |
Symbol |
|
Access to Safe Drinking Water |
% of population |
D1 |
Nitrogen Application Rate |
mt/km2/yr |
D16 |
|
Climate Moisture |
Index |
D2 |
Nitrogen Load |
mt/km2/yr |
D17 |
|
Cropland Area |
km2 |
D3 |
Precipitation |
mm/yr |
D18 |
|
Demand/Q |
1000 of people |
D4 |
Runoff |
mm/yr |
D19 |
|
Discharge |
m 3/yr |
D5 |
Population - Urban |
people per km2 |
D20 |
|
Drought |
1000 of people |
D6 |
Population _ Rural |
people per km2 |
D21 |
|
Education Expenditures |
% of GNP |
D7 |
Population _ Total |
people per km2 |
D22 |
|
Elevation |
M |
D8 |
Sanitation |
% of population |
D23 |
|
Energy _ Hydroelectric |
giga watt-hours/yr |
D9 |
Served by Sewer |
% of population |
D24 |
|
Energy _ Thermal |
giga watt-hours/yr |
D10 |
Sewerage Treatment |
% of population |
D25 |
|
Energy _ Nuclear |
giga watt-hours/yr |
D11 |
Water Demand -Domestic |
1000 m3/km2/yr |
D26 |
|
Evapotranspiration |
mm/yr |
D12 |
Water Demand -Industrial |
1000 m3/km2/yr |
D27 |
|
Infant Mortality |
deaths per 1000 |
D13 |
Water Demand - Agricultural |
1000 m3/km2/yr |
D28 |
|
Irrigation Water Use |
thousand m3/km2/yr |
D14 |
|
|
|
|
Literacy |
% |
D15 |
|
|
|
The analytical interface of the DSS allows potential users to examine and map a complex range of input variables via grid based mathematical queries. Users can build queries based on a full range of standard mathematical operators such as, + - */ **, as well as many commonly used scalar functions including: sqrt(), abs(), exp(), log(), sin(), cos(), tan(), etc. A comprehensive Help menu is linked to the interface, and can assist users in defining rational mathematical queries and the trapping of potential errors, (UNH-DSS 2003). As stated earlier, the AOI for any queries is limited to a specific river system megabasin; the results of such queries are presented as both a map and table on the screen. Currently, the map outputs resulting from a DSS query cannot be exported as either georeferenced graphics or as actual gridded data.
If approved for funding by UNESCO and the WWAP, improvements envisioned during phase two of the DSS are expected to include a more formalized presentation of the methods employed, a refinement of the data sources used to support the development of input indicator data, an enhancement of the input output capabilities of the interface, and an expansion of the analytical framework to encompass non-terrestrial water resources.
The terms composite suitability analysis and ethno-environmental modelling were introduced in this section of the inventory to highlight what appears to be an apparent synchronicity of efforts within the UN to extend traditional AEZ modelling frameworks. Specifically, those efforts which attempt to more effectively place people on the landscape via the integration of socio-economic and environmentally focused indicators of health and sustainability. Weighing against such efforts is the relative paucity of economic, social, ethnographic and human health data which can be used as indicators in support of spatially disaggregate analyses below the national level. Taking this limitation into account, however, there are likely to be spin-off effects of efforts such as the SALB. Whereby, once subnational administrative boundaries can be determined, methods can be developed to draw on the relative wealth of historic and more current primary census data, including sub-sample survey data designed to capture fertility, health, economic and education indicators at the household level.
Leaving the issue of access to more robust subnational ethnographic and economic data for the moment aside, there appears to be a very real possibility for UNGIWG - or at least FAO - to create a synergy of AEZ like modelling efforts by supporting the integration of the existing analytical GIS toolsets which have already been developed. In this case what is recommended is not the creation of yet another suite of GIS tools, but rather some effort to improve the interoperability of the toolsets already existing.
For example, within FAO alone and based solely on the GIS interfaces reviewed in conjunction with the preparation of this inventory, for a very limited expenditure the AQUASTAT, TerraStat, AWRD and LocClim data and GIS toolsets could be harmonized to operate under a common shell programme using ArcView or possibly ESRI’s Arc-Publisher. Such a shell would support the integration of any DSS methodological results, the analysis of grid data via proprietary and non-proprietary data formats, the robust interpolation of point based data, and the analysis of data based on individual watersheds - including any combination of upstream, downstream, river basin and megabasin units - as well as a similar consideration of subnational, national, regional or continental areas of interest based on an user’s specific criteria. In addition, any resulting shell would also provide access to existing robust statistical evaluation tools which would allow users to evaluate the utility of including the various indicators in their analysis. Lastly, this shell would provide powerful and existing spatial gazetteer referencing and visualization tools which can be used to produce map outputs similar to those discussed in the following section for inclusion in reports and presentations, or to be shared via the Internet and georeferenced into any GIS programme interface.
Virtual Base Maps (VrtlBM) are essentially "canned" compositions of base maps which can be created for individual countries or seamlessly for continental landmasses at a variety of common scales. Because virtual base maps contain georeferencing information, they can be: utilized on IMS servers; viewed within almost any GIS environment; accessed in either stand-alone image viewers or most Internet browsers; or integrated into many hand held GPS units or notebook computers linked to a GPS.
The process of creating VrtlBMs usually employs a cookie cutting-like process for the creation of a set of georeferenced images which when combined, via either image catalogues or actually post processed into a mosaic, create a seamless image backdrop. When combined into an actual mosaic, in order to decrease the size of the resulting virtual base map, compression formats such as LizardTech's MrSID or Earth Resource Mappings ECW format can be used.
A very early example of a virtual base map created in 1997 for Africa, entitled AfriView, can be seen at www.sdsmap.com\afriview. AfriView uses an image catalogue approach to allow users to zoom in or out between the four main VrtlBM layers and to enable panning across each individual layer. The base images comprising the variously scaled base maps of AfriView were later mosaiced into a truly seamless VrtlBMs using the MrSID format covering continental Africa at the scales of 1:6 million, 1:3 million, 1:1.5 million and 1:750 000 for the FAO AWRD effort.
The use of compression formats such as MrSID, allows users to more effortlessly pan and zoom across and then potentially between VrtlBMs at different scales. Additional benefits of the use of compression formats, include: faster IMS serving of base maps; better integration with GPS units; and the optimized representation of the base map at scales far smaller than the base scale of the original images.
The overall quality of virtual base maps is a function of potentially two factors. The first of these is the relative quality of the base georeferenced images output from the GIS as measured in dots-per-inch (DPI). For example, the DPI used for the images of AfriView was relatively low at 120 dpi. The use of a relatively higher DPI between 150 dpi and 300 dpi would have significantly improved the quality of text, line, and feature shading at the cost of larger image sizes. The increase in image sizes can be addressed again by the use of compression formats, leading to the second factor which is the ratio used for the overall compression. The higher the ratio used, the smaller the resulting file, but at a cost to the overall quality of the VrtlBM when viewed at scale.
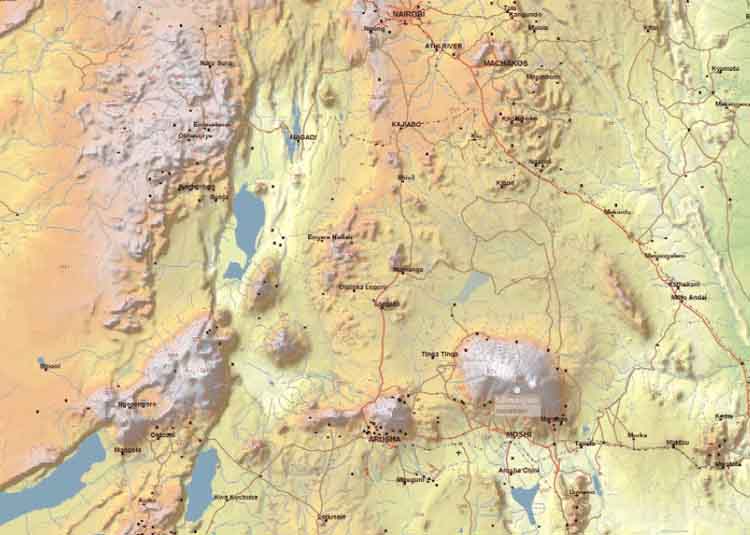
Figures 14.1a - 14.1c on the following pages demonstrate the base data components required for making a VrtlBM. The area surrounding Mount Kilimanjaro in northern Tanzania is again used in these graphics. Although the figures on the following pages include only baseline vectors derived from the VMap0/DCW and a 2.5d colour hillshade image, literally any of the data represented in the inventory could be included in a VrtlBM. Figure 14.1c also includes the NGA-GNS gazetteer location for Mount Kilimanjaro. VrtlBMs represent a very simple and cost-effective way to provide rapid spatial referencing when used in conjunction with gazetteer data such as the NGA's GEOnet database: on-line using IMS server interfaces; on the desktop using a "free" mapping programme such as ArcExplorer or even common Internet browsers; or again via handheld GPS units or those linked to a laptop computer.
Once the baseline data are available and appropriate legend classifications have been developed to represent each feature data class, the LOE required to create VrtlBMs becomes a function of the relative DPI used for the output of the base images and then the number of VrtlBM layers being created. For example, the creation of four seamless VrtlBM layers at the scales of: 1:6, 1:3 and 1:1.5 million, and 1:750 000 covering continental Africa and Madagascar at 150 dpi would require 1.5 days. This LOE would likely double to just less than three days if 300 dpi or 450 dpi images were to form the image baseline.
Figure 14.1a
Base vector layers comprising a 1:1.5
million scale Virtual Base Map
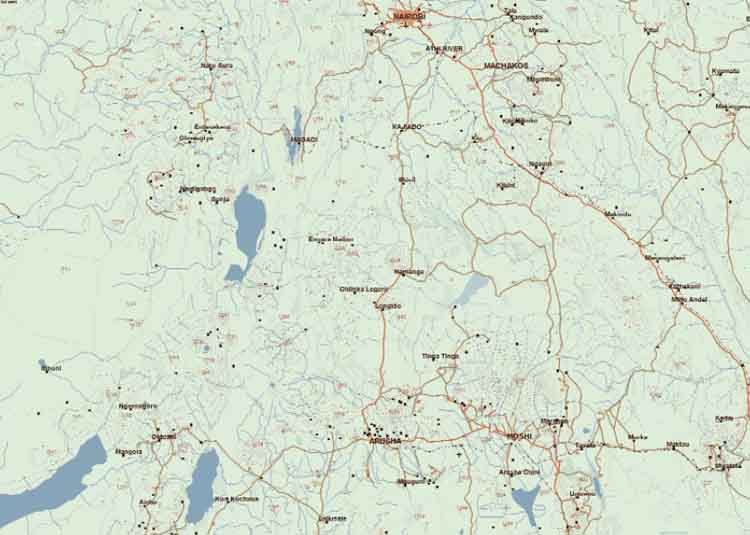
Figure 14.1b
Base hillshade background image layer
comprising a 1:1.5 million scale Virtual Base Map
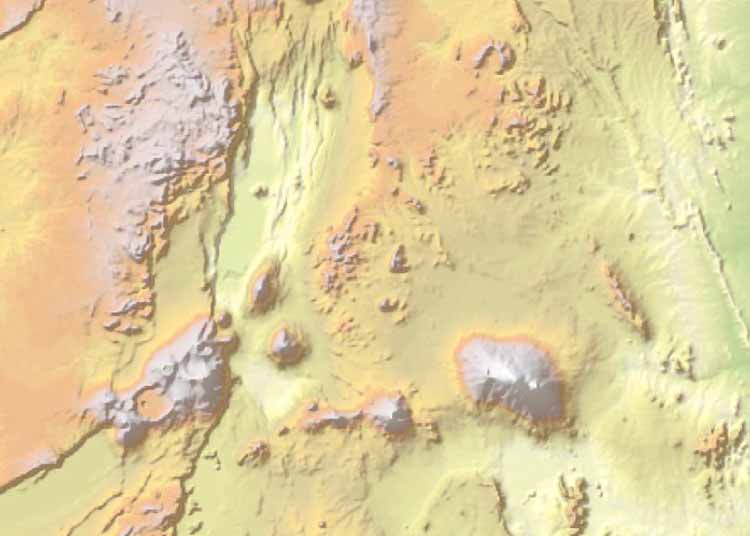
Figure 14.1c
1:1.5 million scale Virtual Base Map for
the area surrounding Mount Kilimanjaro
|
[31] Disappointingly,
although AEZ composite suitability layers can be used as inputs into economic
models as surrogate indices for a number of economic factors, e.g. in
cost-benefit analyses and input-output models, in practice the compositing of
multi-sectoral data has yet to make extensive inroads into analytical models
outside of the GIS environment. [32] The World Water Assessment Programme (WWAP) serves as an "umbrella" for coordination of existing UN initiatives within the freshwater assessment sphere. In this regard it will link strongly with the data and information systems of the UN agencies, for example GRID, GEMS-Water, the Global International Waters Assessment (GIWA) of UNEP, the Global Runoff Data Center (GRDC) of WMO, AQUASTAT of FAO, the International Groundwater Resources Assessment Centre (IGRAC) being established by WMO and UNESCO, the water supply and sanitation databases of WHO and UNICEF and the databases of the World Bank system, (UNH-DSS 2003). |
![]()
![]()
![]()