![]()
![]()
![]()
Vesna Macic*
1. General background
The Republic of Montenegro is situated on the Western part of the Balkan Peninsula and covers an area of 13 812 km2. Montenegro is bordered by the Republic of Serbia (135 km) on the North, by Croatia (14 km), Bosnia and Herzegovina (225 km) on the West and by Albania (172 km) on the East. The length of its coastline is 293.5 km and comprises numerous beaches (73 km in length), approximately ten islands, two lagoons and the large Boka Kotorska Bay. Montenegro is divided into 21 communes, 1 1256 localities and has a population of about 700 000 inhabitants. General data regarding the country are reported in in Table 1.
Table 1. General data on Montenegro.
| Total land | 13 13812 km2 |
| Coastline | 293.5 km |
| Lakes and reservoirs | 355.16 km2 |
| Rivers (more than 40 km in length) | 636 km |
| River basin area | 1212127 km2 |
| Population | about 700 000 |
| GDP Serbia and Montenegro (without Kosovo) 2000 | $US 8670 |
| GDP Serbia and Montenegro (without Kosovo) 2000 per caput | $US 1035 |
Historical documentation confirms that fish and some representatives of the mollusc family and crustaceans have been used as food for many years, especially in the coastal area of Montenegro. However, these were primarily organisms caught or collected in their natural habitat, although there are indications that there was also some kind of primitive husbandry of oysters and mussels. Due to the specific conditions of abiotic and biotic factors in the area of Boka Kotorska Bay, this coastline differs from that in the open part of the Adriatic, and due to its richness and diversity of wildlife, it has been so far the one most studied. Although edible shellfish represented a very interesting object for study,because of their economic value, intensive studies have been undertaken. In 1966 mussels started to be industrially farmed in Boka Kotorska, Kukuljina and Tivatski Bays (Stjepčević, 1974). Although oysters were also popular as food, they were not accepted as a suitable farmed product as there was not enough fry in Boka Kotorska Bay, and it was too difficult and expensive to repeatedly import the product from other areas (such as Malostonski Bay in Croatia) (Stjepčević, 1967).
Currently there are 12 mussel farms in Montenegro and these are all situated in Boka Kotorska Bay. Their distribution and size are reported in Figure 1 and Table 2.
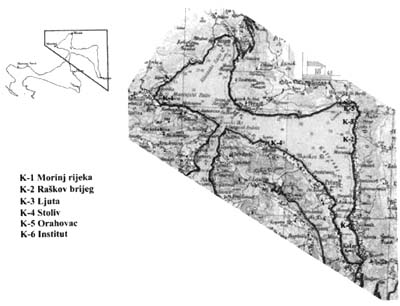
A) Kotor-Risan Bay
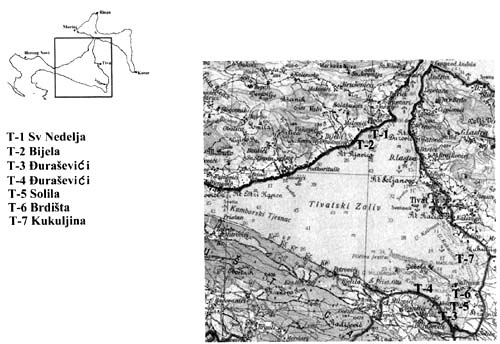
B) Tivat Bay
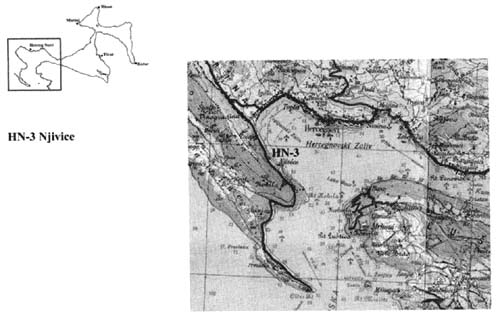
C) Herceg Novi Bay
Figure 1. Mussel farms in Boka Kotorska Bay.
Table 2. Mussel farms in Boka Kotorska Bay.
| Zone | Name of locality | Surface of aqua-zone | Purpose | Beneficiary | |
| HN1 | II | cape Sv. Nedelja | 8000m2 I faze 1500 m2II faze | Farming of mussels | Perović Predrag |
| HN2 | II | cape Sv. Nedelja | 20000 m2 | Farming of mussels | Svilanović Slavo |
| HN3 | I | Njivice | 20000 m2 | Farming of mussels | Pop Miroslav |
| KO1 | II | Kostanjica | 11700 m2 I faze 29900 m2II faze | Farming of mussels | DOO Larry and Brothers Company |
| KO2 | II | Ljuta, Raškov brijeg | 13200 m2 | Farming of fish and mussels | Company Cogi doo |
| KO3 | II | Stoliv | 600 m2 | Farming of mussels | Company Una doo |
| KO4 | I | Orahovac | 8000 m2 | Farming of mussels | Krivokapić Sreten |
| TV1 | I | Solila | 55510 m2 faze A 7840 m2 faze B | Farming of mussels | Dubravčević Danijel |
| TV2 | I | Solila | 1250 m2 | Farming of mussels | Peričić Dragan |
| TV3 | I | Solila | 10000 m2 | Farming of mussels | Dubravčević Zorica |
| TV4 | I II | Solila Brdište | 30000 m2 12500 m2 | Farming of mussels | Company Enex |
| TV5 | II | Kukuljina | 21000 m2 faze A 20000 m2 faze B | Farming of mussels | Company Putača |
It must be noted that there are also several farms that do not possess a licence to carry out this activity, but these are only very small private farms. In the plan of locations where mariculture may be undertaken, there are approximately ten localities in Boka Kotorska Bay and several others in the open sea. As suggested by the Institute of Marine Biology in Kotor the planned locations for mariculture of, mollusc should be within the Bay, while fish farming should be in the open sea. This is suggested because Boka Kotorska Bay is a naturally rich area, partially eutrophied, with weak water circulation, so fish farming in such a zone could additionally threaten survival of existing ecosystems.
On the Montenegrin coast there is only one fish farm within the Boka Kotorska Bay in the locality of Ljuta. In this farm since 1998. seabream (Sparus aurata) and seabass (Dicentrachus labrax) have been reared, with an annual production of 20 tonnes. There are also 20 freshwater fish ponds which rear trout, mostly located in the regions of Podgorica, Bijelo Polje and Nikšić. Some fish ponds are about 25 to 30 years old, 18 of them are in the private sector and 2 are mixed owning (public and private property) Herewith below is a map of Montenegro (Figure 2) showing the localization of fish farms.
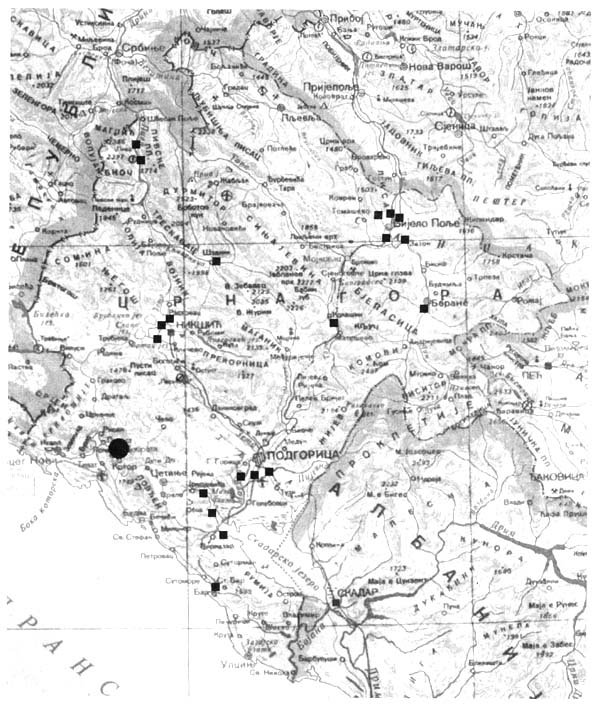
Figure 2. Map of Montenegro showing the localization of fish farms (• sea water ■ fresh water).
2. Characteristics of the sector
The first experimental parks led by the Institute for Marine Biology in Kotor were made in Boka Kotorska Bay (1966) in three localities: Orahovac, Morinj and Kukuljina, composed of overhanging wreaths (for oysters) and a series of stage sifters (for mussels) (Stjepčević, 1974). Pillars and horizontal holders in the parks were made of railroad rails F 18 kg l/m. In each of the three localities there were two experimental parks (a=5×20m) for farming of oysters and mussels, respectively. Each experimental park had four beds (Figure 3). In these parks, mussels were successively introduced in a series of stage sifters made of plastic and equipped with lids. The dimensions of a single sifter were 50x50x15 cm. Mussels were introduced in three-monthly intervals (from May 1966 to March 1967) and during each interval six series of stage sifters were planted (a single series contains three sifters on different depth levels of 0.5, 1.5 and 2.5 m respectively. In each locality, in all four beds within the experiment, a total of 21 600 individual mussels were placed. The musseles used for experiment were collected in the Bay, within autochthonous populations. One hundred mussels of an average age between 18 to 20 months and length of 30–410 mm were introduced in each sifter (Stjepčević, 1973). Due to the specific conditions in the area mussel farming and the overall process of production was carried out in two phases: Phase 1 included capturing and farming of the spat; and Phase 2 was placing the spat in wreaths and farming it to market size. Some of the results of this experiment are shown in Tables 3, 4, 5 and 6.
Figure 3. Schematical representation of a park for mussel and oyster farming (viewed from above).
Table 3. The results of breeding mussels in Orahovac.
| ORAHOVAC | No. Pieces/100g | Mean weight of biomass (g) |
| I seedling | 8.7 | 11 378 |
| II seedling | 10.8 | 9 218 |
| III seedling | 12.8 | 7 772 |
| IV seedling | 11.3 | 8 820 |
Table 4. The results of breeding mussels in Morinj.
| MORINJ | No. Pieces/100g | Mean weight of biomass (g) |
| I seedling | 10 | 9 919 |
| II seedling | 11.5 | 8 659 |
| III seedling | 10.8 | 9 231 |
| IV seedling | 15.6 | 6 404 |
Table 5. The results of breeding mussels in Kukuljina.
| KUKULJINA | No. pieces/ 100g | Mean weight of biomass (g) |
| I seedling | 26.5 | 3 766 |
| II seedling | 25.6 | 3 900 |
| III seedling | 23.5 | 4 242 |
| IV seedling | 27.9 | 3 573 |
Table 6. Some nutritive values for mussels in Boka Kotorska Bay.
| Mussels | H2O | Dry weight | Glycogen | Lipid | Protein |
| ORAHOVAC | 77.84% | 22.15% | 4.53% | 4.51% | 11.2% |
| KUKULJINA | 80.68% | 19.31% | 2.90% | 3.05% | 11.18% |
The area chosen for experiment presented good conditions for industrial farming of mussels. Areas within Boka Kotorska Bay such as: Kukuljina and Krtole (within Tivat municipality) and northwestern part of Risan (within Kotor municipality) are favoured for this purpose as well. Kukuljina zone spreads on 428.2 ha, and at least 70 ha are suitable for stationary type of oyster and mussel breeding. Krtole zone spreads on 231 ha and for this type of oyster and mussel breeding at least 60 ha of sea surface is required. The paper by Stjepčević (1974): Ecology of Mussel (Mytilus galloprovincialis Lamk.) and Oyster (Ostrea edulis L.) in Cultures of Boka Kotorska Bay, points out that the capacities of the Bay are such that it could become one of the biggest mussel production centres in the Adriatic.
It is estimated that the possible quantity of farmed mussels in Boka Kotorska Bay is about 100 t. However, there is no control of the quantity of farmed mussels even in the official farms. The reason for this is that there is neither a depurification centre nor any other collecting point, and the products are therefore either sold directly in the farming localities and local markets or sent to markets in Serbia.Besides the lack of evidence regarding mussel production, there is also no adequate sanitary control. Microbiological controls of the seawater in farming localities are usually carried out by the Institute for Marine Biology whilst those relating to the presence of parasites or harmful material are most irregular.
From the experiments made in each of the three above-mentioned localities in Boka Kotorska Bay in 1966, one park was reserved for oysters which were introduced and cemented on wreaths made of coconut fibre. Phase 1 included catching the fry on bunches of stalks; Phase 2 was the processing of bunches and forming wreaths with separated branches; and Phase 3 was the removal from the branches, cementing and weaving into definitive wreaths. On wreaths with separated branches (Phase 2), 14 400 specimens of autumn fry (40 mm in length) and 7 200 specimens of spring fry were selected for cementing. During the whole experiment 21 600 specimens were introduced. From this group, 180 wreaths with cemented oysters were formed for analyses in monthly and bimonthly intervals for all three localities (Phase 3). Each inhabited wreath was 2.5 m long with 120 specimens of cemented oysters.Some of the results of this experiment are shown in Tables 7 and 8.
Table 7. The results of breeding oysters in Boka Kotorska Bay.
| Oysters (30 month old) | No. Pieces /100g | Mean weight (g) | Mean weight of biomass (g) |
| ORAHOVAC | 14.2 | 46 871 | 7.025 |
| MORINJ | 15 | 44 692 | 6.730 |
| KUKULJINA | 20.4 | 37 047 | 4.904 |
Table 8. Some nutritive values for oysters in Boka Kotorska Bay.
| Oysters | H2O | Dry weight | Glycogen | Lipid | Protein |
| ORAHOVAC | 79.2% | 20.7% | 6.1% | 1.7% | 10.2% |
| KUKULJINA | 80.5% | 19.45% | 5.5% | 1.5% | 9.3% |
From this experimental farming (1966), it was ascertained that the greatest vermin were the sea stars (Asteroidea) (Stjepčević, 1974). They grouped together on the sea bottom near to the sea beds, in greater quantity than in other places. This can easily be explained by the fact that during farming a small number of mussels and oysters fall off the stage sifters and wreaths. During the work in the parks in Orahovac and Morinj, the wreaths with cemented oysters were sometimes overgrown with mussels and therefore became rather heavy (more than 65 kg), detaching themselves from the holders and falling down to the sea bottom. After only 3 to 4 days one of these wreaths was retrieved and about 80 percent of the mussels had been eaten, mostly by the sea stars. Apart from this, sea stars were often found even in stage sifters where mussels had been farmed. It is assumed that it was actually plankton larvae of the sea stars that got into the sifters and developed there, as some of them were smaller than those found on the sea bottom under the parks. Fortunately, there were only 11 similar cases in all three localities. However, within the farming system based on wreaths, sea stars cannot make a greater damage than that already mentioned, except in cases when they are very numerous and can destroy oyster fry on the stems as well as on the natural beds of these organisms. It is estimated that one medium-size sea star can destroy at least 5 one-year old oyster daily. Therefore, if it is active for 7 to 8 months a year, each sea star destroys at least about 1 200 oysters.
In the experimental farming it was recorded that certain representatives of Gastropoda (Murex trunculus L., M. brandaris L., Ocenebra erinacea L .) may also provide damage. However, more damage is observed if the sifters are placed on the sea bottom, while in industrial farming of mussels and oysters they almost present no danger. With respect to Other destructive species, worth mentioning are several species of fish (Trygon pastinaca, Chrysophrys aurata, Pagrus vulgaris, Charax puntazzo and Sargus rondeletii), but the damage which may occur is much less. Also small indirect may be caused by sea urchins (the edge of cemented oyster's shell can be eaten away by urchins) (Stjepčević, 1973).
Another serious problem encountered in experimental farming in 1966 and 1967 was epibionts that mostly grow on mussel and oyster shells, depriving them of food. These epibionts also can eat significant quantities of mussel's and oyster's larvae and in that way disturb the full capacity of their development (Stjepčević, 1974). It was a regular occurrence that a mass growth on oysters leads to a high mortality rate. For example, on wreaths with cemented oysters that remain in parks for more than 12 months, the mortality rate was up to 85 percent (especially in the localities of Orahovac and Pririnj). On the experimental areas, mussel was primarily a main competitor of food for oysters, although both have many common competitors such as some Ascidians, various Bivalvia, certain Porifera and numerous Polychaeta worms, Cirripedia and Algae (Stjepčević, 1974).
During the three years of study (from 1968 to 1970) there were three recorded representatives of parasitic fauna for the studied mollusc species on the experimental farms in Boka Kotorska Bay (Stjepčević et al., 1978). With respect to mussels, there was a greater quantity of hydroid polyp Mytilhidra (Eugymnathea) polimanti Cerruti, recorded for the first time in the Adriatic. According to the research, this parasite was introduced in 1967 when the owner of a mussel farm in Kukuljina imported 900 kg of mussel fry from Tarant Bay in Italy in order to determine their quality. The individuals were introduced immediately after import, without prior controls, and grew to market size (12–18 months). It is assumed that during this process, a parasite Mytilhidra polimanti was introduced together with the mussel fry, and later spread throughout Boka Kotorska Bay, where it became very dangerous for the natural survival of mussels. On oysters in all three localities there was a parasitic annelid Polydora hoplura Claparede, which was also the first record for this part of the Adriatic. It should be noted that at the beginning of the oyster farming experiment, fry was imported from Malostonski Bay (Croatia) in large quantities (e.g., 100 stems - with 1 500 to 2 500 individuals on each stem). The reason for this is due to the fact that the natural oyster beds in Boka Kotorska Bay were very degradedand the quantity of fry was insufficient; so several hundred sexually mature specimens were imported. It may be assumed that even before the introduction of the fry and sexually mature specimens from Malostonski Bay, the parasitic polichaete Poydora hoplura was already present in the natural beds in Boka Kotorska Bay, but the introduction of the new specimens also contributed to its further spreading.
In 1998, with the agreement of the Ministry for Agriculture and Water Industry, the private fish farm in Boka Kotorska Bay imported from Italy 30 000 specimens of seabream and seabass fry.. It was also agreed that a further 600 kg or 200 000 specimens of fry would be imported but that quota has not yet been fulfilled. The annual import of fish fry until 2003 is shown in Table 9.
It should be noted that in Montenegro there are no proper conditions for a complete control of imported goods. However, veterinary experts take samples and control specimens in order to determine the possible presence of parasites and vermin, but there are no conditions for quarantine keeping of imported fry for a period of 21 days. Therefore, an agreement by the the Ministry in 1999 to import fish fry included the obligation for the owner to hold the fry for 21 days in his own isolated basins on land. If within that period there was no disease signs or outbreaks, fry could be transported in cages located at sea.
Table 9. Import of fish fry per year.
| Year | Imported quantity (Number of specimens) |
| 1999 | 10 000 |
| 2000 | 25 000 |
| 2001 | 21 000 |
| 2002 | 21 000 |
| 2003 | 35 000 |
| Total | 112 000 |
This fry had been farmed with the help of imported fish food that had passed a regular custom control. The specimens that reached the commercial size were taken either to Montenegrin markets or exported, mostly to Serbia. Control of these products, both in import and export, is carried out by the National Institute for Health and the CETES Centre for Ecotoxicological Research. There is no information available on import and export data principally because they are not classified.
Regarding freshwater fish farming, there are 20 ponds in Montenegro (Figure 2), 18 of them in the private sector and 2 are mixed owning (public and private owning). The projected capacities of these ponds are about 700 t of trout per year, however so far only 450 t/year has been achieved. The reasons for such a small production when compared with the planned capacities are primarily due to lack of funds and also to the fact that some of the ponds are 25 to 30 years old and have old facilities which can cause the loss of product due to poor water management. Also, the limited size of freshwater fish markets, strict export regulations, make investing in freshwater fish farming risky.
3. National policy
Fisheries and mariculture come under the auspices of the Fisheries Department of the Ministry for Agriculture and Water Industry of Montenegro. A specific national mariculture development plan has yet to be developed. Some basic principles for sustainable and responsible mariculture have been established in the new law on marine fisheries. Until October 2003 there was a legislative framework from the year 1992, but now a new law on marine fisheries has been accepted (Služ. List, 2003). Some of its characteristics that influence mariculture will be presented. Mariculture, following the new law, primarily includes controlled reproduction and farming of fish and other marine organisms. This activity is allowed to industrial companies and businesses that have registered for that activity, and who have qualified personnel at expert level for this type of farming, or are qualified at expert level themselves, and must fulfil the technological conditions of farming. The Ministry for Agriculture and Water Industry determines the locations and conditions for the establishment of fish farms and other marine organisms, with the application of an adequate technology of farming, after suggesting appropriate scientific institutions and agreement by the Ministry of Marine Transport, Ministry of Health and Ministry of Environmental Protection and Spatial Planning. If for the use of some locations it is necessary to use the sea coast, there should be an agreement from a public firm “Morsko Dobro”, and for the use of the location for mariculture activities a concession fee must be paid. Also, in order to get contracts for fish farming, environmental impact assessment should be performed (the improvement of legislative framework currently is in process.) Farming of marine organisms may be carried out only in locations where a specific contract has been stipulated for the farming of fish or other marine organisms that are cited in that contract. Locations of farming must be properly marked, and fishing is forbidden within the zone of 100 m from the marked position of the farm. Also approach to the farm from the sea, within the zone less than 50 m from the marked area, without permission, is forbidden.
4. Production and market
In Montenegro neither fishing nor mariculture is much developed, and statistical data. are not well organized. One of the reasons for this is the inefficiency of the old fisheries law, mainly due to inappropriate penalty regulations.
Appropriate data for employees, and marine crafts in marine fishing, are accessible but for the mariculture sector there are no data available. According to the Statistical office, catches and production of marine fish, crustaceans, shells (bivalves) and other molluscs from 1992 to 2001 are shown in Table 10. Accordingly, the same office in the year 2000 showed a gross domestic (material) product by establishment principle for FR Yugoslavia were 348 887.5 million dinars and for Montenegro 33 33498.7 million dinars. From that amount fishing in FR Yugoslavia contributes with 119.0 million dinars and in Montenegro with only 15.0 million dinar. (Statistical Yearbook of Yugoslavia, 2002).
Table 10. Catches and production of marine fish, crustaceans, shells and other molluscs from 1992 to 2001 (in kg).
| Year | Total | Pelagic fish | Other fish | Crustaceans | Shells | Other molluscs | |
| Total | of which sardine | ||||||
| 1992 | 225 547 | 113355 | 74 460 | 96042 | 1 840 | 5 625 | 8 685 |
| 1993 | 286 494 | 130396 | 67 850 | 114280 | 10 925 | 8 555 | 22 338 |
| 1994 | 263 536 | 112324 | 57 970 | 123965 | 6 325 | 3 585 | 17 337 |
| 1995 | 374 180 | 151095 | 56 680 | 173560 | 14 649 | 7 520 | 27 356 |
| 1996 | 383 175 | 131135 | 41 760 | 207335 | 10 730 | 1 990 | 31 985 |
| 1997 | 373 152 | 128430 | 45 190 | 199270 | 10 182 | 2 375 | 32 895 |
| 1998 | 416 569 | 149980 | 48 960 | 215117 | 12 652 | 2 890 | 35 930 |
| 1999 | 431 347 | 164882 | 49 430 | 215540 | 9 880 | 3 735 | 37 310 |
| 2000 | 431 358 | 146313 | 35 935 | 229835 | 13 145 | 3 200 | 38 865 |
| 2001 | 445 310 | 150685 | 27 625 | 236475 | 15 665 | 2 285 | 40 200 |
Fish import and export data in Montenegro are presented in Table 11. It is evident that EU import barriers cause very weak export which means that the total fish production is sold on the domestic market. Due to an increase in tourism there has been a bigger request for sea products, but the present market in Montenegro is unable to supply this heavy demand for mussels. Regarding other fish products, the evaluation of seabass and seabream farming are 20 t/year (one part is exported to Serbia). Since 2003, 18 tonnes of trout were exported to Serbia, 9 to Kosovo and 11.5 to Bosnia and Herzegovina.
Table 11. Fish import/export data in Montenegro for 2001 (thousands. $US).
| Export | Import | |
| Total | 177 960 | 529 409 |
| Fish | 4 | 1 862 |
At present there is only one factory for the partial processing of freshwater fish products, but as its capacity is insufficient and the fish are still not popular on the market, this adds another difficulty in fish farming. Disorganized processing and trading, are usually the main reasons for high prices. Also, this is one of the reasons for a low per caput fish consumption (non-official estimate is less than 2 kg/year).
Labelling and eco-labelling certifications of aquaculture products are non-existant, but the responsibilies for the control of these products lies with the Ministry of Health and the CETES Centre for Ecotoxicological Research.
5. Relationship with capture fisheries
There is little knowledge available on interactions between aquaculture and capture fisheries. Probably this is because of the concentrated aquaculture areas in the limited zones of Boka Kotorska Bay. Marine aquaculture has shown a great expansion over the past few years and because of the environmental friendly policy the choice of sites for mariculture is becoming more important and probably the main interactions between these activities will be in competition for space. However, not just interactions between mariculture and capture fisheries but also between tourism, urbanization and other activities are playing an important role in occupying the coastal zone. Because of this the integrated coastal zone management is necessary for the sustainable development of aquaculture.
As mariculture is a new activity in Montenegro, some of the research carried out by the Institute for Marine Biology in Kotor, is directly connected with the possibilities of capture fisheries development.
The first is (together with the Federazione Italiana Maricoltori-Trieste (Italy)) the monitoring of mussel growth in the experimental park near the Institute (Kotor Bay). For the past two years, this park has been modernized with new floating devices that now support two rows of longitudinally placed ropes, which in turn hold the dangling stems. Therefore, it is possible to compare these results with those from former years when another way of farming was used.
However, during the period from 1999 to 2002 there was an intensive study on fish fry for some economically important fish species like: Mugil cephalus, Chelon labrosus, Liza ramada, Liza aurata, Liza saliens (Mićković, 2000, Mandić et al.,2003, Mandić et al.,2004.). Regarding that in Montenegro there is no artificial production of fry, possibilities for commercial farming also includes the determination of areas suitable for the capture of certain species of fry. But this is just possibility for now, and for eventual future sustainable utilization more investigations are required.
The characteristics of the life cycle of eel (Anguilla anguilla L. ) were also studied in order to enable a proper estimate of the resources and to sustain and enhance its culture(Hegediš, et al.,1996, Hegediš et al.,2001).
“Development of new technologies in marine industry of food and pharmacy products” is a part of the strategic developmental program of Institute of Marine Biology in Kotor, with a goal to accelerate development of aquaculture in Montenegro. For that purpose an experimental floating cage was set up in order to determine possibilities of farming rainbow trout in brackish waters of Boka Kotorska Bay. Results and measurements during the six-month period 2001/02 showed that the growth of rainbow trout is much greater in the sea conditions than in freshwater fish farms or in floating cages on Skadarsko Lake (Kljajić, et al., 2002).
To conclude, nowadays in Montenegro freshwater fish farming is developed on average level, while farming of sea fish is almost non-existeent so there is no conflict between aquaculture and fishery.
6. References
Hegediš, A., Mićković, B., Mandić, S., & Anđus, R.K. (2001) Characteristics of the Pigmentation of Glass Eels During their Migration from the Adriatic Sea to River Bojana. Prirodni potencijali kopna, kontinentalnih voda i mora Crne Gore i njihova zaštita, Žabljak, Crna Gora, 20.-23. VI 2001. Book of Abstracts: p.126.
Hegediš, A., Nikčević, M., Mićković, B., Damjanović, I., & Anđus, R.K. (1996) A survey of European eel Anguilla anguilla (L. 1758) habitats and running waters along the South Adriatic coast of Montenegro. Publ. Espec. Inst.Esp. Oceanogr. 21: 211–219.
Kljajić, Z., Joksimović, A., Micković, B., Rašović, A., & Mandić, S. (2002) Farming of rainbow trout in Boka kotorska Bay. V Simpozijum o ribarstvu Jugoslavije, Bar, Jugoslavija, 2–6. X 2002. Book of Abstract: p. 14.
Mandić, S., Kljajić, Z., Joksimović, A., Mićković, B., and& Hegediš, A. (2003) Vodni potencijali Šaskog jezera sa ciljem razvoja akvakulture. 32. Konferencija o aktuelnim problemima korišćenja i zaštite voda, Zlatibor, Srbija i Crna Gora, 3–6. jun 2003. Zaštita Voda 2003: 99–102.
Mićković, B., Hegediš, A., Nikčević, M., Mandić, S., & i Borović, I. (2000). Reka Bojana kao prirodni resurs juvenilnih formi cipola za potrebe akvakulture. IV jugoslovenski simpozijum “Ribarstvo Jugoslavije”. Vršac, Zbornik radova: 56–61.
Mićković, B., Hegediš, A., Nikčević, M., Mandić, S., & Borović, I. (2000) Reka Bojana kao prirodni resurs juvenilnih formi cipola za potrebe akvakulture. IV Jugoslovenski simpozijum Ribarstvo Jugoslavije, Vršac, Jugoslavia, 20–22. IX 2000. Zbornik: 56–61.
Službeni List Republike Crne Gore br. 55., Zakon o morskom ribarstvu. 1 October 2003.
Statistical Yearbook of Montenegro (2002). Statistical Office of the Republic of Montenegro.Mandić, S., Kljajić, Z., Joksimović, A. and Mićković, B. (2004). Uslovi za razvoj marikulture u priobalnim vodama crnogorskog primorja. 33. Konferencija o aktuelnim problemima korišćenja i zaštite voda, Borsko jezero, Srbija i Crna Gora, 8–11. jun 2004. Zaštita Voda 2004: 419–422.
Statistical Yearbook of Yugoslavia (2002). Statistical Office of Serbia and Montenegro http://www.szs.sv.gov.yu/
Stjepčević, J. (1967) Biologija i tehnološki proces uzgoja jadranske kamenice (Ostrea edulis L.). Poljoprivreda i šumarstvo XIII, 4: 33–48.
Stjepčević, J. (1973) Prilog proučavanja štetočina i kompetitora (epibionti) kod dagnji (Mytilus galloprovincialis Lamk.) i kamenica (Ostrea edulis L.) u eksperimentalnim gajilištima Bokokotorskog zaliva. Studija Marina No. 6: 13–28.
Stjepčević, J. (1974) Ekologija dagnje (Mytilus galloprovincialis Lamk.) i kamenice (Ostrea edulis L.) u gajilištima Bokokotorskog zaliva. Studia Marina 7: 5–164.
Stjepčević, J., Stjepčević, B., & Mandić, S. (1978) Novi predstavnici parazitne faune kod dagnje (Mytilus galoprovincialis Lamk.) i obične pljosnate kamenice (Ostrea edulis, L.) u eksperimentalnim gajilištima Bokokotorskog zaliva. Simpozijum stanje, zaštita i unapređenje čovjekove sredine u Crnoj Gori, Herceg Novi, Yugoslavia, 6 -8 Oktobra
Annex 1: List of Institutions involved in Aquaculture Research Activities
Ministry for Agriculture and Water Industry (Podgorica)
Ministry of Environmental Protection and Spatial Planning (Podgorica)
Institute for Marine Biology (Kotor)
Republic Institute of Health (Podgorica)
CETES Center for Ecotoxicological Research (Podgorica)
Public Firm “Morsko Dobro” (Budva)
Center for Environmental Protection (Podgorica)
Office for the Consultation of Mariculture Activities (at Institute of marine biology Kotor as result of Cooperation between the Italian Region (Friuli-Venezia Giulia), Federation of Italian Mariculturists (Trieste) and the Institute of Marine Biology (Kotor)).
Mitja Kadoič*
1. General background
1.1 Geography, climate and population
Geography
Slovenia became independent in 1991 and from 1 May 2004 will be a member of the Europen Union (EU). The country is divided into 193 municipalities, but in the near future between 5 and 13 administrative regions will also be established.
Slovenia is situated at the crosspoint between Central Europe and the Balkan Peninsula (Figure 1). Its surface area is 20273 km2, from which 63.3 percent is covered by forests, 30.5 percent by agricultural areas and 0.7 percent represent inland waters. The remaining area comprises roads, railways and barren land. Slovenia borders on the North with Austria (330 km in length of which 79 km border on rivers); on the East with Hungary (102 km in length of which 13 km border on rivers); on the West with Italy (280 km in length of which 31 km border on rivers and 48 km border the sea) while the South has the longest border of 670 km with Croatia (290 km border on rivers but the sea border has not yet been defined).
Slovenia has quite an heterogeneus topography covering a relatively small surface area. On the east side where the land is flat intensive agriculture takes place. The north/east, central and southern part has hilly areas and the north/west covers mountainous areas (the Alps) while the south/west with the Karst has a short coastline (46.6 km).
Climate
Being placed between the Adriatic Sea on the south/west, the Alps on the north/west, the Dinaric hills on the south and the Pannonian land on the east, Slovenia has a heterogeneous climate. The climate experienced is continental in the eastern and central boundary; alpine in the north/west; and submediterranean in the south/west. Data are presented in Table 1. All data can vary significantly as there are differences in microclimate also within regions.
In the last decade, weather conditions changed rapidly. There were several years when a dry, hot and long summer was experienced. Dry and hot summers can also have a big influence on freshwater aquaculture. Salmonid rivers become too warm (in extreme conditions the water temperature can also reach 24 °C) and the water flow can decrease drastically. These unforeseen circumstances can cause serious problems in salmonid breeding. Farmers have big losses due to lack of growth and mortality because of the high water temperature. Difficult weather conditions can have a negative influence even on the breeding of carp and other cyprinids.
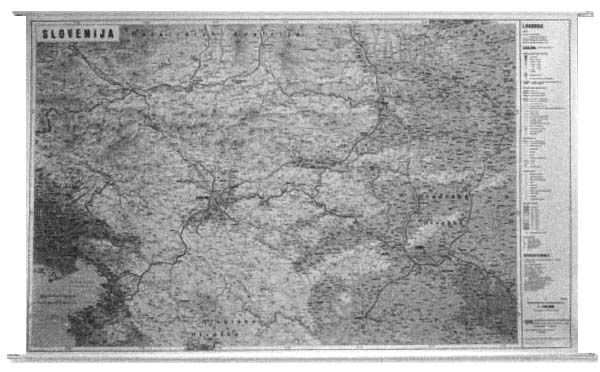
Figure 1. Map of Slovenia
Table 1. Average temperature, precipitation and humidity in different Slovenian Regions.
| Region | Temperature (°C) | Precipitation (mm/m2) | Humidity (%) |
| East | 11.2 | 750 | 78 |
| Central | 11.5 | 1 300 | 77 |
| West/West | 8.5 | 1 500 | 80 |
| South/West | 13.5 | 1 200 | 73 |
Source: Ministry of Environment, Spatial Planning and Energy - Environmental Agency of the Republic of Slovenia
Extreme high water temperatures in ponds can lead to lack of oxygen. On the other hand marine aquaculture is more affected by cold winters. Winters on the Slovenian coastline can be relatively harsh, and the water temperature can drop to - 8°C and at worst for 2 months to even - 10°C. In such low water temperatures the breeding of seabream can become problematic.
Population
According to the final data of the Census undertaken in 2002, the population in Slovenia was of 1964036 inhabitants. However, since the 1991 Census the population increased by 2.6 percent. The increase by 50681 persons is the result of immigration from abroad (28000 persons since 1991) and the legalization of residence of former Yugoslav citizens who already lived in Slovenia during the 1991 Census. This increase between the last two census had a negative result by 3 500 inhabitants.
Data regarding the population in Slovenia is shown in Table 2.
Table 2. Distribution of population by gender, urban, rural, coastal and inland and population density (inhab/km2).
| 1991 | % | 2002 | % | |
| Total Population | 1 913 355 | 100 | 1 964 036 | 100 |
| Man | 923 643 | 48.3 | 958 576 | 48.8 |
| Woman | 989 712 | 51.7 | 1 005 460 | 51.2 |
| Urban | 971 502 | 50.8 | 997 772 | 50.8 |
| Rural | 941 853 | 49.2 | 966 264 | 49.2 |
| Coastal | na | - | 78 846 | 4.0 |
| Inland | na | - | 1 885 190 | 96.0 |
| Density | 94.5 | 96.9 |
Source: Statistical Office of the Republic of Slovenia (SORS).
1.2 Land and water resources
Slovenia has many inland waters although these are not equally distributed around the country. Land and water resources are presented in Table 3.
From this data it is clear that in Slovenia inland freshwater aquaculture resources are more important than the short coastline.
Table 3. Land and water resources.
| Item | Area (km2) | Length (km) | Capacity (km3) |
| Total land | 20 256 | ||
| Coastline | 46.6 | ||
| Lagoon area | - | ||
| Lakes and reservoirs | 53.43 | 0.35 | |
| Rivers and streams | 26 989 |
Source: Ministry of Environment, Spatial Planning and Energy - Environmental Agency of the Republic of Slovenia.
1.3 Selected economic and human indicators
After its independence in 1991 the Gross Domestic Products (GDP) drastically decreased, since its economy lost important markets in the former Yugoslav Republics.However, soon after the Slovenian economy started to improve and it began to focus more on the EU countries.During the past years, a loss was again felt in the southern markets on the Balkan Peninsula. From 1994 to 2000 the yearly GDP growth varied from 3.5 to 5.2 percent and in fact fell to 2.9 percent in the last two years. Table 4 reports some economic and human indicators.
Table 4. Selected economic and human indicators in 2002.
| GDP ($US) | 21 960 000 000 a |
| Agricultural GDP ($US) | 590 168 000 a |
| GDP per caput income ($US/ caput) | 11004 a |
| Human Development Index (year 2001) | 0.881 b |
a Source: Statistical Yearbook 2003
b Source: Human Development Report 2000–2003
1.4 Fish food consumption
Table 5 clearly shows that fish consumption in Slovenia is not high. Pork, beef and poultry meat are still preferred to fish. During the past few years there has been a slight increase in fish consumption and the trend for healthier food in general, is leading to an expected increase of aquaculture products.
Table 5. Apparent fish consumption and contribution of aquaculture.
| Production ('000 t) | Total production ('000 t) | Exports ('000 t) | Import ('000 t) | Total supply ('000) | Per caput supply (kg) | |
| Capture fisheries (food fish) | 1 774 | 3 035 | 0.604 | 7 792 | 10 223 | 5.21 |
| Aquaculture | 1 261 |
Source: SORS
From the total fish consumption only 12.3 percent is produced by domestic aquaculture and the remainder is imported for the markets (Table 5). There are plenty of oppurtunities for aquaculture growth but there are also some limitations (e.g., short coastline, limited inland water resources, etc.) (Table 6).
Table 6. Main species and production systems currently in practice.
| Common name | Species | Production facilities | Market focus (export/domestic) |
| Rainbow trout | Oncorhynchus mykiss | concrete raceways, earth ponds | domestic |
| Common carp | Cyprinus carpio | warm water ponds, accumulations | domestic |
| Seabass | Dicentrarchus labrax | Cages | domestic |
| Seabream | Sparus auratus | Cages | domestic |
| Mussel | Mytilus galloprovincialis | Trays | domestic |
2. Characteristics of the sector
2.1. Historical data
Historical data regarding aquaculture in Slovenia dates back to the Middle Ages. Since then several documents have been published regarding freshwater aquaculture. Only ponds were used for extensive carp breeding (and other cyprinids) and fish was eaten by the affluent society and clergy mainly at special religious feasts.
Towards the end of the nineteenth century, more intensive aquaculture systems were introduced. In 1881, Professor Ivan Franke made his first artificial insemination of brown trout (Salmo trutta fario), which is considered the birth date of Slovenian aquaculture. A few years later he also started to work with rainbow trout (Oncorhynchus mykiss). Following this in the twentieth century aquaculture development slowed down, and although some large “cooperatives”, owned freshwater farms (3 coldwater salmonid farms for rainbow trout breeding; and 2 warmwater cyprinid farms), a few small private farms were also created. After 1990 development increased, and in 1991 the Slovenian Government decided to actively invest in aquaculture products - mainly salmonid. A new advisory service for aquaculture was established, and financial support for farmers was obtained. The production of salmonids (95 percent of rainbow trout) doubled in only five years. On the other hand, because of unsatisfactory legislation, production of carp and other warmwater species began to stagnate. At the end of the 1980s and beginning of the 1990s marine aquaculture began on the Slovenian coast. In the mid-1980s a few small production units for molluscs (only Mytilus galloprovincialis) were established. Later in 1990 two commercial farms for seabream and seabass also started production, but unfortunately due to the strong international competition, production decreased rapidly.
Development of the different types of aquaculture farms in Slovenia had to be terminated by region, due to the difficulties encountered. In the north/east region called Prekmurje, the conditions for salmonid breeding are unfavourable and the same applies for warmwater breeding in the north/west and northern regions called Primorska and Gorenjska. In other regions such as Štajerska, Dolenjska and Notranjska salmonid and warmwater fish breeding are practised. Traditionally, people from different regions have different nutritional habits connected to natural sources - in Prekmurje and Štajerska carp and other cyprinids can be found, while in Primorska and Gorenjska mainly trout is reared.
Currently only four types of production can be found in Slovenia:
- coldwater freshwater species - rainbow trout and arctic charr
- warmwater freshwater species - carp, tench, pike perch, pike, catfish, etc.
- warmwater marine species - seabass and seabream
- marine molluscs.
As mentioned previously, dating back to the Middle Ages extensive carp breeding was first developed in ponds. Much later at the end of the nineteenth century carp production in semi-intensive ponds was developed. Warmwater fish breeding in the twentieth century was mainly undertaken in the Štajerska region and on a much smaller scale in the Dolenjska and Notranjska regions. At the end of the 1980s and beginning of the 1990s it seemed as though warmwater fish farming would achieve a higher intensive level of production. As mentioned before, unsatisfactory legislation created an atmosphere where farmers either did not want, or were not able to invest in new technologies and new farms. Therefore, the present day production of warmwater species has begun to stagnate.
However, production of salmonids has a much shorter history. It started at the end of the nineteenth century with semi-intensive production in earth ponds and continued until the 1970s, when a new technology in concrete ponds and the use of complete dry feed for salmonids was slowly introduced. Later in the 1980s and more specifically in the 1990s better facilities were based on concrete raceways and several other ponds were also converted from earth to concrete. Because of the limited number of water resources suitable for the production of salmonid, small- and medium private farms were built (small farms with a capacity of 3 to 15 t/year whilst medium farms with a capacity of 15 to 50 t/year).Only a few farms were constructed with an annual capacity of more than 50 tonnes.
The latest production is marine aquaculture, which never reached great importance at the commercial level. Because of limited natural resources (short coastal area) marine aquaculture has never had a real basis for fast growth. Farms for molluscs and fish are located in the same basin (Piran Basin), where molluscs are produced in a standard manner and fish are cultured in cage systems.
2.2 Aquaculture systems
Aquaculture statistics are recorded by the Statistical Office of the Republic of Slovenia (SORS). In these official statistics freshwater aquaculture is always divided into fish farming for human consumption and for re-stocking and angling. Present day market production for human consumption is mainly carried out by private farms, since production for re-stocking and angling is further divided between the private farms and farms run by local fishing associations and the Fisheries Research Institute of Slovenia.
Slovenia aquaculture can be divided into:
freshwater aquaculture, which is further divided into:
warmwater fish farming
coldwater fish farming
marine aquaculture is also further divided into:
fin fish
shellfish
1) Freshwater aquaculture
a) Warmwater fish farming
Several species are reared in warmwater fish farming. Most important for human consumption and for angling purposes, is the production in polyculture of the following species:
- Carp (Cyprinus carpio)
- Grass carp (Ctenopharyngodon idella)
- Silver carp (Hypophthalmichthys molitrix)
- Bighead carp (Aristichthys nobilis)
- Pike (Esox lucius)
- Catfish (Silurus glanis)
- Pike perch (Stizostedion lucioperca)
- Tench (Tinca tinca).
However on a smaller scale the following species are present as polyculture by-products:
- Prussian carp (Carassius auratus gibelio)
- White eye bream (Abramis sapa sapa)
- Bleak (Leuciscus cephalus cephalus)
- Babusca (Rutilus rutilus carpathorossicus)
- American catfish (Ictalurus nebulosus)
- and others.
For re-stocking purposes there are only small-scale cultures of:
- Frauenfish (Rutilus pigus virgo)
- Barbel (Barbus barbus barbus)
- Nase (Chondrostoma nasus nasus).
The main production of warmwater species is in semi-intensive polyculture farms, and a smaller part is in extensive polyculture ponds. Warmwater fish farms were developed according to the availability of the water reservoir. Ponds were mainly built for the accumulation of water in order to irrigate agricultural fields, and also for fish farming purposes.There are only a few ponds built exclusively for warmwater fish farming in Slovenia. Production areas for freshwater aquaculture in warmwater from 1995 to 2001 are presented in Table 7.
Table 7. Number of production facilities for freshwater aquaculture in warmwater fish farms in Slovenia from 1995 to 2001 and the utilized areas.
| Ponds for production of | Polyculture ponds | Winter quarter | Utilized area (ha) | |||
| Year | Fry, fingerlings | Market size | Broodstock | |||
| 1995 | 50 | 21 | 3 | 19 | 315 | |
| 1996 | 43 | 27 | 3 | 3 | 21 | 348 |
| 1997 | 34 | 13 | 3 | 23 | 19 | 353 |
| 1998 | 50 | 35 | 3 | 10 | 13 | 361 |
| 1999 | 52 | 32 | 3 | 12 | 24 | 540 |
| 2000 | 64 | 29 | 3 | 13 | 14 | 508 |
| 2001 | 76 | 59 | 4 | 16 | 9 | 399 |
Source: SORS
Table 7 also shows a peak of the utilized surface area in 1999 dedicated to warmwater fish production. In 2001 there was a drastic decrease of the surface area used and the main reasons were:
- incomplete legislation (in the field of water concessions), and
- conflict of interest between fish farming and bird protection.
On the contrary statistics in Table 7 show an increase of fry and fingerling ponds, and ponds for market size fish. Reason for increasing number of ponds is in better reporting. The last few years more small-scale farmers are sending their data to SORS.
According to the estimation from the Advisory Service for Aquaculture, methodologies in warmwater fish farming are as follows:
- 75 percent of production units have semi-intensive polyculture systems
- 20 percent of production units have extensive polyculture systems
- 5 percent of production units have intensive monoculture (only fry, fingerling production)
An estimate is also made regarding warmwater fish farming technologies. Warmwater species are reared only in earth ponds.
b) Coldwater fish farming
Freshwater aquaculture in coldwater fish farming is exclusively for the rearing of salmonids. Both warmwater and coldwater fish farming is for human consumption and it is also important for re-stocking and angling.
The species reared for human consumption are:
- rainbow trout (Oncorhynchus mykiss), and
- artic charr (Salvelinus fontinalis).
The following autochthonous salmonid species are reared for re-stocking and angling:
- marble trout (Salmo marmoratus)
- brown trout (Salmo trutta m. fario)
- lake trout (Salmo trutta m. lacustris)
- Danube salmon (Hucho hucho)
- grayling (Thymallus thymallus).
Table 8 shows production facilities in coldwater fish farming from 1995 to 2001.
Since 1995 there has been a decrease of ponds for fry, fingerling and broodstock but the number can also vary annually according to disease problems. When a hatchery becomes infected by virus, it should be disinfected under veterinary control. Because some owners are undecided regarding the sanitation programme, they lose the possibility of obtaining a licence for broodstock and fry production. They can also lose one to two years of production by having to go through a controlled sanitation programme. Ponds for market size fish are continuously increasing since 1995. This data also complies with the production data presented in Table 3. The capacity of the ponds decreased in volume after 1998 due to the reconstruction of several fish farms.
Table 8. Number of production facilities for freshwater aquaculture in cold water fish farms in Slovenia from 1995 to 2001 and the utilized areas.
| Year | Number of ponds for | Utilized area (m2, m3) | ||
| Fry, fingerlings | Market size | broodstock | ||
| 1995 | 371 | 193 | 33 | 118949a |
| 1996 | 325 | 224 | 36 | 110684a |
| 1997 | 328 | 238 | 34 | 117243a |
| 1998 | 261 | 327 | 32 | 76740b |
| 1999 | 292 | 260 | 37 | 71140b |
| 2000 | 328 | 365 | 41 | 56972b |
| 2001 | 308 | 406 | 29 | 64895b |
Source: SORS
a: Data till year 1997 are in m2
b: Data from year 1998 are in m3
Farms were reconstructed with concrete raceways in order to improve water flow in comparison with the older constructed earth ponds - which usually had higher volumes but an unsatisfactory water flow.
Statistical data for methodologies and technologies for coldwater fish farming are not available. Approximate estimates are as follows:
- 100 percent are intensive (for human consumption)
- 25 percent have earth ponds
- 75 percent have concrete ponds
- 50 percent have concrete raceways.
2) Marine aquaculture
a) Fin fish
There are limited resources for marine fish farming in Slovenia. Only in one basin (Piran Basin) concessions for marine aquaculture are granted by the authorities. However, from 1990 fish farming was started by two companies and the species reared are:
- seabass (Dicentrarchus labrax),
- seabream (Sparus auratus).
Statistical data are not available as only two companies are involved in fish farming and SORS are not willing to provide any information, due to personal data protection. Farms are located in the Piran Basin and each one has several floating cages. From the unofficial data available, it is obvious that marine fish farming is now facing serious problems. According to the farm owners production during 2001 was much lower than the previous years and later was even lower than in 2002. The reason for the decrease in production was due to small-scale farms not being able to compete with Italian, Croatian and Greek producers. On the other hand, in 2003 both farms were taken over by new owners, who planned to increase production approximately from 200 to 250 tonnes in the year 2004 and 2005.
b) Shellfish
Fish and mollusc farming have the same conditions, and there are only 3 farms which rear only one species:
- blue mussel (Mytilus galloprovincialis)
For the same reason as in fish farming, statistical data from SORS were not available. Market conditions are also very strong in this segment, but it seems that mollusc production has slightly increased. On the other hand the number of units is the same but perhaps even smaller than a few years ago.
2.3 Production data
Statistical data since 1991 are included in this report and are divided into freshwater and marine aquaculture. Aquaculture production of the main species in Slovenia from 1991 to 2001 is presented in Table 9, and the development during the last decade can be clearly identified. Freshwater production has increased by 51 percent. Although development of mariculture activities was showing a promising increase until 1998, it is now facing serious problems. Unfortunately, for various reasons, production of marine fish species decreased significantly but the volume for 2001 has increased because of a higher mollusc production.
Table 9. Aquaculture production in Slovenia from 1991 to 2001 ('000 kg).
| Species/year | 1991 | 1992 | 1993 | 1994 | 1995 | 1996 | 1997 | 1998 | 1999 | 2000 | 2001 |
| Rainbow trout | 469 | 573 | 469 | 541 | 446 | 511 | 516 | 601 | 800 | 840 | 820 |
| Other coldwater | 5 | 5 | 18 | 10 | 26 | 21 | 19 | 22 | 37 | 38 | 50 |
| Total coldwater | 474 | 578 | 487 | 552 | 471 | 532 | 535 | 623 | 837 | 879 | 869 |
| Carp | 64 | 102 | 143 | 118 | 213 | 155 | 172 | 126 | 255 | 172 | 181 |
| Other warmwater | 5 | 1 | 23 | 15 | 42 | 57 | 82 | 6 | 13 | 34 | 58 |
| Total warmwater | 69 | 103 | 166 | 133 | 255 | 212 | 255 | 132 | 267 | 205 | 238 |
| Total freshwater | 543 | 681 | 653 | 685 | 726 | 744 | 790 | 755 | 1104 | 1084 | 1108 |
| Seabream, bass | |||||||||||
| Molluscs | |||||||||||
| Total marine | 65 | 150 | 59 | 101 | 62 | 124 | 127 | 154 | 102 | 116 | 154 |
| Total aquaculture | 608 | 831 | 712 | 786 | 788 | 868 | 916 | 909 | 1207 | 1200 | 1261 |
Source: SORS
Table 9 shows official data regarding aquaculture production in Slovenia, whereas data from the Chamber of Agriculture are slightly different. On the basis of available data from the Agricultural Advisory Service production of freshwater species is much higher. An estimate for 2001 was approximately 1300 tonnes for the production of rainbow trout and 300 t for warmwater species for a total of 1600 tonnes. Estimates for 2002 are approximately the same. The reasons for these differences are that some small farmers fail to send their production figures to the SORS.
3. National policy
After Slovenia declared independence in 1991, Slovenia was taking over all legislation concerning aquaculture from “Socialistic Federative Republic of Yugoslavia”. Since 1991 several legislations were changed, a lot of new legislations were accepted. Aquaculture is today regulated by the following laws:
- Marine Fisheries Act (ZMR - 1)
- Freshwater Fisheries Act - (new one in preparation)
- Animal Husbandry Act (ZŽiv)
- Veterinary Service Act (Zvet) and their regulations, ordinance, etc.
The protection of fish species and other water organisms have to be considered by aquaculture production. They are regulated by the following laws and acts:
- Environment Protection Act (ZVO)
- Nature Conservation Act (ZON)
- Waters Act (ZV)
- National Environmental Action Programme.
A national plan for aquaculture is today part of the National Development Plan (NDP) 2001–2006. Presented in this document are several national objectives and indicators. These objectives are at different levels: strategic, specific and operational. Aquaculture and fisheries are treated together as one single “Fisheries Sector”.
Strategic or general objectives:
Agriculture and fisheries policies in Slovenia are in principal similar to the existing EU legislative regulations. Strategic objectives come from the field of food security, preservation of rural population density, preservation of sufficient production potential, increase of competitiveness in the agriculture sector, and assuring equity of income to farmers.
The most important objectives in fisheries are:
Specific objectives in fisheries:
Operational objectives in fisheries are defined in the NDP as follows:
Financial support to achieve the main objectives are presented in Table 10.
Table 10. Planned financial support in aquaculture and fisheries from 2001 to 2006 (in '000' SIT).
| Budget item/year | 2001 | 2002 | 2003 | 2004 | 2005 | 2006 |
| 1) Mariculture development support | 0 | 0 | 0 | 0 | 0 | 0 |
| 2) Support for freshwater fish farming and freshwater fish processing | 46.641 | 70.000 | 75.000 | 80.000 | 90.000 | 110.000 |
| 3) Modernisation of marine fishing and marine fish processing | 61.242 | 80.000 | 10.000 | 107.000 | 115.000 | 130.000 |
| 4) Research in fishery, monitoring and fisheries register | 43.216 | 72.000 | 100.000 | 110.000 | 120.000 | 150.000 |
| 5) Structural adjustment and social assistance | 0 | 30.000 | 30.000 | 30.000 | 30.000 | 50.000 |
| Total | 151.099 | 252.000 | 215.000 | 327.000 | 355.000 | 440.000 |
Source: NDP - Ministry of Agriculture, Forestry and Food
Evidence is shown from the above table that little effort will be placed on mariculture activities since natural sources are rather limited. Nevertheless, there are some financial resources planned for the modernization of marine fishing and marine fish processing. It appears from the NDP that more efforts will be placed on freshwater aquaculture over the next four years.
A specific national plan and sub-plan for aquaculture and fisheries are currently being prepared and will come within the existing national and EU legislative framework.
In Slovenia there are no specific principles for responsible aquaculture. A legislation should be prepared in the year 2003 or at least before it becomes a new member of the EU. The national methodology for environmental impact assessment has not yet been established. Also, each new farm with a capacity of more than 20 t has to prepare an environmental impact assessment for their own farm.
Standards for organic production of freshwater cyprinids have been established in accordance with those valid in Germany. In the near future standards for organic production of salmonids will also be prepared.
4. Production and markets
Production data for the last decade are reported in Table 9. It is clear that from these data and from the NDP that the Ministry of Agriculture, Forestry and Food in Slovenia intends to financially support in the future freshwater fish farming and marine fisheries. Perhaps this is not in accordance with the general guidelines of the European fisheries sector. However, marine aquaculture has very limited resources. Financial support for freshwater aquaculture will bring a higher production capacity and larger units. One of the future problems of freshwater fish farming will be the relatively small production units. These small units will have difficulty in competing with the EU common market. According to the data available and the fact that Slovenia intends to join the EU, the future of the aquaculture sector is unpredictable.
However the following points should be noted:
Some data for marine aquaculture are unavailable. The reason being that marine aquaculture and capture fisheries data have been combined and also because of the already mentioned provision for privacy. Table 11 reports the number of employees and the average wages received for freshwater aquaculture.
Table 11. Number of employees and average wages (in SIT) in freshwater aquaculture in Slovenia from 1995 to 2001.
| 1995 | 1996 | 1997 | 1998 | 1999 | 2000 | 2001* | |
| Employees | 114 | 118 | 116 | 120 | 144 | 159 | 192 |
| Avg.wages | 106.223 | 110.404 | 138.458 | 155.587 | 158.587 | 181.004 | 191.643 |
Source: SORS
* For year 2001 data are fully in compliance with Eurostat, ILO and FAO
The increase in number of employees during the past few years is in accordance with the production data. For 2001 the statistical methodology used is in full compliance with Eurostat, ILO and FAO standards. Nominal wages for the sector have increased since 1995;but actual wages increase is, of course, much lower, since annual inflation in Slovenia was between 7 and 10 percent in the period from 1995 to 2001.
Fish import data are presented in Table 12. Data shows an increase in the import of live and fresh fish since 1994. In 1993 import of marine fish was high. Later, due to the increase in aquaculture and capture fisheries, the import of live and fresh fish was stable. However, after 1999, for several reasons import was again high (smaller marine capture, smaller marine aquaculture production, higher demand for fresh fish, etc.).
Import of live fish during the last decade has never been at a particularly high level. Until the year 2000, there was high import of carp and other warmwater species and the figures for live fish also contain the volume of imported fry. The import of carp, seabass and seabream was in the past the main source of fry for Slovenian aquaculture. Since 2001 domestic production of carp fry has increased and because of this import has decreased. Marine species fry is 100 percent obtained from import. Domestic trout fry production is sufficient to cover the needs, but there is also quite an important import of trout eggs.
Main supplies of carp come from Hungary, Croatia and the Czech Republic while seabream and seabass are imported from France, Spain or Italy. Ornamental fish are imported from Austria, Germany and Singapore and 80 percent of trout eggs from the US. During the last few years trout eggs were also imported from South Africa and Denmark. The main import of eggs takes place during the summer, since the farmers do not have their own production.
Table 12. Import of live, fresh and processed fish in Slovenia from 1994 to 2002.
| 1994 | 1995 | 1996 | 1997 | 1998 | 1999 | 2000 | 2001 | 2002 | |
| Alive | |||||||||
| Ornamental | 7 | 7 | 8 | 10 | 14 | 14 | 13 | 15 | 12 |
| Carp | 50 | 39 | 32 | 18 | 75 | 51 | 46 | 10 | 1 |
| Other freshwater | 1 | 3 | 3 | 3 | 4 | 7 | 3 | 6 | |
| Marine | 1 | 52 | 1 | 23 | 1 | 8 | 1 | 1 | 1 |
| Fresh, cooled | |||||||||
| Trout | 4 | 14 | 6 | 4 | 3 | 3 | 1 | 48 | |
| Other freshwater | 0 | 0 | 0 | 1 | 2 | 3 | 9 | 14 | |
| Salmon | 6 | 11 | 37 | 50 | 60 | 71 | 80 | 86 | 97 |
| Plaice, sole | 46 | 34 | 14 | 13 | 14 | 23 | 27 | 19 | 23 |
| Anchovy, sardine sprat | 137 | 48 | 39 | 29 | 58 | 70 | 54 | 20 | 162 |
| Mackerel | 13 | 5 | 3 | 4 | 1 | 11 | 11 | 10 | 22 |
| Hake | 20 | 22 | 18 | 19 | 19 | 38 | 29 | ||
| Sea bass | 54 | 66 | 46 | 71 | 91 | 103 | 139 | ||
| Sea bream | 48 | 40 | 36 | 62 | 91 | 130 | 140 | ||
| Other marine | 331 | 300 | 339 | 350 | 397 | 181 | 391 | 343 | 344 |
| Frozen and processed | |||||||||
| Trout | 0 | 2 | 2 | 2 | 2 | 1 | 1 | ||
| Other freshwater | 33 | 1 | 4 | 10 | 28 | 0 | 1 | ||
| Salmon | 1 | 36 | 18 | 23 | 21 | 12 | 30 | 32 | 42 |
| Plaice, sole | 2 | 40 | 50 | 48 | 67 | 44 | 33 | 38 | 32 |
| Anchovy, sardine sprat | 379 | 6 | 118 | 0 | 29 | 103 | 94 | ||
| Mackerel | 1.875 | 1.419 | 1.462 | 1.322 | 1.434 | 1.539 | 1.408 | 1.661 | 1.830 |
| Hake | 8 | 535 | 2.050 | 1.776 | 1.938 | 1.771 | 1.240 | 1.736 | 1.779 |
| Other marine | 2.160 | 2.222 | 754 | 873 | 528 | 432 | 963 | 767 | 414 |
| Fish together | 5.050 | 4.760 | 5.064 | 4.682 | 4.728 | 4.4417 | 4.542 | 5.126 | 5.232 |
| Crustaceans | 360 | 309 | 362 | 367 | 351 | 573 | 366 | 330 | 340 |
| Mussels | 79 | 47 | 155 | 60 | 76 | 102 | 93 | 123 | 99 |
| Squid, octopus | 1.732 | 1.828 | 1.920 | 1.677 | 1.621 | 1.979 | 1.851 | 2.213 | 2.163 |
| Total | 7.221 | 6.944 | 7.5000 | 6.786 | 6.776 | 7.071 | 6.853 | 7.792 | 7.834 |
Source: SORS
Table 12 shows that the import of fresh farmed species is also increasing rapidly. The import of seabream, seabass, and salmon is constant from year to year but that of sole and plaice has been higher since 1996. The 1994 figures show a higher volume of these two species, but only because the volume for some other sea species has been included in the different year classification. Import of carp and other warmwater species was never considered important. In 2002 volume of rainbow trout increased drastically and the reason for this could be the difference in price for fresh fish products between Italy and Slovenia (88 percent of trout is imported from Italy). Salmon is mainly imported from Norway, Denmark, Ireland and Italy; sole and plaice from the Netherlands and France; and seabream and seabass from Greece, Croatia and Italy. Other species come from capture fisheries mainly from Croatia, Morocco and Spain. Approximately 75 percent of the fish products are either frozen, dried or processed and mainly come from the EU countries. Although hake and squid comes from Argentina and other South American countries they are also imported from South Africa. More than 90 percent of the species are from captured fisheries, therefore only 10 percent come from aquaculture.
Export of fish and fish products in Slovenia are presented in Table 13.
Table 13. Export of live, fresh and frozen fish and fish products in Slovenia from 1994 to 2002.
| 1994 | 1995 | 1996 | 1997 | 1998 | 1999 | 2000 | 2001 | 2002 | |
| Alive | |||||||||
| Ornamental | 0 | 1 | |||||||
| Trout | 73 | 1 | 3 | 6 | 17 | 3 | 37 | 1 | 9 |
| Other freshwater | 3 | 3 | 2 | 0 | 0 | ||||
| Marine | 2 | 3 | 3 | 4 | 16 | 2 | |||
| Fresh, cooled | |||||||||
| Trout | 1 | 4 | |||||||
| Other freshwater | |||||||||
| Anchovy, sardine, sprat | 73 | 158 | 457 | 423 | 95 | 95 | 54 | 118 | 5 |
| Sea bass | 19 | 2 | 2 | 0 | 6 | ||||
| Sea bream | 1 | 16 | 8 | 0 | 2 | 1 | |||
| Other marine | 24 | 4 | 16 | 12 | 32 | 81 | 88 | 83 | 40 |
| Frozen and processed | |||||||||
| Freshwater species | 6 | 0 | 12 | 2 | 4 | 2 | |||
| Anchovy, sardine, sprat | 379 | 80 | 353 | 7 | 4 | 1 | 3 | 4 | 4 |
| Other marine | 57 | 133 | 88 | 90 | 119 | 95 | 161 | 160 | 133 |
| Fish together | 610 | 389 | 938 | 559 | 293 | 280 | 356 | 387 | 196 |
| Crustaceans | 5 | 2 | 3 | 4 | 5 | 6 | 10 | 8 | 3 |
| Mussels | 7 | 8 | 19 | 2 | 3 | 0 | 0 | 1 | 0 |
| Squid, octopus | 250 | 90 | 110 | 106 | 173 | 137 | 199 | 208 | 58 |
| Total | 872 | 489 | 1.070 | 670 | 473 | 424 | 564 | 604 | 258 |
Source: SORS
The above table shows a decrease in the export of fish and fish products in Slovenia due to the following reasons:
Smaller marine farm production during the last few years.
The main markets for the export of Slovenian products are Croatia, Italy, Bosnia and Herzegovina. Export to Croatia, Bosnia and Herzegovina was also composed of re-export. Slovenian companies bought fish and fish products on the world markets and then resold to Croatia and Bosnia. Such resale has greatly diminished during the past years bringing an overall decrease in export. Figures also show how the decrease of catch can influence export volume. Currently the export of aquaculture species is non-existant.
As shown in Tables 12 and 13 Slovenia is a net importer of fish and fish products, and the overall consumption from 1993 to 2001 was between 10 000 and 11 000 t/year. This means that the average per caput consumption was between 5.0 and 5.5 kg/year. From this the consumption of freshwater species was approximately 0.5 to 0.8 kg/year. Only approximately 12 percent of the consumption is covered by domestic aquaculture production. Since the fish consumption figures are lower than average in the EU, it is evident that there are still good possibilities for further aquaculture development.
The main domestic consumption centre is in the city of Ljubljana while the main market centre for marine organisms is in the coastal areas, and that for freshwater species is again in Ljubljana. However, Slovenia being a small country it is very difficult to define its main centres. Generally, fish consumption in rural areas is slightly higher.
Great efforts are being undertaken by the Ministry of Health which is in favour of a higher consumption of aquaculture products. Better balanced and healthier food also means better food control. The HAACP system is compulsory for all kind of food production and processing. Food safety has been reassured by the new Slovenian regulations. Also in the Marine Fisheries Act and its regulations and ordinance, product quality for aquaculture species is prescribed. The Veterinary Administration of the Republic of Slovenia (VARS) is responsible for aquaculture products quality. At present there is no other private or government institution for the quality control of aquaculture products. However, it is ensured that as in some other areas where food production takes place (cattle, dairy, vegetables, etc.), labelling and eco-labelling will be developed. At the moment standards for organic production of carp and other warmwater species are in force, but an institution to control this has not yet been established. Standards for organic production of salmonids have already been planned and will be the basis for further development. Unfortunately, in the NDP from 2001 to 2006 there are no specific targets regarding the development of organic fish farming.
5. Relationship with capture fisheries
There is little relationship between aquaculture and capture fisheries in Slovenia, although both are in the same sector and covered by the same ministry they still have to face many problems, whereas in the past they were both quite profitable. Problems occurred in capture fisheries when Slovenia gained independence. Since then, the Slovenian fleet was no longer considered a “domestic” fleet in the Croatian Sea, and the fish catch decreased. However, aquaculture production increased also due to the new government policies.
Over the past few years problems have also occurred in aquaculture but this was not related to capture fisheries. Slovenia is a net importer of fish and fish products, so there is no competitiveness between domestic aquaculture producers and fishermen. Moreover, in the future they will have to work more closely with each other in order to secure their place on the market. Without cooperation they will have even less chance to survive under competitive conditions within the EU. At the moment fishermen and fish farmers do not have any registered association. In some respect their interests are represented by the Chamber of Agriculture and Forestry.
There have been no problems between fish farmers and fishermen in the coastal areas, the reason being that with only two farms (limited production) aquaculture cannot have any serious influence on the market. Also, the environmental impact on fishing grounds seems rather limited. Therefore, a drastic increase in marine aquaculture production is not foreseen to seriously impair the environment.
6. References and web addresses
Skalin, B. 1993. Ribogojstvo. Kmečki Glas, Ljubljana.
Statistical Office of the Republic of Slovenia. Data tables - Agriculture and Fisheries.
Statistical Office of the Republic of Slovenia. Statistical Yearbooks - Agriculture and Fisheries.
Ministry of Agriculture, Forestry and Food, National Development Plan 2001–2006.
Statistical Office of the Republic of Slovenia- http://www.stat.si/
Human Development Report - http://www.sigov.si/zmar/aprojekt/hdr/02–03/
Environmental Agency - http://www.arso.gov.si/
Ministry of the Environment, Spatial Planning and Energy - http://www.sigov.si/mop/
Ministry of Agriculture, Forestry and Food - http://www.sigov.si/mkgp/
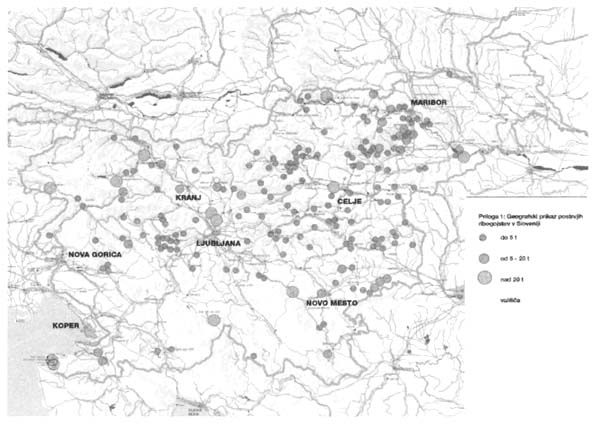
Annex 1. Geographical Presentation of Slovenian Fish Farms
Annex 2. List of Institutions Involved in Research Aquaculture Activities
Ebra d.o.o., Cesta 5. Maja 3, SI-1370 Logatec
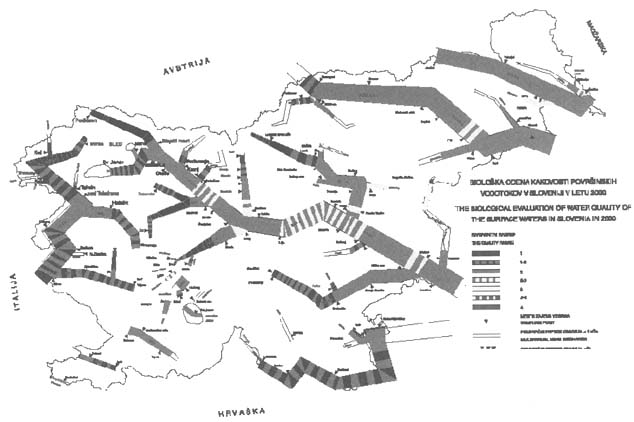
Annex 3. The Ecological Evaluation of Surface Water Quality in Slovenia in 2000
![]()
![]()
![]()