![]()
![]()
![]()
Paul J. Rago
Population Dynamics
Branch
National Marine
Fisheries Service
166 Water St.,
Woods Hole, MA 02543,
USA
<[email protected]>
12.1 INTRODUCTION
Fishery-independent estimates of abundance form the cornerstone of many stock assessments for teleost and shellfish species. The advantages of such abundance indices are well described in Hilborn and Walters (1992) and in greater detail by Gunderson (1993), Doubleday and Rivard (1981) and Smith (1990). Fishery-independent surveys provide valuable measures of relative abundance, rates of population change and size and sex composition for a wide range of species. As these measures are obtained from scientific sampling or within an experimental design, they are less subject to the unknown and often confounding factors that complicate the interpretation of fishery-dependent indices of stock status. Such generalizations, however, do not apply entirely to elasmobranchs.
For a variety of reasons, fishery-independent surveys for elasmobranchs are more difficult to interpret (Simpfendorfer et al., 2002) than surveys for teleosts and shellfish. Perhaps the most important reasons are the average size of individuals and the need to use passive sampling gear (also called “fixed”or “static”). Large elasmobranchs often have swimming speeds that exceed the towing speed of active fishing gear and, therefore, have low probabilities of capture in mobile gear with perhaps the exception of purse seines. In terms of survey design, indices of abundance based on passive gear catches are complicated because the “zone of influence”depends on both environmental factors and the behavior of the animal. Fish must swim to the gear and become entangled or hooked to be captured. In the latter case, fish must also be hungry and encounter a baited hook. This Section explores these issues, suggests possible methods for design and analysis and highlight the benefits of fishery independent surveys. Emphasis is placed on gears that have actually been used in such surveys (trawls, longlines and gillnets) rather than potential, but as yet unproven, gear (purse seines, traps) or other technologies (such as acoustics, optical systems or automated underwater vehicles).
12.2 UTILITY OF SURVEYS
Whether one is initiating a new survey or continuing an existing survey, the first order question must be “For what area, species and populations can I make valid inferences?”The scope of inference can be defined rigorously but initially it has more value as a conceptual tool for evaluating survey utility. Surveys are circumscribed by physical boundaries and if one is fortunate, the species of interest will reside within those boundaries. Otherwise the survey will only allow valid inference about the fraction of the population that is present in the sampling area during the time of the survey (e.g. Carlson and Brusher, 1999). If the fraction of the population in the sampling area is unknown, then other methods, such as population models or empirical smoothing methods may allow inferences to be made about the entire population. Thus fishery-independent surveys strike a balance between the ability to make inferences about one or more populations versus the usage of a specific area by one or more species. An overview of the different uses of fishery-independent surveys for elasmobranchs is provided in Table 12.1.
TABLE 12.1
Uses of
fishery-independent surveys for elasmobranchs.
| Use | Comment |
| Estimate Relative Density | Can be used to infer trends over time and calibrate numerical population models but the target population and area must be defined. Otherwise inferences are restricted to population available to area sampled. |
| Define mating, spawning and nursery areas | Useful for monitoring trends in important localized habitats. |
| Biological attributes of population | Inferences regarding size composition, growth rates, sex ratio, maturity status, fecundity, etc., can be extended to whole population if samples are representative. |
| Seasonal presence/absence | Same restrictions as for relative density, but in this case the information is qualitative. |
| Relative selectivity of commercial gear | Establish sampling properties of commercial gear and facilitate interpretation of relative biases. |
| Evaluate alternative fishing methods | Assist in development of fishery management measures. |
| Tag release programs | Essential information for defining stock structure, possible migration patterns and rates, validating growth rates and so forth. |
There are two primary uses of fishery-independent surveys. The first is to generate an estimate of population abundance. For such an estimate to be valid, the survey index (I) must be strictly proportional to stock abundance P or expressible as a monotonically increasing function of true stock size, e.g. I =aP or I=aPb. The second use of fishery independent surveys is to examine attributes of the sampled population (such as size frequency, maturity, sex ratios, age). These attributes have value in understanding the basic species biology and in developing life history models. If the attributes of the sampled population are representative of the population as a whole, then the survey results can be used to infer the expected effects of exploitation. In turn, the size and sex composition of the sample may be sufficient to estimate the likely magnitude of harvest rates on the population (Rago et al., 1998).
Derived indices of abundance are used to calibrate various population models for teleosts but have had less applicability for elasmobranchs for a number of reasons. Many of their life history characteristics confound the interpretation of such data. Elasmobranchs are often long-lived and difficult to age. Many shark species approach their maximum size at relatively young age and live many years near their asymptotic size. For these species, body size provides little information about age, making it difficult to distinguish cohorts. Larger elasmobranch species can be highly migratory, aggregating on prey species or in response to environmental factors that are difficult to detect a priori. Under these circumstances, fishery independent surveys that encounter such aggregations may produce widely varying indices over time (e.g. see Warren, 1997; McAllister, 1998). When variations in estimates of relative abundance are inconsistent with the biology of the species, variations in survey catchability may be responsible. In many instances, indices derived from surveys must be processed with other statistical techniques (see Section 12.4) to take account of unavoidable sources of variation.
Survey requirements for elasmobranchs fall between those for most fish species and those for marine mammals. Owing to their larger size, fast swimming speeds, pelagic behavior and in many cases, scarcity, many shark species are infrequently captured by trawl survey gear. At this time, the only feasible alternatives to trawls are various types of fixed gear. Surveys for marine mammals rely primarily on the visual sighting of surfacing animals, or in the case of pinnipeds (Ver Hoef and Frost, 2003), visual or photographic surveys of seasonal aggregations on known terrestrial habitats (e.g. haul-out sites). Line transect methodologies may be used effectively for these species (e.g. Burnham, Anderson and Laake, 1980; Palka and Hammond, 2001). It may be possible to develop methodologies that combine acoustics, pattern recognition and line transect techniques to assess large-sized elasmobranch species. Even if possible from a technological standpoint, these approaches will require significant advances in sampling theory to define the scope of inference. In the meantime, the principles outlined in Section 12 can be used to develop useful estimates of stock abundance and biological attributes for elasmobranch species.
12.3 BASIC THEORY
Relevant theory for the design and analysis of fishery-independent surveys draws heavily from traditional sampling theory (e.g. Cochran, 1963; Thompson, 2002). As Morrison et al. (2001) note, estimating the abundance of animal populations is an atypical problem. The most important distinction between sampling theory designed for human populations and animal populations is the loose definition of the sampling frame. Far from being a statistical nuance, the sampling frame is a critical issue in fishery independent surveys.
The sampling frame is defined as a list, or total set, of sampling units (Mendenhall, Ott and Scheaffer, 1971). The total number of sampling units is the total area of the population domain divided by the average size of the sampling unit. For human populations the sampling frame might consist of a list of residents, a list of households, or list of firms. In turn, each resident, household or firm would constitute a sampling unit. In the case of fisheries surveys the sampling unit is the site for deployment of the gear. For active fishing gear, the area of the site is defined as the footprint of the gear. Depending upon the species and its response to the advancing gear, the footprint is defined as the product of the length of the tow times the effective width of the gear. For species that respond to visual cues, the width of the gear may be as large at the distance between the trawl doors; for others, it may only be the distance between the wings of the net. These considerations alone can induce the sampling frame to vary by a factor of two. The sampling frame is modified further by areas that cannot be sampled within the population domain. Rocky bottom, shallow water, presence of passive gear (e.g. lobster traps, gill nets) and wrecks all act to reduce the total area that can actually be sampled. The sampling frame may also be reduced if the fish that frequent such areas are never available to capture elsewhere.
The ambiguity of defining the number of sampling units for active gear is small relative to the problems of defining the effective area of passive gear. For gill nets and hook gear, the footprint must be defined in terms of the zone of influence. Conceptually this is the area over which there is a reasonable expectation that an animal could encounter the gear. This will be a function of the environmental conditions, the average swimming speed of the species and the duration of the set. All things being equal, the encounter rate with the gear should increase with the average swimming speed of the fish and the duration of the set. For hook gear, the encounter expectation is also conditioned on the presence of a baited hook and a feeding response.
Sample surveys assume that each sampling
unit has an equal probability of being included in the sample (Smith, 1996). A
random sample is obtained by selecting one or more sampling units from the
sampling frame. Let yi denote a response variable that is
measured from sampling unit i, (e.g. the number of sharks per longline set).
The mean is estimated as the sum of the observations divided by the number of
samples,  . The variance is estimated as the sum of the
squared differences between each observation and the mean divided by the sample
size minus one,
. The variance is estimated as the sum of the
squared differences between each observation and the mean divided by the sample
size minus one,  . In most fisheries surveys, the variance
tends to be unacceptably large relative to the mean (e.g. Pennington, 1983),
highlighting the need to reduce the variance in some way.
. In most fisheries surveys, the variance
tends to be unacceptably large relative to the mean (e.g. Pennington, 1983),
highlighting the need to reduce the variance in some way.
12.4 SURVEY DESIGN
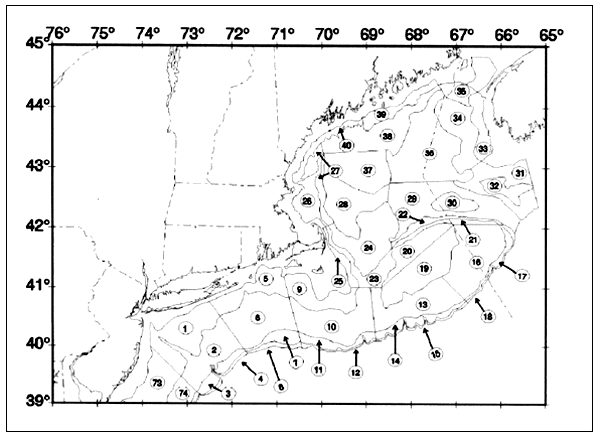
One of the primary methods of reducing the variance of the estimate is to stratify the sampling frame into sets of sampling units with more homogeneous properties (Figure 12.1). The overall variance is estimated as a weighted average of the within-stratum variances. If the strata have been defined appropriately, the stratified estimate of the variance will be smaller than that obtained from a simple random sample. Combining the notation in Cochran (1963) with the fisheries orientation in Gunderson (1993) we can illustrate the general principles of design-based estimation and extend it to model-based estimation. The details of these derivations become complicated and the reader should consult standard statistical texts for further details. In what follows, the objectives are to provide an intuitive understanding of the underlying concepts, identify relevant literature and illustrate the need to carefully weigh the utility of fishery-independent surveys.
FIGURE 12.1
Example of strata definition for bottom trawl surveys
conducted by the Northeast Fisheries Science Center, NOAA Fisheries, Woods
Hole, MA.
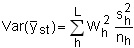
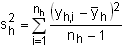
Let L denote the total number of strata and let h denote the stratum index, such that h=1, 2,…, L. The total number of samples taken over all strata (n) can be written as n =Σnh where nh is the number of samples taken in stratum h. The sampling frame is defined as N = ΣAh/ah where Ah is the area for stratum h and ah is the size of the sampling unit in stratum h. The maximum number of sampling units in stratum h is defined as Nh= Ah/ah. A weighting factor, defined as the fraction of sampling units in stratum h is denoted as Wh=Nh/N. In most fisheries-independent surveys the fraction of the sampling frame that is sampled is small and the finite population correction factor can generally be ignored when calculating the sample variance. Under these conditions the stratified mean, y stand variance Var (yst) are estimated as:
 | (12.1) |
and
where
 | (12.2) |
This formulation allows the size of the sampling units to vary with stratum. If the sampling units vary with each sample, then the sampling frame would be approximated as the total area of the stratum divided by the average area of the sampling unit within the stratum, Nh~ Ah /ah. Such a situation could occur in a trawl survey if the footprint of the trawl varied significantly with each tow in the stratum. The stratum-specific area swept per tow would then be defined as

Equation 12.2 illustrates two ways in which the overall variance of the mean can be reduced. Since the within-stratum variances are weighted inversely by the number of samples per strata (nh) allocation of additional samples to strata with the highest variances can be an important strategy. Since the variance increases with the mean in almost every fishery example, the allocation of additional sampling units to high density strata intuitively makes sense. The second way that variances can be reduced is through choice of stratum boundaries. The strong association between the mean and variance suggests that defining stratum boundaries according to density zones will act to reduce the variance within strata. Selection of strata and allocation of samples is not simply a mathematical problem. Biological information on habitat and oceanographic features must be considered before an algorithmic approach. Moreover, most fishery independent surveys are designed to estimate relative abundance for more than one species. In such cases, it is unlikely that a single stratification or allocation scheme is optimal for every species.
Overall cost represents one of the most important factors in the design of a survey. Samples are expensive to collect and it is generally desirable to minimize the variance of a survey subject to a total cost constraint. Strategies, such as the Neyman allocation (Cochran, 1963, p. 97; Mendenhall, Ott and Scheaffer, 1971, p. 64–73) can be used to define appropriate sample allocations wherein the optimal number of samples is proportional to the product of total sampling units within stratum h and the standard error and inversely proportional to the square root of sampling cost in stratum h. The costs of collecting additional information on the biological attributes of the species are generally small relative to the costs of deploying vessels and crew. Hence it is desirable to collect as much information as feasible on individual specimens. The “feasibility”of collecting such information is generally controlled by the average time between adjacent stations.
A significant fraction of the total sampling effort should be allocated to continuous experimentation and quality control measures. The former measures are important during the early years of a survey when the penalty for altering a design maybe small relative to the gains in precision. As the number of survey years increases, the gains in precision must be progressively greater because the costs of discarding historical information increase. Quality assurance /control (QA/QC) measures include ongoing verification of gear performance, evaluation of fixed stations and comparisons with other vessels and gears. Some of these measures, such as fixed stations, can be incorporated in the overall survey design via partial replacement designs (e.g. Warren 1994). Rather than viewed as a burden, QA/QC measures should be evaluated with respect to the question, “Can I afford to do this study over?”
Stratified random designs are one of many designs that might be implemented for evaluation of elasmobranch species. Systematic surveys are worthy competitors and have desirable properties inasmuch as they may provide better support for kriging methods. An important caveat for such studies is that strictly speaking, a design-based variance is not estimable (Cochran, 1963; Gunderson, 1993). Others authors cautiously advocate systematic designs, noting that their desirable properties can outweigh the problems of variance estimation (Levy and Lemeshow, 1991; Hilborn and Walters, 1992; Morrison et al., 2001).
12.5 FIELD WORK AND GEAR TYPES
Although many types of gear can catch or detect elasmobranchs, three basic gear types generally define the range of applicable fishery-independent methods (Table 12.2). Trawls (Rago et al., 1998; Graham, Andrew and Hodgson, 2001), hook gear (Musick, Branstetter and Colvocoresses, 1993) and gill nets (Nakano and Nagasawa, 1996) have all been used to define abundance metrics. Other gear, such as traps and purse seines may be useful for specialized surveys, but no examples of their use in routine surveys are known. Similarly, routine use of acoustic surveys is hampered by the lack of a swim bladder in elasmobranchs, difficulties in identifying species, their fast swimming ability relative to the survey vessel and the relatively low density of individuals. Surveys based on explosives or poisons are ecologically unacceptable and unlikely to be effective in ocean environments.
TABLE 12.2
Gear-specific design
considerations for primary gear used in fishery-independent surveys of
elasmobranchs.
| Gear | Advantages | Disadvantages |
| Trawl | - Design assumptions easier to satisfy - Multispecies perspective | - Size selectivity - Species selectivity - Requires large vessel and high costs - Limited utility for pelagic habitats - Limited utility in rocky, coral reef and complex bottom areas - Vessel effects may reduce survey catchability |
| Gill Net | - Relatively inexpensive - Can use smaller vessels - Wider range of bottom types - Benthic and pelagic zones | - Size limitations based on mesh selectivity - Domain of influence difficult to specify - Day vs night and turbidity differences - Movement of fish required |
| Hook Gear | - Effective - Relatively inexpensive - Can use smaller vessels - Wide range of habitats - Benthic and pelagic zones | - Movement of fish required - Must detect bait, encounter and consume baited hook - Competition with other fish for hooks - Once hooked, potential predation by larger fish - Loss of bait reduces effective sampling time |
The ability to implement a valid survey design ultimately depends on the performance of the sampling gear and the ability to satisfy the assumptions of the survey design. All sampling gears are biased and no study can fully meet all of the assumptions of a design-based survey. The relevant question however, is the magnitude of these violations and their influence on the bias and precision of the survey. Table 12.3 summarizes some of the critical assumptions and potential tests for fishery independent surveys. Many of these issues can be addressed through simulation studies wherein the validity of conclusions is conditioned on the realism of the simulation (e.g. Punt, Walker and Prince, 2002).
TABLE 12.3
Recommended measures to reduce bias
and improve precision of surveys. The following list is indicative and not
exhaustive.
| Problem | Recommendation |
| Gear saturation | Evaluate set duration or tow duration Alternative hook spacing |
| Zone of influence | Record environmental variables Video monitoring Field experiments |
| Scaling of catch rates | Evaluate catch rates for various lengths of nets or longlines and tow duration for trawl nets |
| Fixed vs random stations Gear avoidance Vessel effects/avoidance | Partial replacement design Compare day vs night differences Use acoustics to evaluate potential dispersal of fish during survey deployment |
| Size selectivity Simple random vs stratified vs systematic sampling designs | Multiple mesh size panels in gillnets Alternative hook and bait sizes and types Compute design effects for reduction in variance Consider all species unless survey specifically targets a single species |
In general, no single type of gear is equally effective for all life stages of a single species, much less so for multiple species. As a simple example, catch rates of selected shark species from Northeast Fisheries Science Center autumn and spring research vessel bottom trawl surveys during 1967–2003 are summarized in Table 12.4. Except for smooth dogfish, the average percentage of positive tows was less than 5%. Larger sharks were caught less frequently and average numbers per positive tow were low. Maximum observed sizes were less than 2 m and no trends are immediately apparent for the larger species. If trawl data were the only source of information for these species, it would be difficult to draw any conclusions regarding stock status.
As a consequence, it is helpful to examine several types of gear and gear configurations when designing a survey program. For a survey based on longlines, it would be useful to test for differences between hook size, types and sizes of bait, hook spacing, set duration and so forth, even after a standard protocol had been established. Reserving some of the sampling effort for ongoing experimentation can be an effective means of improving fishery independent surveys.
Gear bias is just one violation of assumption implicit in a survey design. Most fishery scientists have a good intuitive concept of what constitutes a valid random sample. In practice, they could agree on the inclusion or exclusion of a particular sample within a survey design. However, as the number of samples and complexity of the design increases, the basis for agreement on the validity of an overall survey is likely to diminish. As an example, suppose that a study demonstrates an optimal soak time of 6 hours and that a 24-hour soak time in an area of high shark abundance is generally too long, resulting in either gear saturation, or loss of bait. Should a 10-hour set be rejected as unrepresentative? Real world constraints on deployment, retrieval and processing of samples rarely allow for resetting gear and rejection of samples will typically reduce the utility of already sparse sampling designs.
TABLE 12.4
Summary of fishery-independent
catch statistics for selected shark species caught during fall (1967–2002) and
spring (1968–2003) bottom trawl surveys from Cape Hatteras to the Gulf of Maine
conducted by the Northeast Fisheries Science Center, NMFS, 1967–2003.
| Angel | Black-nose | Dusky | Sandbar | Chain Dogfish | Bonnet-head | Smooth Dogfish |
| Fall 1967–2002 13100 stations sampled over 36 years | ||||||
| Total number of positive tows | ||||||
| 262 | 2 | 25 | 123 | 125 | 2 | 2172 |
| Number of years with positive tows | ||||||
| 36 | 2 | 5 | 30 | 33 | 1 | 35 |
| Average number per positive tow | ||||||
| 1.51 | 1.00 | 1.24 | 1.31 | 2.38 | 1.00 | 7.46 |
| Maximum size (cm) captured | ||||||
| 126 | 102 | 211 | 186 | 47 | 99 | 150 |
| Spring 1968–2003 12209 stations sampled over 36 years | ||||||
| Total number of positive tows | ||||||
| 190 | 1 | 39 | 53 | 493 | 2 | 706 |
| Number of years with positive tows | ||||||
| 35 | 1 | 16 | 20 | 36 | 2 | 36 |
| Average number per psoitive tow | ||||||
| 2.39 | 1.00 | 3.44 | 2.09 | 2.59 | 1.00 | 24.45 |
| Maximum size (cm) captured | ||||||
| 123 | 105 | 212 | 168 | 50 | 88 | 140 |
Another example arises from the interactions between the survey duration and the movement patterns of the resource. Fishery-independent surveys typically attempt to provide snapshots of the population at a particular time. However, if the normal movements of a species are large relative to the spatial distribution of the survey, it may be difficult to distinguish changes in abundance from variations in seasonal migration or foraging patterns. For example, finfish bottom trawl surveys conducted during the spring and autumn by the Northeast Fisheries Science Center typically occur over an eight week period and proceed from Cape Hatteras to the Gulf of Maine. For less mobile species, the duration of the survey is a negligible source of bias, but for highly migratory species the bias effect could be significant.
Walsh (1997) provides an excellent review of the performance characteristics of active and static gear. This thorough review gives a clear exposition of the major factors influencing the capture rates and relevant technology that can be used to better understand gear performance. A useful companion article by Millar and Fryer (1999) describes modern techniques for comparing the relative fishing power of various gear types. The general statistical methodology of Millar and Fryer conceivably could be used to generate adjustment factors for size composition estimates from survey data. Together these articles provide a useful foundation for selecting, deploying and analyzing the basic survey gear types used in fishery-independent surveys for elasmobranchs.
12.6 Statistical Estimation and Precision
Assuming that a reasonable sampling design can be developed and implemented, the next step is to analyse the results. Means and variances can be estimated using equations 12.1 and 12.2, but studies rarely go exactly as planned. Gear and vessels fail, storms curtail sampling and may alter fish distributions, non-target species may fill nets or longlines and emergencies may prevent execution of a full design. Such restrictions on randomization will generally necessitate consideration of alternative analytical approaches, imputation methods for missing strata or post stratification of the original design. The statistical literature is not unanimous on how such issues should be addressed, except to acknowledge that restrictions on randomization reduce the scope for inference by uncertain magnitudes.
One of the ongoing problems in fishery independent surveys is the overdispersion of population variances. Excessively high catches in a single realization of a survey design can bias means upward and imply low precision (Kappenman, 1999). Alternatively, a low number of sample units within a stratum may underestimate the true variance. Model-based estimation methods have been proposed by a number of authors (e.g. Pennington, 1983). Others have noted that model-based estimators are preferable when the assumed model is true but undesirable when the model is not true (e.g. Myers and Pepin, 1990; Syrjala, 2000). As an alternative to model-based confidence intervals and design-based estimators that rely on asymptotic variance estimators, Smith (1996a, b) was the first to demonstrate the properties of bootstrap estimation in fisheries surveys. His results suggested that percentile confidence limits could be developed from complex surveys.
Model-based estimators encompass a broad range of methodologies. In general they are characterized by an assumption that the catches are derived from a particular distribution, e.g. Poisson, log normal, negative binomial (Taylor, 1953; Power and Moser, 1999). Compound distributions such as the delta distribution can be useful for evaluating abundance measures. Pennington's (1983) work on this distribution has been influential in stimulating methodological research (e.g. Myers and Pepin, 1990; Syrjala, 2000). Cortes (2002) recently assessed four coastal shark populations using nine fishery independent time series, including trawls, gill nets, longlines. He modeled these time series with a generalized linear model (GLM) as a two stage process in which presence/absence is considered a binomial process and positive catches are treated as a Poisson process. Similar methods have been applied to migratory bird populations (Link and Sauer, 1998).
12.7 Smoothing procedures
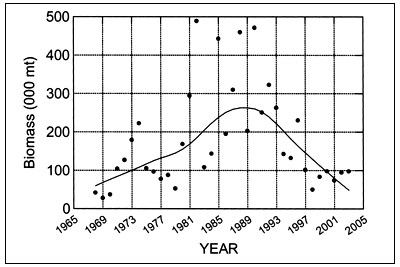
Model-based estimation can be viewed as a general class of smoothing procedures in which the results of a survey design are interpreted as realizations of a complex, but continuous underlying function. Moving averages constitute perhaps the simplest such procedure, wherein time series of observations are expressed as simple averages of adjacent observations. The moving average process can be extended to include locally-weighted regression methods with robust treatment of residuals. This approach goes by the acronym, LOWESS or “locally weighted regression scatter plot smoothing”(Chambers et al., 1983). Figure 12.2 depicts the use of LOWESS in illustrating temporal changes in the abundance of mature female spiny dogfish off the northeast U.S. coast. The LOWESS smoothing separates the major signal from the noise of year to year sampling variability.
Auto-regressive, integrated moving average (ARIMA) models (e.g. Pennington, 1985) employ a more formal approach to smoothing by explicitly accounting for the correlated error structure. These techniques have been applied rather infrequently in fisheries, perhaps due to their rather demanding and hard-to-test assumptions. When the number of years in a data set is small, it may be difficult to test the assumption of stationarity and estimate the autocorrelation precisely.
Spatial correlation between observations underlies the geostatistical modeling approaches that have been applied to some fish stocks (see Petitgas, 2002). One of the useful features of these approaches is the ability to approximate the precision of non-random surveys. Generalized linear models (GLM) and generalized additive models (GAM) are distinct from geostatistical models but share a common objective of describing the underlying structure of the data in terms of one or more explanatory variables. Swartzman, Silverman and Williamson (1995) successfully applied GAM models to walleye pollock populations.
FIGURE 12.2
Swept area biomass estimates of spiny dogfish biomass in
spring research vessel bottom trawl surveys (1968–2003) for dogfish greater
than 80 cm, both sexes combined. Line represents LOWESS smoothing with a
tension factor = 0.5.
Variation in abundance indices are a function of the true variation in the temporal and spatial distribution of the resource, sampling error from the statistical design and measurement error associated with gear performance. Changes across years provide a measure of the true change in abundance and variations in the catchability of the resource. As noted earlier, when variations in estimates of relative abundance are inconsistent with the biology of the species, variations in survey catchability may be responsible. There are several ways in which such variations can be addressed but none of them are entirely satisfactory.
The ratio of changes in average catch rates across years can be used as an aggregate measure of population change if the factors that influence the average catch rate remain the same over time. Otherwise, the rate of population change is confounded with changes in the fraction of the stock in the sampling frame, variations in the zone of influence of the gear and other factors.
12.8 INFLUENCE OF COVARIATES
One of the major advantages of model-based estimation is that the model parameters can be expressed as functions of explanatory variables. The importance of various explanatory variables can then be evaluated in the context of their reduction of the variance in the observations. Cortes (2002) demonstrates the utility of this approach wherein model parameters were expressed as functions of a set of variables (time of day, depth, temperature and so forth.). Baum et al. (2003) successfully applied a zero-truncated negative binomial GLM in analyzing shark landings recorded in commercial fisheries logbooks from the U.S. pelagic longline fleet. By adjusting for the effects of various covariates, Baum et al. (2003) were able to identify population trends apart from variations in extraneous variables. Ver Hoef and Frost (2003) demonstrated the utility of hierarchical Bayesian models for the assessment of trends in seal populations and application of such models to elasmobranch longline surveys should be a productive area of future research.
Perry and Smith (1994) developed a nonparametric method to examine the degree of association between catch rates and environmental factors. One of the most useful features of their approach is the explicit incorporation of the sampling design into the measure of association. Shepherd, Page MacDonald (2002) applied this approach to the analysis of spiny dogfish catch rates in Canadian trawl surveys.
12.9 DATA STRUCTURES
Efforts to collect fishery independent data are wasted unless similar efforts are made to develop and maintain databases. All of the statistical methods described above rely on a proper data structure. Here, our emphasis is on the development of modern relational databases. Such databases are required not only to support complex statistical models, but also to support questions that have not yet been asked and techniques that have not yet been developed. Properly structured relational databases have the potential to meet these challenges; poorly structured and maintained databases may not be able to do this.
Guidance on data collection and handling procedures may be found in a number of sources. The general principle is to collect and check as much data as possible while at sea, subject to safety considerations and the overall constraints of the mission. Recent advances in at-sea data collection technologies utilizing electronic measuring boards, scales, sample custody processing and integration of environmental data, can greatly improve the speed and quality of survey data. The Fisheries Scientific Computing System at the Northeast Fisheries Science Center is one example of an integrated data acquisition system1.
Data should be summarized in a relational database using, e.g. Oracle, Access or other commercially available products. At least four table types should be considered, which may be denoted as the STATION, CATCH, LENGTH and BIOLOGY tables, respectively. The STATION table should contain the details of the sampling station i.e. strata, station number, date, time, location, gear performance measures and environmental data. The STATION table should also include information on the vessels used, gear deployed, type of station (random vs. fixed). Other tables can be developed using one or more key fields from this table, to summarize the total number and weight of all species (CATCH table), the length, weight, maturity status and sex of each measured fish (LENGTH). One or more BIOLOGY tables should identify attributes of individual fish. Table fields may include age, stomach volume and/or contents, tag release number, special treatments (e.g. tetracycline injection) and so on. Collectively, the relational database provides a compact way of summarizing the voluminous data from individual surveys. More importantly, it provides a standardized, long-term system for archiving data for elasmobranch populations.
The costs of collecting additional environmental information while at sea are minor compared to the overall survey costs. Post-hoc analyses of capture rates are likely to be necessary for all but the most abundant species. Collection of environmental data may be especially important for these types of analyses. Collection of various environmental variables at the sampling site is standard in most surveys. However, the relevant conditions that affect capture rates may occur on larger spatial scales (e.g.proximity to frontal zones) or longer temporal scales (e.g. rate of warming of shelf waters). This type of information is more difficult to incorporate as a standard data table, but the efforts may allow a much more coherent interpretation of the data.
A related issue is the acquisition of data on gear performance. For mobile gear, various forms of electronic data acquisition allow scientists to evaluate gear configuration and contact time, each of which is critical for judging the quality of a sample. For passive gear, the requirements are less rigorous but equally useful. The recent analyses by Baum et al. (2003) of commercial longline data for shark populations relied heavily on detailed, set-specific data records.
The archival importance of fishery-independent survey data cannot be overemphasized. In some cases, the value of long-term data has only recently been summarized (e.g. Jackson et al., 2001; Hoey et al., 2002; Baum et al., 2003). Some surveys may be difficult to interpret when viewed in isolation but clear when compared with one or more other surveys. Thus, it is important for governments, universities and other groups that collect fishery independent survey data to recognize the enduring responsibility of maintaining these data for the world's managers, scientists and harvesters alike. While these arguments are true for all surveys, they are particularly relevant for large-bodied species whose abundances have declined on a worldwide basis (Myers and Worm, 2003).
Data should be routinely audited with specialized software that attempts to identify erroneous codes and improbable biological attributes such as excessive maximum sizes or unlikely combinations of lengths and weights (As an example, additional details on the procedures used at the Northeast Fisheries Science Center may be obtained by contacting scientists via the following web site: http://www.nefsc.noaa.gov/esb/survey.htm). Standardized summarization programs are useful for ensuring that appropriate statistical methods are used and for verifying the selection criteria employed. Most fishery research institutions have developed standardized summarization programs for fishery-independent data. Examples include the SURVAN program used at the Northeast Fisheries Science Center (Kramer, 2001) and SPlus software for bootstrapping surveys developed by Stephen Smith (DFO, Bedford Institute of Oceanography, N.S.). Information on a sophisticated, commercially available survey analysis system, known as SUDAAN, may be found at http://www.rti.org/sudaan/home.cfm The “Fideas”computer program by Swartzman, Sullivan and Heeley (2002) combines features of data base management systems, geographic information systems, higher level programming languages and web browsers into a general software tool for analyzing fishery independent survey data. The Environmental Analysis System (EASy; Tsontos and Kiefer, 2003) is an advanced, PCbased Geographical Information System designed for the storage, dissemination, integration, analysis and dynamic display, of spatially referenced series of diverse oceanographic and biogeographic data. It can be found at http://www.runeasy.com.
12.10 CONCLUSIONS
Fishery independent surveys fulfill a wide range of objectives and are a valuable component of any stock assessment program. They fulfill an important role in the monitoring and assessment of the world's elasmobranch species. Long-term data sets have undeniable value for detecting changes in abundance. As the length of time series increases, the ability to confirm the validity of historical data is diminished. Through rigid adherence to standard protocols and appropriate documentation, fishery-independent surveys help ensure that such data can be evaluated at a later time. Properly designed surveys have enduring value. For example, Graham, Andrew and Hodgson (2001) compared trawl survey data collected in 1996–97 with data from earlier surveys in 1976–77. Despite the gap between survey periods, Graham, Andrew and Hodgson were able to demonstrate significant declines in abundance of multiple elasmobranch species after 20 years of intensive fishing.
This Section only provides an introduction to the many challenges for designing multispecies fisheries-independent surveys for elasmobranchs. Additional details on the statistical methods may be found in statistics text books (e.g. Cochran, 1963; Mendenhall, Ott and Scheaffer, 1971; Levy and Lemeshow, 1991; Thompson, 2002) and in the journal of various applied fields. Given the biology of elasmobranches, useful approaches may be found not only in fisheries (e.g. Gunderson, 1993) but also in wildlife (e.g. Seber, 1973; Morrison et al., 2001), forestry (Schreuder, Gregoire and Wood, 1993) and even sociology (e.g. Kish, 1987). While it is yet unclear that sustainable fisheries can be developed for large elasmobranchs (Walker, 1998), fishery-independent surveys provide essential information necessary for sound management.
12.11 ACKNOWLEDGEMENTS
I wish to thank F. Almeida, N. Kohler and L. Natanson for helpful discussions during the planning of this Section. I especially thank J. Musick, R. Bonfil and F. Serchuk for their constructive and timely reviews.
12.12 literature cited
Baum, J.K., Myers, R.A., Kehler, D.G., Worm, B., Harley, S.J. & Doherty, P.A. 2003. Collapse and conservation of shark populations in the northwest Atlantic. Science, 299:389–392.
Burnham, K.P., Anderson, D.R. & Laake, J.L. 1980. Estimation of density from line transect sampling of a biological population. Wildl. Monogr., 72: 1–202.
Carlson, J.K. & Brusher, J.H. 1999. An index of abundance for coastal species of juvenile sharks from the northeast Gulf of Mexico. Marine Fish. Rev., 61: 37–45.
Chambers, J.M., Cleveland, W.S., Kleiner, B. & Tukey, P.A. 1983. Graphical methods for data analysis. Duxbury Press, Boston. 395 pp.
Cochran, W.G. 1963. Sampling techniques. 2nd ed. Wiley. New York. 413 pp.
Cortes, E. 2002. Stock assessment of small coastal sharks in the U.S. Atlantic and Gulf of Mexico. Sustainable Fisheries Division Contribution SFD-01/02-152. Southeast Fisheries Science Center, Panama City, FL.
Doubleday, W.G. & Rivard, D. (eds). 1981. Bottom trawl surveys. Can. Spec. Publ. Fish. Aquat. Sci., 58: 237 pp.
Graham, K.J., Andrew, N.L. & Hodgson, K.E. 2001. Changes in relative abundance of sharks and rays on Australian South East Fishery trawl grounds after twenty years of fishing. Mar. Freshwater Res., 52: 549–61
Gunderson, D.R. 1993. Surveys of fisheries resources. Wiley. New York. 248 pp.
Hilborn, R. & Walters, C.J. 1992. Quantitative fisheries stock assessment: Choice, dynamics and uncertainty. Chapman and Hall. New York. 570 pp.
Hoey, J.J., Pritchard, E., Brown, C. & Showell, M. 2002. Pelagic shark abundance indices based on fishery-dependent and fishery-independent data from the western North Atlantic. Col. Vol. Sci. Pap. ICCAT, 54(4): 1199–1211.
Jackson, J.B.C., Kirby, M.X., Berger, W.H., Bjorndal, K.A., Botsford, L.W., Bourque, B.J., Bradbury, R.H., Cooke, R., Erlandson, J., Estes, J.A., Hughes, T.P., Kidwell, S., Lange, C.B., Lenihan, H.S., Pandolfi, J.M., Peterson, C.H., Steneck, R.S., Tegner, M.J. & Warner, R.R. 2001. Historical overfishing and the recent collapse of coastal ecosystems. Science, 293: 629–638.
Kappenman, R.F. 1999. Trawl survey based abundance estimation using data sets with unusually large catches. ICES J. Mar. Sci., 56: 28–35.
Kish, L. 1987. Statistical design for research. Wiley. New York. 267 pp.
Kramer, W.P. 2001. Bottom trawl survey analysis program. SURVAN 8.10. Northeast Fisheries Science Center. Woods Hole, MA.
Levy, P.S. & Lemeshow, S. 1991. Sampling of populations: Methods and Applications. Wiley. New York. 420 p.
Link, W.A. & Sauer, J.R. 1998. Estimating population change from count data: Application to the North American Breeding Bird Survey. Ecol. Applic., 8: 258–268.
Mcallister, M.K. 1998. Modeling the effects of fish migration on bias and variance in area-swept estimates of biomass: a vector based approach. Can. J. Fish. Aquat. Sci., 55:2622–2641.
Mendenhall, W., Ott, L. & Scheaffer, R.L. 1971. Elementary survey sampling. Duxbury. Belmont, CA. 247 pp.
Millar, R.B. 2000. Untangling the confusion surrounding the estimation of gillnet selectivity. Can. J. Fish. Aquat. Sci., 57: 507–511.
Millar, R.B. & Fryer, R.J. 1999. Estimating size-selection curves of trawls, traps, gillnets, and hooks. Rev. Fish Biol. Fish., 9: 89–116.
Morrison, M.L., Block, W.M., Strickland, M.D. & Kendall, W.L. 2001. Wildlife study design. Springer. New York. 210 p.
Musick, J.A., Branstetter, S. & Colvocoresses, J.A. 1993. Trend in shark abundance from 1974–1991 for the Chesapeake Bight region of the U.S. mid-Atlantic coast. In S.Branstetter (ed.). Conservation biology of elasmobranchs, pp 1–18. U.S. Dept Commerce. NOAA Tech Rep. NMFS 115.
Myers, R.A. & Pepin, P. 1990. The robustness of lognormal-based estimators of abundance. Biometrics, 46: 1185–1192.
Myers, R.A. & Worm, B. 2003. Rapid worldwide depletion of predatory fish communities. Nature, 423: 280–283.
Nakano, H. & Nagasawa, K. 1996. Distribution of pelagic elasmobranchs caught by salmon research gillnets in the North Pacific. Fish. Sci., 62: 860–865.
Palka, D.L. & Hammond, P.S. 2001. Accounting for responsive movement in line transect estimates of abundance. Can. J. Fish. Aquat. Sci., 58: 777–787.
Pennington, M. 1983. Efficient estimators of abundance for fish and plankton surveys. Biometrics, 39: 281–286.
Pennington, M. 1985. Estimating the relative abundance of fish from a series of trawl surveys. Biometrics, 41: 197–202.
Perry, R.I. & Smith, S.J. 1994. Identifying habitat associations of marine fishes using survey data: an application to the Northwest Atlantic. Can. J. Fish. Aquat. Sci., 51: 589–602.
Petitgas, P. 2001. Geostatistics in fisheries survey design and stock assessment: models, variances and applications. Fish and Fisheries, 2: 231–249.
Power, J.H. & Moser, E.B. 1999. Linear model analysis of net catch data using the negative binomial distribution. Can. J. Fish. Aquat. Sci., 56: 191–200.
Prager, M.H. 1994. A suite of extensions to a nonequilibrium surplus-production model. Fish. Bull., 92: 374–389.
Punt, A.E., Walker, T.I. & Prince, J.D. 2002. Assessing the management-related benefits of fixedstation, fishery-independent surveys in Australia's southern shark fishery. Fisheries Research, 55: 281–295.
Rago, P.J. 2001. Index measures and stock assessment in Atlantic salmon. In E. Prevost and G. Chaput (eds). Stock, recruitment and reference points: Assessment and management of Atlantic salmon, pp. 137–176. INRA Editions, Paris.
Rago, P.J., Sosebee, K.A., Brodziak, J.K.T., Murawski, S.A. & Anderson, E.D. 1998. Implications of recent increases in catches on the dynamics of Northwest Atlantic spiny dogfish (Squalus acanthias). Fisheries Research, 39: 165–181.
Schreuder, H.T., Gregoire, T.G. & Wood, G.B. 1993. Sampling methods for multiresource forest inventory. Wiley. New York. 446 pp.
Seber, G.A.F. 1973. The estimation of animal abundance and related parameters. Hafner. New York. 506 pp.
Shepherd, T., Page, F. & MacDonald, B. 2002. Length and sex-specific associations between spiny dogfish (Squalus acanthias) and hydrographic variables in the Bay of Fundy and Scotian Shelf. Fish. Oceanog., 11: 78–89.
Simpfendorfer, C.A., Hueter, R.E., Bergman, U. & Connett, S.M.H. 2002. Results of a fishery-independent survey for pelagic sharks in the western North Atlantic, 1977–1994. Fisheries Research, 55: 175–192.
Smith, S.J. 1988. Evaluating the efficiency of the D-distribution mean estimator. Biometrics, 44: 485–493.
Smith, S.J. 1990. Use of statistical models for the estimation of abundance from groundfish trawl surveys. Can. J. Fish. Aquat. Sci., 47: 894–903.
Smith, S.J. 1996. Bootstrap confidence limits for groundfish trawl survey estimates of mean abundance. Can. J. Fish. Aquat. Sci., 54: 616–630.
Swartzman, G., Silverman, E. & Williamson, N. 1995. Relating trends in walleye pollock (Theragra chalcogramma) abundance in the Bering Sea to environmental factors. Can. J. Fish. Aquatic Sci., 52: 369–380
Swartzman, G., Sullivan, P. & Heeley, M.D. 2002. Fish-ideas help manual: welcome to fish-ideas interactive diagnostic estimator for abundance surveys. Washington Sea Grant WSG-AV 98-16. http://nsgl.gso.uri.edu/ordering.htm.
Syrjala, S.E. 2000. Critique on the use of the delta distribution for the analysis of trawl survey data. ICES J. Mar. Sci., 57: 831–842.
Taylor, C.C. 1953. Nature of variability in trawl catches. Fish. Bull., 54: 145–166.
Thompson, S.K. 2002. Sampling. 2nd ed. Wiley. New York 400 pp.
Tsontos, V.M. & Kiefer, D.A. 2003. The Gulf of Maine biogeographical information system project: developing a spatial data management framework in support of OBIS. Oceanologica Acta, 25, 199–206.
Ver Hoef, J.M. & Frost, K.J. 2003. A Bayesian hierarchical model for monitoring harbor seal changes in Prince William Sound, Alaska. Ecological and Environmental Statistics, 10: 201–219.
Walker, T.I. 1998. Can shark resources be harvested sustainably? A question revisited with a review of shark fisheries. Mar. Freshwater Res., 49: 553–572.
Walsh, S.J. 1997. Performance of mobile and static gears used in single and multi-species resource surveys: A review. ICES CM 1997/W:02. 22 pp.
Warren, W.G. 1994. The potential of sampling with partial replacement for fisheries surveys. ICES J. Mar. Sci., 51: 315–324
Warren, W.G. 1997. Changes in the within-survey spatio-temporal structure of the northern cod (Gadus morhua) population, 1985–1992. Can. J. Fish. Aquat. Sci., 54(Suppl.1): 139–148.
![]()
![]()
![]()