![]()
![]()
![]()
Risk characterization is the concluding task in risk assessment, and is typically the step in the process that puts context around all the prior analysis. The risk characterization step combines the information generated in hazard identification, exposure assessment and hazard characterization to produce a complete picture of the assessed risk. Codex defines the risk characterization step as the process of determining the qualitative and/or quantitative estimation, including attendant uncertainties, of the probability of occurrence and severity of known or potential adverse health effects in a given population based on hazard identification, hazard characterization and exposure assessment. It is important to remember that risk managers should articulate the outcome of the assessment and the types of questions to be answered by the risk assessors at the onset of the assessment process. However, the assessment should at the least strive to answer the following questions in risk characterization:
How confident are the risk assessors about their prediction?
Risk characterization should also provide insights into the nature of the risk, which are not captured by a simple qualitative or quantitative statement of risk. Such insights include a description of the most important factors contributing to the average risk, the largest contributions to the uncertainty and variability of the risk estimate, and a discussion of gaps in data and knowledge. The risk assessor may also provide the risk manager with a comparison of the effectiveness of alternative methods of risk reduction (Lammerding, Fazil and Paoli, 2001).
The primary goal of the risk characterization step is to convey the results of the modelling and analysis to the risk managers so as to assist them in their decision-making. The first, perhaps obvious, output from the risk assessment is an estimate of the risk. Risk estimates can be calculated in terms of risk per serving, risk per day, risk per year, number of illnesses per year, or some other similar variation. In fact, all or any combination of these could be used, depending upon a determination of the most effective way to convey the information. The range and type of risk estimates can be reported in point estimate format; however, the distribution associated with these measures should also be reported so that the appropriate interpretation may be given to the point estimates. (This issue will be described below.) In presenting the distribution for the risk estimates so as to fully convey the results, at the very minimum a few basic measures associated with the risk distribution should be reported. These include the mean, the standard deviation and perhaps the range. While generally understood, they are illustrated in Figure 5.1.
FIGURE 5.1
Basic statistical distribution characteristics
Figure 5.1 shows the result using a probability distribution function (PDF), which presents the magnitude values on the “x-axis” and the associated probability of that value occurring on the “y-axis” .
In addition to presenting the risk results in a PDF, there is an alternative format constructed from the same information, which can, in some cases, enhance the presentation and communication of the results: the cumulative probability distribution (CDF). The CDF, shown in Figure 5.2, is useful because it conveys the probability of having a value less than those shown on the x-axis, compared to the PDF, which shows the probability of having the exact value shown on the x-axis.
FIGURE 5.2
Cumulative distribution function used to convey results
In addition to alternative methods that can be used to convey point estimate summaries of the risk distributions, it can be informative to present and provide an interpretation of the distribution of risk in the form of its shape, and skew in the risk characterization.
FIGURE 5.3
Three generic risk distribution shapes (symmetric, skewed
left and skewed right)
The shape of the distribution has important implications from a risk management standpoint. In Figure 5.3 (A), the risk distribution is symmetric, and as a result, there are an equal number of people experiencing a high risk as there are a low risk. In Figure 5.3 (B), the risk distribution is skewed to the left, with most people experiencing a low risk and a few experiencing a high risk, compared to Figure 5.3 (C), where the distribution is skewed to the right translating to many people experiencing a higher risk and only a few people experiencing a lower risk. From a risk management or policy perspective, each of these situations would need to be assessed differently in light of the following considerations: the population (children, elderly, etc.) experiencing the higher risk; what the actual magnitude of higher risk is (high risk as defined in this context may not be very high when compared to other competing risks), if the higher risk is being borne as a result of voluntary or involuntary actions, and whether the people bearing the higher risk are in control of the risk situation,etc.
A key aspect of the risk characterization stage is providing insight not only into the risk estimates, but also our confidence in the generated assessment. Such insights include:
Points that have a significant impact on the risk, and as such would be ideal areas to focus more attention on so as to ensure they are under control.
In general, quantitative risk assessment models can be considered as contributing towards risk management decision-making by providing input along four avenues:
providing a tool to test out formulated risk reduction strategies prior to implementation.
The first three applications are a direct result of analysing the model that is constructed in the assessment, while the fourth application is a result of altering the model to reflect alternative scenarios. In order to focus attention on risk-reducing and research areas, it is common to use techniques like sensitivity and uncertainty analysis on the assessment. The following definitions for sensitivity and uncertainty analysis are adapted from the FAO/World Health Organization guidelines for exposure assessment (FAO/WHO draft, 2002).
Table 5.1
Summary of sensitivity and uncertainty analysis
| SENSITIVITY ANALYSIS | UNCERTAINTY ANALYSIS |
| Definition | Definition |
| Sensitivity analysis determines the degree of influence a given input parameter or parameters have upon the value of the output, without considering the magnitude of the uncertainty associated with the parameter (s). | Uncertainty analysis is designed to determine the contribution of the uncertainty associated with an input parameter to the degree of certainty in the estimate of risk. |
| Purpose | Purpose |
| The analysis is instrumental in the identification of points in the process where additional data collection is most useful, where monitoring of critical points in the process is of greatest value, and where mitigation strategies could be most efficient. | The analysis, as the name implies, provides insight into the uncertainty associated with the exposure assessment. The uncertainty analysis is designed to focus research or data collection activities that can lower the model output uncertainty in the most efficient way. |
Uncertainty analysis and sensitivity analyses are two tools available to inform the risk manager about the outcome of the risk assessment. More specifically, these analyses can be used to facilitate the selection of mitigation strategies and focus future research by identifying the key areas of data deficiency. In fact, the identification of research areas may be an iterative process whereby the uncertainty in the results is too large for the manager to make a decision, and an analysis to investigate what the key sources of uncertainty are might be initiated.
It is important to understand the differences between uncertainty and sensitivity analysis. A sensitivity analysis can be used to identify risk mitigation strategies and to focus on research activities. An uncertainty analysis also focuses on research activities; however, unlike a sensitivity analysis, an uncertainty analysis is concerned with the magnitude of the uncertainty, or how uncertain we are. Therefore, in a sensitivity analysis we may identify points that are not very uncertain (in terms of magnitude) but that exert an influence on the outcome (perhaps because of their mechanistic relationship) and thus require additional information.
The sensitivity and uncertainty analysis are designed to identify and quantify the impacts of variability and uncertainty in the parameters. The importance of this from a risk management implication has been explained above. Specifically, points in the process that are important determinants of risk and variable are control options, whereas points in the process that are important determinants of risk and uncertainty are research focus options.
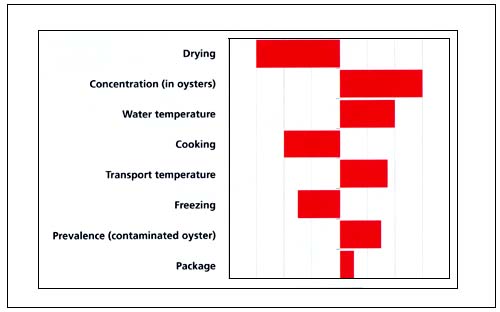
There are many ways in which the results of these analyses can be presented, but no single best way. However, an often-used presentation technique for the uncertainty analysis is to use a Tornado Chart. The Tornado Chart, as shown in Figure 5.4, plots the amount of influence a parameter has on the output (which can be measured using correlation coefficient values, for instance) vs. the actual inputs. As a result, it is quite easy to look at the Chart quickly and appreciate which parameters have the greatest impact on the output by the size of the corresponding bars.
One of the key aspects of the risk characterization stage of the risk assessment process is the presentation of alternative mitigation scenarios. These scenarios could represent potential risk management strategies designed to mitigate the risk, or alternative representations of the system to explore the potential uncertainty associated with the system. The ability to test out alternative strategies in order to evaluate their efficacy and therefore select the best alternative, is an extremely useful application of the quantitative risk assessment process and often one of the motivating factors for doing the risk assessment.
Figure 5.4
Hypothetical Tornado Chart for importance of a pathogen in
oysters
In order to test out alternative strategies, the approach typically used is to simulate the model using the current values as a baseline. Subsequently, alternative values representing those of the candidate risk management strategy are input and the model re-simulated. The baseline results are then used as reference points against which any system modification result is compared.
As an example, the results of an analysis in which a few risk mitigation strategies are investigated in order to gain insight into determining the best alternative is shown in Figure 5.5A and Figure 5.5B.
Figure 5.5
Hypothetical baseline and alternative strategy results
5.5A - Baseline scenario results
5.5B - Alternative strategies 1 and 2 vs. baseline scenario
In Figure 5.5A, the risk distribution under the current conditions for the “system” is shown. This is the typical way a risk distribution might be presented in the initial part of a risk characterization, where the aim is simply to convey basic measures such as range, shape, skew and standard deviation. In order to test out various alternative candidate risk management strategies, the effect of the strategies on the system parameters would be input into the model and the model simulation would be re-run. The resulting risk distribution as a result of the candidate strategies can then be compared to the baseline situation.
Figure 5.5B shows the potential comparison between two alternative strategies with the baseline. In this case, both alternatives shift the risk distribution to the left, indicating a risk reduction. From this perspective, both strategies could be potentially acceptable over the status quo. However, the application of quantitative modelling tools allows additional decision-making insight to be gained. For instance, in one case, strategy 2, the magnitude of the shift is less than the other, strategy 1; however, the spread or standard deviation is also reduced in the former strategy, strategy 2. This type of information can be factored into the selection of options, coupled with other factors such as feasibility and economics.
In general, it is not possible to prescribe exactly how to complete the risk characterization stage of the risk assessment process. It is highly dependent upon the reasons for which the risk assessment was initiated, and the risk management questions that the assessment attempts to address. Nevertheless, there are a few basic criteria that need to be included, and a few key features that can typically be found in a risk characterization. The first is obviously the characterization of the expected adverse effects. This includes capturing both the likelihood and magnitude of the risk. At the very minimum, the baseline risk estimates or an assessment of the current situation needs to be characterized.
The impacts of uncertainty and variability should be accounted for. (Ideally, these could be separated, however, from a practical point of view, to do this entails evaluation on a case-by-case basis.) This will provide insight into the amount of confidence we have in the results, the kinds of limits we can assume both in the model and our conclusions, and.the sorts of situations in which our conclusions might no longer apply. Additional insights concern components of the system that are highly variable and potential candidates either for some sort of control, if significantly influencing the risk output, or for targeted research.
Finally, the investigation and presentation of mitigation strategies can be key components of the risk characterization. Clearly, if there were specific strategies for which the assessment was undertaken to investigate, then they would be considered and presented in an appropriate manner. In addition, there may be alternatives not previously considered which come to light during the risk assessment process. Such alternatives can be presented as alternative to the already considered options at the discretion of the risk assessment so as to enhance the risk characterization.
![]()
![]()
![]()