![]()
![]()
![]()
Developing a mature C-GTOS will not occur in a short time. Because it is interfacial between GTOS and GOOS, the plan for C-GTOS has had to take elements of both observing systems. GTOS programmes have tended to focus on ambitious but discrete products, such as estimates of the global flux of carbon or net primary production on land, i.e. terrestrial carbon observations and net primary productivity. GOOS programmes are developing more as systems of numerous measurements and products. C-GTOS promotes a mixture of both methodologies, with the goal of creating a limited systems approach. To achieve this long-term goal, however, C-GTOS must establish credibility through well-defined initial products. Collectively, these products can be considered the phase 1 implementation of the C-GTOS.
This chapter describes a set of proposals for initial products within the Coastal Module of GTOS. These products address aspects of the issues or changes in states of interest identified previously (Chapter 3), assess capacity in certain areas, promote improved capabilities to enact the mature C-GTOS. Thus, products are seen as spanning the range of research from pre-operational and pilot project to operational. The issues include the following: (i) human dimensions, land use, land-cover and critical habitat alteration; (ii) sediment loss and delivery; (iii) water cycle and water quality, and (iv) sea level change, storms and flooding. Capacity will be assessed throughout the process of developing these products, and improved capabilities will be required to achieve the proposed products. Described in detail in subsequent sections, the initial products are as follows:
In terms of rationale for project selection, the products are designed to provide tests of concept for the observing system, determine the initial array of variables and indicators to be sampled and improve needed components and capabilities. Also, such initial products provide inroads into the accessibility of data needed for the more mature C-GTOS.
Three principles underpin phase 1 project selection. First, TEMS is seen as a key tool for programmatic delivery by serving as a central platform for facilitating and coordinating C-GTOS activities. A fundamental consideration is therefore the requirement to reinforce TEMS, with the role of fostering or improving communications between data providers and end users, including the dissemination of products and models. Second, research has been recognized as a valid component of C-GTOS, whereby such efforts are focused on proof of concept or developing products to improve information and technology transfer to developing countries. Third, a global or large-scale regional perspective is necessary in product development. While the global context of some of the phase 1 products is obvious, this is probably not the case for a study of deltaic systems. Nevertheless, this project aims at a proof of concept and provides a venue for developing informatics for C-GTOS. The end product should not only be transferable to other deltaic systems, but be adaptable to other ecosystems.
Explanation of each priority product is given in the following Sections in the form of a project proposal. Note that these explanations are written with a greater degree of detail and technicality than previous sections. The style reflects the need to demonstrate appropriate scientific rigor. We advise readers, who do not wish to delve into the details, to focus their attention on introductory, objectives and "importance to" subsections and not read the methods subsections.
4.2.1 Overview
TEMS was created in the late 1980s by the Global Environment Monitoring System Programme Activity Centre of UNEP as an international registry of terrestrial observation sites that access, measure, monitor and catalogue ecological data.
Since 1996 the GTOS Secretariat in Rome, Italy, has managed and developed the database with technical support from the FAO. It now contains approximately 2050 sites, 40 networks and 1300 contacts, all of whom are surveyed annually for updates. Site, network and variable information can be accessed through the TEMS Web site, which includes metadata, maps and variables methodology sheets (see http://www.fao.org/gtos/tems).
The TEMS database is a GTOS-led effort to enhance monitoring site collaboration and provide a framework for researchers, resource managers and decision-makers who seek data and information to support their efforts at the regional and global level.
The overall objectives of this proposal are to enhance TEMS to meet new coastal user needs by (i) improving TEMS geographical coverage through registration of relevant coastal networks and sites; (ii) developing new coastal monitoring variables and indicators and facilitating access to scientific datasets; (iii) integrating satellite images with ground measurements, and (iv) enhancing the outreach of TEMS.
4.2.2 Introduction
The core of the TEMS database consists of the research sites, which actively carry out, collect, distribute or own large time-series datasets. To be registered, the sites must be committed to long-term research, systematically monitor a suite of variables and express interest in international collaboration, as demonstrated by the presence of openly accessible or at least partially accessible datasets and data sharing. Finally, the sites should be well established in their area of study and degree of involvement with the international community to ensure the quality of the data they provide. Sites' efforts should directly relate to at least one of the five key GTOS issues: (i) changes in land quality; (ii) availability of freshwater resources; (iii) loss of biodiversity; (iv) climate change, and (v) impacts of pollution and toxicity.
All variables included within TEMS have an associated datasheet or methodology. A brief description of the existing GTOS environmental and social variable methodology and data sheets is included below.
Environmental variables methodology sheets
New site managers using the TEMS software select the most relevant coastal variables that best describe the observations made at their site. For coastal sites there are three groups of variables, described in Chapter 3, which will guide site managers in measuring and monitoring the following coastal environmental issues:
Each variable (e.g. soil moisture, water pH) is accompanied by a methodology sheet that sites can use as a basis to start monitoring activities. These methodology sheets focus on identifying terrestrial observation requirements, assisting the establishment of coastal terrestrial observing networks and assessing their adequacy, providing guidance on observation standards and facilitating access to terrestrial data (GTOS, 1997b).
Socio-economic data sheets
In a similar fashion to the environmental variables, data sheets have been developed for the preliminary C-GTOS socio-economic variables identified (section 3.2) to facilitate the integration of coastal environmental and socio-economic issues. These will guide site managers in the selection of variables that best describe the ongoing observations taking place at their sites.
Need for a TEMS Coastal Module
Early in 2002 a user survey was carried out to assess the use of the TEMS database and the adequacy of geographic coverage and to identify future user requirements. The survey also assessed the utility of specific features within the Web site, such as the thematic modules (biodiversity, coastal, forest and hydrology). The research sites reported that 19 percent of respondents included coastal monitoring as part of their site research (Tschirley, Servin and Sessa, 2003). Table 12 shows the distribution of all member sites of TEMS, and their distance from the coast. One of the first steps in developing the new coastal component of the TEMS system will be to identify a subgroup of coastal sites and networks that would most benefit from this new initiative.
TABLE 12
Distribution of current TEMS sites with
distance from the coast
|
Distance from the coast |
Number of sites |
Cumulated number of sites |
Percentage of total sites |
|
Less than 5 km |
160 |
160 |
10 |
|
Between 5 km and 10 km |
213 |
373 |
14 |
|
Between 10 km and 50 km |
497 |
870 |
32 |
|
Greater than 50 km inland |
700 |
1570 |
44 |
|
All sites |
1570 |
1570 |
100 |
Note: This information was derived from a representative subset of the registered TEMS sites at the time of publication
Sites located within 50 km of the coast will include the majority of members suited to the coastal subgroup, but sites up to 100 km from the coast will be contacted to facilitate access to data useful to coastal studies with broader geographical boundaries (Bryant et al., 1998; Cohen et al., 1997; Scialabba, 1998; Nicholls and Small, 2002). Sites will also be identified based on the type of data they deliver for specific coastal user needs. Coastal variables can be cross-referenced with the existing sites to identify areas of under representation.
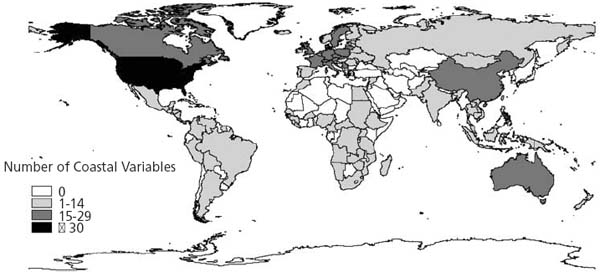
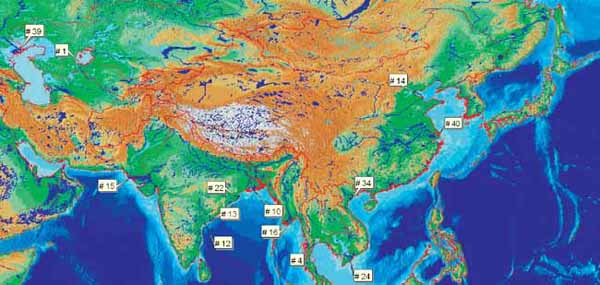
Figure 3 shows the global distribution of variables addressing coastal issues, monitored at current TEMS sites. Although this analysis shows only the presence or absence of variables within each country, it does identify the necessity for an expansion of current TEMS coverage, focusing on the regions of Africa, South America, Asia and Oceania, to ensure comprehensive coverage of coastal variables for C-GTOS as described below. It should be noted that some landlocked countries are shown to have the presence of low numbers of coastal variables monitored. This is because some coastal variables are the same parameters measured for other GTOS monitoring themes, such as hydrology and biodiversity, within these countries. Further analysis of site distribution and variables measured addressing specific issues, such as sediment loss and delivery (see Table 8) or water cycle and quality (see Table 9), will aid in identifying gaps in country coverage on C-GTOS focus issues. Methods of engaging and maintaining dialogue with existing and new TEMS members are described in the following outreach section. Cooperation with GOOS and IOC will be necessary in identifying and registering sites.
4.2.3 Objectives, proposed products and methods
The proposed Coastal Module of TEMS has been designed to close the gaps between global environmental and socio-economic data for coastal ecosystems. This module will allow users to search solely through the coastal sites and thus provides easier access to information on nutrient and sediment transport, land use and land cover, habitat quality monitoring and assessment, as well as socio-economic and human population data for coastal regions. The successful development and wide utilization of TEMS are largely due to the programme's focus on a few key outcomes and objectives, and all planned enhancement of TEMS for C-GTOS will use the same approach to cater for the needs of new users from the coastal community. The following activities will provide a substantially enhanced TEMS but will not provide the full capacity to convert data to information products within the mature C-GTOS, which will depend on further development of the informatics capacities of C-GTOS, GTOS and IGOS. The proposal in section 4.4 on deltaic systems will begin the process of developing appropriate informatics techniques for C-GTOS.
FIGURE 3
Between The global distribution of current
coastal variables measured at TEMS sites in each country. The number of coastal
variables measured at one or more sites within each country is shown ranging
from 0 to equal or greater than 30
Improve geographical coverage
Networks registration: Terrestrial ecosystem monitoring is expensive and difficult to sustain if it does not meet specific policy and management priorities. Therefore a long-term commitment may not be the first priority of governments, especially in developing countries, where poverty, hunger and health issues may be more critical. This is part of the reason why 85 percent of the sites are located in Europe and North America. A continuous effort is needed to identify and register networks and sites working on coastal issues, geographically located within the coastal zone (see Table 12) or areas associated with user definitions of the coast (see section 2.1). Analysis of existing TEMS data, such as the global distribution of current coastal variables shown in Figure 3, will be used as a tool to direct efforts to recruit new coastal site members. It can assist in filling the gaps in the geographical distribution of sites, identifying regions where coverage is inadequate, particularly in Africa, Asia, Latin America, and Oceania. It can also help to identify gaps in the coverage of the monitoring variables, principally in areas where a more complete geographic coverage exists. Among new sites and networks to be contacted, government and university-affiliated organizations will be given priority. In addition, it will be valuable to seek new partnerships with intergovernmental private institutions and nongovernmental organizations. As noted in section 1.4.1, various coastal conservation sites may be enticed into the TEMS network, as both providers and users of data. COOP, IOC and GEO will play integral roles in this process.
Development of monitoring variables and access to data
Organize a workshop of experts to further characterize the variables following the Terrestrial Observation Panel for Climate (TOPC) methodology (GTOS, 1998c) and determine their value in detecting, assessing and understanding global and regional changes in the coastal zone. In order to achieve this, the following subactivities will be carried out and supported by the C-GTOS Panel scientific experts: (i) obtain feedback from users and coastal networks on the preliminary list of 54 environmental and 37 socioeconomic variables identified for C-GTOS (Chapter 3); (ii) finalize C-GTOS variables; (iii) assess the selected environmental and socio-economic variables using the COOP ranking methodology; (iv) refresh and update the variables sheets and review the identified primary and secondary data holders by performing a quality assurance/quality control assessment, and (v) identify any new variables of major interest and create the appropriate variable sheet following the same methodology.
Data matrix development: In collaboration with the Global Observing Systems Information Center (GOSIC), GTOS developed a data matrix prototype (see http://www.gosic.org/ios/GTOS_observing_system.asp) based on GHOST hierarchy (see http://www.fao.org/gtos/GHOST.html). The GHOST hierarchy has five tiers, each with unique characteristics and roles, although existing facilities often straddle more than one tier. On the macro level a few variables are measured regularly in a large number of places, and on the micro level a large number of variables are measured in a few locations for a limited period. The relevant datasets of interest will be extracted from NASA's Global Change Master Directory (GCMD) using the following criteria: variables/keywords, spatial extent (regional and global level) and long-term duration (more than five years). Additional key datasets will be registered in GCMD. These datasets will be available through the data matrix interface, increasing the monitoring site information accessible to the TEMS user and providing a conduit for future translations of GCMD and TEMS variables. To further enhance the accessibility of information across the two information servers, additional development will involve a dynamic link between the TEMS Web site and GCMD site data. This will be a prototype for the integration of TEMS products with other global information systems, enabling live GCMD search capacity and links for users to jump directly to view GCMD datasets.
Metadata registration: Metadata provide detailed and standardized descriptions to understand the data published and support interoperability and sharing within and among organizations. Recently, the GTOS Secretariat has been considering the registration of metadata, using the GeoNetwork system, for the scientific datasets collected and owned by TEMS sites, complying with global standards and guidelines being developed including ISO (ISO, 2003), GEO (GEO, 2003), and UN-endorsed spatial data standards such as those used by GeoNetwork and Dynamic Atlas products. Forty-four percent of the respondents to a questionnaire addressing this issue expressed their interest in registering their datasets in a metadata directory (Tschirley, Servin, and Sessa, 2003). As a pilot project to address metadata standards within TEMS all new coastal variables and data sheets will comply with current metadata standards. Assistance will be provided to new coastal sites to record complete metadata information on registration.
Software development: simplicity, efficiency and accessibility
Inherent in the TEMS vision is the need for simplicity and speed. The platform independent architecture of the TEMS information system has a low maintenance cost and enables both users and site managers to quickly access the information they need from the Internet through a user-friendly interface using search engines and dynamic Web maps. Registered site managers can update their own site data online with a username and password.
Compliancy and integration with existing spatial data management initiatives
The GeoNetwork initiative is the cornerstone of FAO's spatial data infrastructure development (see http://www.fao.org/geonetwork). The purpose of GeoNetwork is to
It is a fully operational system for the formulation, management and dissemination of metadata and data. In addition, it provides dynamic access to certain datasets through an ArcIMS-based map server. The expert user can also gain access to GeoNetwork datasets from desktop geographic information system (GIS) software and overlay them with local data. All spatial products produced as part of C-GTOS, such as the TEMS dynamic maps of coastal sites, will be compliant with current ISO metadata standards (ISO, 2003). Products will be made available to a wide audience of users through the GeoNetwork web portal but can also be made accessible to those without Internet access in future projects through the development of stand-alone products using the FAO publishing software Dynamic Atlas (GTOS, 2003).
Integrate remote sensing measures
Remote sensing data access: Since 1998, the GTOS Secretariat has been developing a few projects linking ground measurements (e.g. land cover, leaf area indices and net primary productivity) with satellite-derived remote sensing data. Using sensor data collected from a single source provides complete, globally consistent measurements, temporally and spatially, which can then be compared and refined using the ground-based measurements. The database will include links to existing similar projects under the resources heading, to alert users to the utility of linking in situ and satellite measurement. TEMS is already providing, in the variables section, a link between the variable measured and its equivalent in the CEOS - World Meteorological Organization (WMO) database. It allows users to find which satellite sensors and missions are measuring particular variables. An interface will be developed so that users can identify imagery relating to their site of interest according to individual specifications (e.g. sensor, frequency, repetition rate, resolution). This is also a step towards delivering spatial data directly to users, a service that is possible through the future integration with other spatial web services such as GeoNetwork.
In situ validation of remote sensing products: Collecting data at the global level using satellite sensors not only is far less expensive and faster than intensive field, i.e. in situ, observations, but also covers very large areas in a short time frame. However, variables measured by satellite are rarely compared with ground measurements. In situ networks provide invaluable validation data to assess and improve the accuracy of satellite products. The links between these two observing methods tend to be sporadic and weak. TEMS provides direct links to the joint CEOS/WMO database that contains information about the variables measured by various satellite missions and instruments. The system is seen as a potential tool to bridge these two data-collecting methods by linking the precision, accuracy and consistency with which land-based sites can measure certain variables to the larger-scale assessments that are possible on satellite platforms. The implementation of C-GTOS, and collaborations with other observation systems as part of the IGOS Coastal Theme, will further develop links between in situ and satellite observations with specific products for coastal areas. This includes planned missions such as the Soil Moisture and Ocean Salinity (SMOS) of the ESA, and programmes such as COASTWATCH and COASTCHART, which will provide satellite-derived products to the Coastal IGOS and GTOS coastal community.
Enhance outreach
Increase visibility: The key question that future developers of TEMS must address is not how to make the Web interface easier to use, but how to increase the use among existing members and how to attract potential new users based on an outreach strategy. As there is already an existing base of members who measure coastal variables (see Figure 3), these member sites and networks will be the first contacted to form a subgroup of coastal member sites for C-GTOS. To aid the development of the Coastal Module, this group will be invited to participate in the review process for the enhancements in its embryonic stages and to provide feedback on this and other components of C-GTOS. Follow-up correspondence with the coastal member groups will involve mechanisms for interactive feedback on TEMS through the Web site and via e-mail. Participating coastal members will also be asked to identify sites within their own region that should be approached to fill gaps in coastal data coverage. This request will be made through tailored mailings containing information particular to their geographic location and area of specialization. To engage new sites and attract users looking for coastal data, collaboration will be pursued with identified coastal networks (see section 1.4.1) such as IUCN and NetCoast. The presence of C-GTOS and TEMS will be publicized through network newsletters and mailing lists, international meetings and conferences and scientific publications.
4.2.4 Importance to GTOS and importance generally
Many challenges remain to be faced by the terrestrial ecosystem monitoring community before data can be more freely exchanged, assembled and assimilated in large-scale datasets. Enhancing TEMS will enable GTOS to contribute in several ways to global and regional monitoring of coastal environmental change. It will
improve harmonization, standardization, and quality of long-term terrestrial data;
increase the visibility of terrestrial ecosystem research by underscoring and acknowledging the central tie between socio-economic factors and ecological changes, and
foster greater cooperation between national and international ecosystem monitoring networks and stations through the realization of concrete activities in coastal areas.
4.2.5 Timeline and implementation options
Coordinate with other observing programmes that have a coastal focus (such as IGOS partners) to access, manage and process satellite and remotely sensed data: 2-5 years.
Ensure access and complementary cross-institutional management of coastal data by coordinating with other coastal observing programmes in the development of variables, metadata and data sharing matrices: 2-5 years.
Redefine the content and presentation of coastal data in C-GTOS according to users' needs, and develop access to sites and information based on these needs: 1 year.
Identify and register more coastal sites into TEMS with special emphasis on including "marine" laboratories that sample land-based, freshwater, wetland and estuarine ecosystems and sites from underrepresented regions: 1-5 years.
Define and characterize new and previous coastal and socio-economic variables in a manner similar to that done for other variables of TEMS: 2 years.
Enhance spatial data capabilities and adopt open data standards to provide information products to users via the Web and through stand-alone GIS software: 2-5 years.
4.3.1 Overview
Currently, 1 billion people live in urban areas, and 3.2 billion people, or more than half the current global population, live on or within 200 km of a coastline. By 2025 that number is expected to increase to 6.3 billion or 75 percent of the then global population (UNESCO, 2003b). While these statements are open to debate, they underlie the fundamental questions about coastal population, land use and urbanization. The effects of the growing coastal population, and increase in urbanization both on the coast and further inland, drive changes in land use affecting the sustainability of the coastal ecosystem and reshape our current concept of the coastal environment.
Key questions
To begin to address these issues and formulate a plan of action to offer possible solutions to these problems, we need to answer four key questions:
4.3.2 Introduction
GTOS has developed a module responsible for the information concerning the terrestrial, wetland and coastal freshwater ecosystems appropriate to observing system needs. This land-based module of GTOS leads towards integrating terrestrial observations with marine observations to understand better the dynamics of change and the magnitude of its impacts. One of the fundamental parameters in determining the effects of the terrestrial portion of the coastal ecosystem is the extent of the human population, the scope of human activity and the socio-economic activity associated with the current and future increased population.
The population in the coastal zone is a major factor in assessing the health of the coastal ecosystem. The distribution of population is reflected in the types of coastal land use, and changes to these indicators are key elements in predicting their effects on coastal systems, e.g. loading of nutrients, sediments, pollutants or pathogens and resulting biological or ecological response in coastal waters. It is proposed that coastal databases of these key indicators be developed using existing, non-proprietary datasets for broad application in global coastal studies. These databases can then be tied in with existing coastal marine ecosystem and water quality assessments, e.g. UNEP GPA, to understand and predict the impact of human population growth in coastal regions and promote improved management.
4.3.3 Objectives and proposed products
It is proposed that an initial product be created showing the distribution of the coastal population and the extent of urbanization and land use in the global coastal regions. Periodic updating and recompilation of these datasets for different time periods will allow a spatial and temporal assessment of the dynamics of the changing coastal population and its effects on land use. These periodic updates will be secondary products, the value of which will increase in proportion to the number of temporal epochs developed.
Fully describing and understanding the coastal ecosystem requires the population dynamics to be accurately described and understood. Changing population is reflected in changing land-use patterns, including an apparent increase in urbanization. Once the initial state of the dynamic population is understood, key parameters, which are indicators of the response of the coastal ecosystem to a wide range of human-related activities, can be recognized, and observing systems can be optimized or designed.
4.3.4 Significance to GTOS and beyond
The impact of population on the coastal ecosystem will be a major issue in this century. The rate of change in land use in the coastal environment will significantly outpace the steady increase in population in the coastal region.
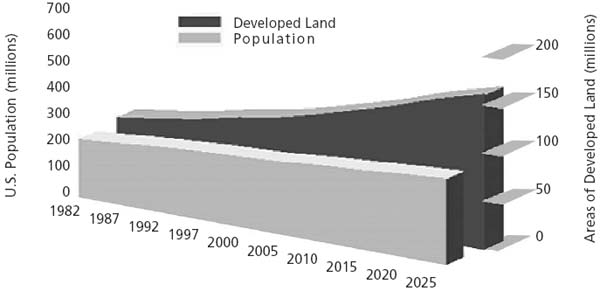
For example, land in the United States has been developed at more than twice the rate of population growth since 1982. This increase is a result of a consistent decline in development densities over the past several decades. If the trend continues through the year 2025, the nation will consume another 68 million acres (25 million hectares) of rural land for urban development (see Figure 4).
FIGURE 4
A comparison of historical and projected
population and developed areas in the United States (PEW, 2000)
4.3.5 Methods
Identify and describe a representative set of indicators and methods of measurement for global coastal population, coastal population density and land-use/land-cover pattern and composition.
Derive a "best set" of global population distribution, urbanization and land use/land cover using the current best available data. The best available datasets are described in section 4.3.6 below. A definition of the coastal zone will be determined for this initial assessment according to the requirements of C-GTOS, as appropriate, recognizing that effective choice of these indicators and methodological approaches will be driven by the context of use. Therefore the Coastal Panel of scientific experts present the case that assessment be carried out in light of the following:
Differing geographic properties and dimensions evolve from alternative definitions of the coastal zone. These differences in spatial context would, for example, vary if the coastal zone were defined by (i) simple and traditional distance from the coast definitions (e.g. 100 km from high mean water); (ii) functional, sectoral or use-based descriptors; (iii) watershed dynamics, or (iv) political or regulatory boundaries.
Policy questions involving coastal areas, population and land-use dynamics are context driven. For example, large-scale social characteristics such as level of economic development or political boundary conditions will certainly be different in different parts of the world, thus potentially requiring different views and uses of alternative indicators and methods.
Human dynamics in the coastal zone have a temporal dimension ranging from the question of resident versus seasonal coastal population to decadal changes in urban sprawl.
Determine and rank indicator choice, methodological approaches and data sources according to a set of assessment criteria designed to distinguish their value in addressing these questions of context.
An effective assessment of criteria will cull or expand upon such categories as indicator type, spatial extent, variables required, linkage value, spatial resolution, temporal resolution, start date, update frequency, data sources, accuracy or precision, reliability and validity.
Changes in the temporal and spatial distribution of population, urbanization and land use/land cover will be assessed as the datasets are developed for different time periods. This assessment will be an ongoing aspect of this project. Some of the data sources are periodically updated as part of ongoing operational efforts, so the use of these datasets will greatly facilitate this aspect of the project.
4.3.6 Datasets to be considered
A number of databases will be used to develop these products; these should be unrestricted, non-proprietary datasets in the public domain. A preliminary list of available products is included below, from which the appropriate datasets will be selected for the project. The selection will be based on both the functional use products and data interoperability issues that may arise owing to the use of multiple datasets.
DOE Landscan Ambient Population
The Landscan Global Population Project was developed as part of the US Department of Energy (DOE) Oak Ridge National Laboratory (ORNL) Global Population Project. It is a worldwide population database at 30" X 30" resolution for estimating ambient populations at risk. Best available census counts are distributed to cells based on probability coefficients, which, in turn, are based on road proximity, slope, land cover and nighttime lights. Verification and validation studies have been conducted routinely for all regions and more extensively for portions of the Middle East and the Southwestern United States. The dataset has been used for estimating ambient populations at risk. Files are available via the Internet in Environmental Systems Research Institute (ESRI) grid format by continent and for the world. The dataset is updated yearly.
DMSP Nightlight database and Nightlight change database
The U.S. Air Force Defense Meteorological Satellite Program (DMSP) Operational Linescan System (OLS) has a unique capability to collect low-light imagery. The DMSP is a polar-orbiting satellite and views a 3000 km swath with a 2.7 km ground sample distance. The satellite possesses two spectral bands: visible and thermal. There is nightly global coverage. The programme has been operating since 1972, and digital data are available from 1992 and will continue until around 2012. To derive the stable nighttime light database, algorithms were applied to about 1000 orbits of data covering the same time period to generate the first digitally derived global map of nighttime lights. Four different types of lights were distinguished: (i) human settlements; (ii) gas flares; (iii) fires, and (iv) heavily lit fishing boats. Two global datasets were derived - one for 1992-93 and one for 2000. In 1995 the National Geophysical Data Center (NGDC) researched the calibration of the OLS low light imaging data and in 1996 conducted experiments with the gain settings on the OLS. It found that it would be possible to generate a radiance-calibrated nighttime lights product. It was found that three gain settings are required to cover the full dynamic range of observable light from human settlements. A preliminary global product was made using 28 nights of data from 1996-97. This preliminary product does not have an atmospheric correction applied and suffers from low numbers of cloud-free observations in many parts of the world.
Global Landsat mosaic (1990, 2000)
NASA formally donated to UNEP (and to the wider UN) the 1990 and 2000 Global Landsat datasets developed and orthorectified by Earthsat as part of a Science Purchase Program. Once processed, the data were delivered to NASA's Stennis Space Center, which then passed them on to organizations responsible for distribution, such as the USGS Distributed Active Archive Center and the University of Maryland Global Land Cover Facility. The two mosaics consist of: (i) 1990 mosaic - 7 bands/30 m resolution/7500 scenes, and (ii) 2000 mosaic - 9 bands/1 at 15 m/8500 scenes (this is currently being compiled with 2500 scenes already available).
The compilation process took the best available image (i.e. most cloud free) for the year in question and combined these into an orthorectified mosaic for the entire earth's land surface covered by Landsat. Online access to single scenes and Red Green Blue images (bands 7, 4 and 2) of the 1990 and 2000 mosaics is already possible. Mosaics are available to view at full resolution (30 m) and can be downloaded in 5 ° tiles in MrSID format (http download at 70 Mb per tile).
Shuttle Radar Topography Mission
The Shuttle Radar Topography Mission (SRTM) is a joint project between the US National Imagery and Mapping Agency (NIMA) and NASA. The objective of this project is to produce digital topographic data for 80 percent of the earth's land surface (all land between 60° north and 56º south latitude), with data points located every 1-arc-second (approximately 30 m) on a latitude/longitude grid. The absolute vertical accuracy of the elevation data will be 16 m (at 90 percent confidence). This will result in the most accurate and complete topographic map of the earth's surface ever assembled.
Even though the mission will generate a 30 m resolution Digital Elevation Map, it is not yet clear whether this will be made generally available for the whole world at low or no cost. Alternatively, it is planned that a slightly reduced resolution (90 m) will be made available free of charge. This resolution is sufficient for draping 30 m Landsat imagery and creating perspective. The ability to create three-dimensional perspective views helps with interpreting the Landsat imagery, especially in the creation of land-use/land-cover spatial distributions.
Moderate Resolution Imaging Spectroradiometer (MODIS)/Terra Global 1 km Land Cover/GLOBCOVER
The MODIS Land Cover Classification product, MOD12Q1, identifies 17 classes of land cover in the IGBP global vegetation classification scheme. This scheme includes 11 natural vegetation classes and three developed land classes. One of these is a mosaic with natural vegetation, permanent snow/ice and barren or sparsely vegetated land, and water. Additional Science Data Set layers for other classification schemes include the University of Maryland modification of the IGBP scheme, the MODIS LAI/fPAR (MOD15) scheme, and the MODIS Net Primary Production (MOD17) scheme. These classes are distinguished with a supervised decision tree classification method.
The MOD12 classification schemes are multitemporal classes describing land-cover properties as observed during the year (12 months of input data). Successive production of this "annual" product allows us to make new land-cover maps with increasing accuracies as both classification techniques and the training site database mature. For land-cover change, users should use the Vegetation Cover Conversion product, MOD44, or the Land Cover Dynamics product, MOD12Q2. The data are available for the global extent of land area in 317 HDF-EOS file format files in nominal 10° tiles in Integerized Sinusoidal Grid projection.
The GLOBCOVER initiative will develop services for a global land-cover map for the year 2005, using the same thematic legend as the FAO Land Cover Classification System (LCCS) that was used for GLC-2000. The product will be derived from MERIS sensor data improving on the previous GLC-2000 dataset through a finer resolution (300 m).
Further development and application of MODIS vegetation continuous fields and MODIS urban products will be made. These represent new and improved efforts to address urban contributions to landscape conditions and should be considered as one of the combination of data sources needed for the product.
4.3.7 Limitations of the data
The DMSP nighttime lights have their limitations. At present, these data are the best available on a global basis and are available without restriction. However, there are particular applications or assessments for which higher resolution, greater accuracy, different time scale and other human dimension indicators will be needed for a particular application or assessment. This proposed effort is to provide reference or baseline datasets for population, urbanization and land use/land cover from which gaps in the data related to particular applications can be determined. As already noted, the quality of the data used to derive these indicators needs to be assessed in relation to its application. Nighttime light imaging provides useful insight. In some areas, there will be problems with the data. Indeed, for many applications it is clear that the spatial or temporal resolution of nighttime light data holds remarkable value in determining population dynamics, where lights can be taken as an indicator of density. Below are two images of Italy (see Figure 5). The image on the left shows that a sizable amount of change has occurred over seven years. This has been described as urban sprawl, which indicates changes in land-use patterns and population density and distribution. Specific methods need to be developed for deriving land use data from these data, possibly using ancillary sociological data. There are, however, challenges to this approach in areas where population density is not reflected by nighttime power use (e.g. impoverished areas of the globe or areas of significant cultural differences).
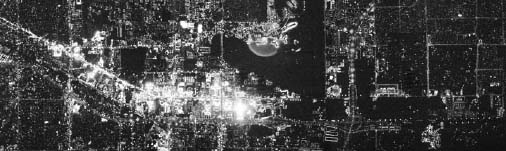
The changes in human population and the resulting changes in land use may be the single most influential factor in understanding coastal ecosystems. These datasets will be useful to a wide variety of users, including researchers, land use managers, emergency response planners, and policy-makers. Many of the limitations found with DMSP nighttime could be overcome with higher spatial resolution and on-board calibration. See Figure 6, showing nighttime lights of Las Vegas, Nevada acquired at 1.5 meter resolution from a NASA aircraft. With high resolution it is possible to discern major streets, detect lights from individual buildings, and discriminate developed versus undeveloped land with high accuracy. High resolution nighttime lights may be quite useful for tracking the expansion of development if acquired routinely from a NightSat.
FIGURE 5
DMSP nighttime lights change detection results
(1992-93 versus 2000) in Italy (C.D.Elvidge, NOAA-NGDC)

LEGEND
Red: Lights brighter in 2000
Cyan: Lights
brighter in 1992-93
White: Lights saturated in both periods
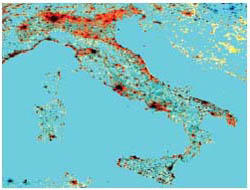
LEGEND
Red: Lights brighter in 2000
Yellow: New
lights in 2000
Blue: Lights brighter in 1992-93
Blue/Grey:
Dim lights detected in both years
Black: Lights saturated in both
periods
FIGURE 6
High resolution nighttime lights of Las Vegas,
Nevada acquired from a NASA aircraft (CD. Elvidge, NOAA-NGDC)
4.3.8 Timeline and implementation options
The source datasets are available now. Development of the coastal databases of population, urbanization and a change product would need at least 1 person-year, and land use interpretations can then follow. Development of a land-cover database would take an additional person-year. This work would complement existing marine assessment activities and as such would have considerable value added in this context.
TABLE 13
Web sites for additional
information
|
Web site |
URL |
|
Population Reference Bureau |
|
|
The World Gazetteer |
|
|
World Resource Institute |
|
|
CIESIN |
|
|
UNEP/DEWA -North America |
|
|
NASA GISS |
|
|
EDC - Land Use DAAC |
|
|
NGDC - DMSP |
http://dmsp.ngdc.noaa.gov/pres/sprawl_042502/sprawl/page8.html |
|
DOC Landscan |
4.4.1 Overview
The information age has brought the capability to generate huge datasets in almost every area of human endeavour - business, government, genetics and health care, to name a few. The very existence of global observing systems is proposed based on the collection, management, analysis and communication of such datasets. The need to process the vast streams of data has resulted in the development of a new science - the science of informatics. This discipline uses modern computational tools to examine large datasets for patterns, to classify and arrange data and information, to improve understanding of this information and to communicate this in improved and novel ways. This priority product assesses some necessary aspects of informatics for observing system needs through the example of deltaic systems and functional typologies.
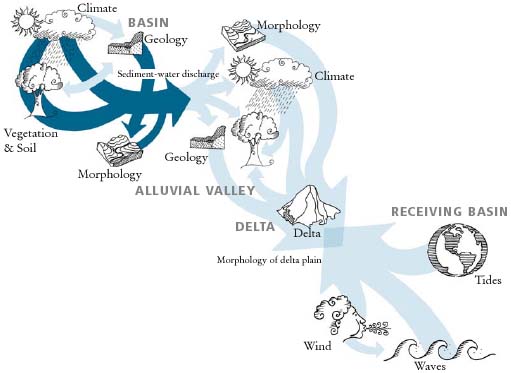
A recent study (Coleman, Huh and DeWitt, 2003) suggests that deltaic systems around the world may be losing land at a global rate of 16 percent per decade owing to a combination of factors. If true, this will have significant implications for human ecological and socio-economic systems and large numbers of people. The drivers of this change seem to be cumulative and include climate change and processes affecting sediment dynamics (e.g. changes in river discharge and hydrologic base level due to dams, sea level and energy change, land-cover change and other factors). Changes in organic production due to climate change may be responsible for the observed land loss, which is occurring mostly in the interior part of deltas (Coleman, personal communication, 2004). The expected impact of sea level rise would be to increase the rate of land loss through coastal erosion and accelerated subsidence. Hydrologic diversions, for example from dams, decrease sediment delivery and thus further tip the scales towards land loss. The world may be losing many of its deltas and along with them many important coastal ecosystem functions.
FIGURE 7
Position of major deltas for which extensive
datasets exist
Data associated with these studies (Hart, 2001; Coleman, Huh and DeWitt, 2003) provide a valuable resource for: (i) development of informatics tools, and (ii) assessments of impacts on ecological services (system-level functions of importance to humanity) and related land use. We propose a series of digital maps, constructed through informatics models, showing the vulnerability of ecological services (and/or opportunities) associated with land use in deltaic systems worldwide, in relation to actual and projected effects of climate and sea level change and alteration of sediment regimes due to the presence of dams. The effort would focus on a subset of the approximately 50 deltaic systems identified for global assessment, for which there are suitable data available (approximately seven to ten deltas at this time). Distribution models will be developed to estimate the extent and kind of potential impacts from combined pressures, in terms of vulnerability and suitability of specific functions in each delta (e.g. goods and services from mangroves, aquaculture, agriculture and other delta-specific land uses). A general cluster of ecological services (functions) related to traditional land use should also be produced, to provide a comparative index of ecological vulnerability for deltaic regions. This project would thus support and demonstrate the overall DPSIR and functional typology frameworks of C-GTOS (presented earlier).
4.4.2 Introduction
According to the latest IPCC report: "deltas that are deteriorating as a result of sediment starvation, subsidence, and other stresses are particularly susceptible to accelerated inundation, shoreline recession, wetland deterioration, and interior land loss (Bijlsma et al., 1996; Day 1997). River deltas are among the most valuable, heavily populated, and vulnerable coastal systems in the world. Deltas develop where rivers deposit more sediment at the shore than can be carried away by waves. Deltas are particularly at risk from climate change, partly because of natural processes and partly because of human-induced stresses. Human activities such as draining for agricultural development; levee building to prevent flooding, and canalization, damming, and dyking of rivers to impede sediment transfers have made deltas more vulnerable to sea level rise. Where local rates of subsidence and relative sea level rise are not balanced by sediment accumulation, flooding and marine processes will dominate... In the case of largely regulated deltas... significant land loss on the outer delta can result from wave erosion... If vertical accretion rates resulting from sediment delivery and in situ organic matter production (for example in mangrove systems) do not keep pace with sea level rise, water logging of wetland soils will lead to death of emergent vegetation, a rapid loss of elevation because of decomposition of the belowground root mass, and, ultimately, submergence and erosion of the substrate (Cahoon and Lynch, 1997). In some situations, saltwater intrusion into freshwater aquifers also is a potentially major problem." (Excerpts from IPCC report, Chapter 6: McCarthy et al., 2001).
FIGURE 8
Conceptual model of a deltaic system (Coleman,
Huh and DeWitt, 2003)
The effects of anthropogenic alterations of freshwater flow and sediment transport on integrated functions are inadequately modelled in most development plans affecting deltas (Kingsford, 2000). These effects combine with those of climate and sea level change (McCarthy et al., 2001) to increase risks to ecological services and land use potential on which many people depend. Deltas have been identified by the IPCC as ecological areas that are among the most vulnerable to climate-induced sea level change. Furthermore, in perhaps no other system is the C-GTOS functional definition of "coast" better met than in deltas, which are systems that exist as a result of the equal dynamic influence of land and sea processes.
Whereas it is common to classify, analyse, and map ecosystem units on structural criteria (Allee et al., 2000), integrated science may benefit more from the perspective of functional units, whereby geographic extent is not specified as a fixed boundary in the unit definition but is predicted from a model representing functional classifications. Mapping functions of interest in this way can more effectively support assessment of multiple impacts because it can generate highly adaptive information. It also represents an opportunity to apply informatics to the observing system process by modelling patterns and developing visualization schemes for those patterns. Establishing a flexible functional mapping capability would benefit integrated ecosystem research and assessments related to climate change, as identified in the goals of the IPCC and corresponding national programmes. Such assessments seek to characterize systems from an integrated physical, ecological and societal perspective (Pulwarty, 2000), and as a result they require innovative and flexible tools (Huston, 2002; MA, 2003).
4.4.3 Project description
The main product will be a series of digital maps that demonstrate informatics and spatial modelling methods for estimating ecological functions. A limited group of deltas will be modelled and mapped, but the number will grow as part of an effort to promote data sharing and international cooperation. Mapping will then be instituted as an operational part of the mature C-GTOS by being periodically and systematically updated. Thus, this project begins as a research effort but is intended to evolve into an operational component of C-GTOS.
Mapping and analysis will produce indices of condition of deltas. A spatial index of land loss or gain potential can be produced considering actual and projected effects of climate and sea level change, changes in organic deposition, stabilization by land cover, and alteration of sediment loss and delivery and hydrological base-level change resulting from the presence of dams and other water diversions. This index, with other constraints, can then be used to model and map vulnerability and suitability of land use practices in deltaic systems, within various scenarios of sea level change and dam development. For example, this approach can show the feasibility of promoting certain land uses that increase organic deposition or substrate stabilization and that may thereby partly compensate for conditions of deltaic deterioration.
FIGURE 9
Landsat imagery of deltaic system
A general cluster of ecological services (functions) related to traditional land use will also be produced to provide a comparative index of ecological vulnerability for deltaic regions. Such an index could be added, for example, to UNEP Division of Early Warning and Assessment's (DEWA) proposed "Coastal Vulnerability Index".
Available data and modelling tools make it feasible to do vulnerability analysis for a subset of factors influencing sustainability of ecological services and those deltas for which consistent data have been compiled. This capability will be extensible in the future as new data are organized and made available. Data for this project are available from an initial World Deltas Database, the World Commission on Dams and other sources of important contextual data on elevation, climate, tides, etc., as described below. All project data will be made available from C-GTOS partners and/or the TEMS database.
This effort would help establish a standard set of measures for deltaic systems, focusing on local geologic environments (state variables), natural habitats, human land use, ecosystem services, and significant system drivers. These measures would quantify specific processes of water flow, salinity, sediment loss and delivery, geology and hydrology, organic deposition, stabilizing vegetation, wave and tidal energy, etc., to support future assessment and monitoring. The project would aim at establishing international collaboration on data sharing and research for continuing integrated studies and assessments of deltaic systems. Additional models may be developed as the database grows, to map the suitability and vulnerability of more specific deltaic functions in each delta (e.g. goods and services from mangroves, aquaculture and agriculture, industrial development, habitation, and other delta-specific land uses) under different conditions. This work is needed in view of the cumulative effects of environmental change and human pressures, which may be particularly severe in deltaic regions and for which deltas may be suitable sentinel or early-warning systems.
4.4.4 Methods
Methods exist and are being enhanced to model and map ecosystem functions based on Habitat Suitability Modelling techniques (Rubec et al., 1999; Kineman, 2004). Functions, unlike geographic entities, have only implied geography based on the distributions of their determining or limiting factors and the means by which these factors interact and change over time. They are naturally complex, highly variable, and both context and system dependent; yet we must know them to assess impacts of climate change and human activity on those things that matter most to society. The number of functions of interest is not fixed but is determined by the intersection of natural ecology, human ecology and scientific or management interests. These definitions are dynamic, and hence the most suitable method for mapping them is to employ a model that is not restricted by prior classifications, including geographic units, and that as a result is easily iterated with changing conditions and criteria.
A functional taxonomy (or typology) can be developed for deltas in keeping with the general recommendations in the C-GTOS plan. The desired indices (representing functions of interest) can be modelled and mapped from a generalized "niche" model, using observational data to define the niche dimensions, or controlling variables. This approach requires data for multiple semi-independent variables that define the suitability for ecological functions. Statistical estimates or other available knowledge (including expert knowledge) are used to define mathematical response functions for each controlling variable, which are then combined by the model. Functional response and niche theory (Heglund, 2002; Pykh and Pykh, 2000; Hirzel et al., 2002; Guisan and Zimmermann, 2000; Austin, 2002; Bernert et al., 1997) can be applied to expand the concept of Habitat Suitability Modelling (Schamberger and O'Neil, 1986) for this purpose, combining GIS and spatial modelling capabilities (Peterson and Vieglais, 2001; Rubec et al., 1999).
The proposed project adapts such methods to mapping generalized functional classifications, demonstrating this as a new operational capability. It will produce a corresponding series of maps showing the potential distribution of land use suitability in deltaic ecosystems, as well as integrated indices of their comparative vulnerabilities to the combined drivers stated above. A limitation of this approach is that it does not model dynamics directly, although certain kinds of dynamical changes will be estimated by iterating the technique on those factors that provide feedbacks (such as land cover). Advantages include model simplicity, the integration of data and statistical measures with expert knowledge, and high adaptability and extensibility of the technique.
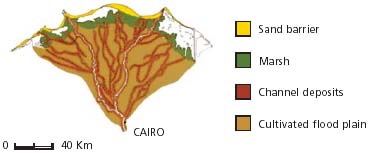
FIGURE 10
Land cover in the Nile delta
The steps for this project include:
identifying the functional cluster to be mapped and its component functions (as described above), documenting definitions;
decomposing the selected function into the physical, biotic and societal factors that most efficiently determine or indicate the spatial (and temporal) distribution of that function in the study region;
determining physical, biotic and societal response functions for each component controlling the distribution and obtaining the needed data sets;
constructing niche models for each of the functional components using a suitability model approach;
linking component models to constitute the functional cluster model;
producing desired maps from the models, iterating where spatial constraints interact;
preserving these steps in automated procedures employing appropriate off-the-shelf software.
4.4.5 Data availability
World Deltas Database
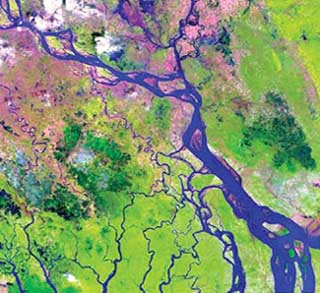
Approximately 42 major deltas of the world have been surveyed, and seven of these have been studied in depth with respect to their structural and functional characteristics, natural and cultural land use and processes that determine their stability with respect to sediment loss and delivery and/or sea level change. These data are being made available for general use through national and world data centres. In a typical deltaic analysis, physical subenvironments, drainage basins, land use and other factors are identified and mapped, and hydrologic and sediment balance analyses are performed. The figures in this proposal show examples from currently available data for world deltas, which, combined with other data sources listed below, provide the foundation for the proposed project (Figure 7; Figure 8; Figure 9; Figure 10).
World Commission on Dams
Data on the location, properties, and effects of dams on river flow and sediment loss and delivery are available from the World Commission on Dams.
Digital Elevation Models
Elevation data are currently available from public sources as follows:
30 arc-second topography for Antarctica, Asia, Australia, China, and India.
3 arc-second (~90 m) coastal elevation and bathymetry for the United States (National Ocean Service/Geophysical Data System).
3 arc-second (~90 m) topography for the United States, Canada, Greenland, Europe, Russia, coastal Africa (except 30 sec for Libya, Somalia, and Ethiopia).
1 arc-second (~30 m) topography for Hawaii and Alaska.
Other Data Sources
This effort should be pursued in collaboration with other national and international centres and sources of data, both scientific and cultural, such as the LOICZ delta initiative (http://www.deltasnetwork.nl).
The TEMS Database
Considerable relevant data are accessible through TEMS, and further data will be added by this effort. As TEMS is a metadata server, links from the Web site directly to the primary custodians of the data are provided as part of the TEMS system.
4.4.6 Desired products
A Web site for world deltas data and research products, presenting applications and examples from this demonstration effort, the general strategy for functional analysis of coastal deltas, and interactive maps with downloadable data.
Digital maps for a representative number of deltas around the world showing vulnerability of specified ecosystem services (related to land use), to the combined impact of sea level rise and alterations in hydrology and sediment delivery due to dams.
Models that produce each of the above maps and that can be altered to test assumptions, incorporate new data or ask new questions.
A full report of methods, results and recommended development pathways. This includes an assessment of the application of informatics to observing system processes.
Routine periodic updates of products and analysis of change. The maps and indices will be periodically updated as part of an operational, mature C-GTOS.
4.4.7 Importance to GTOS
Functional ecology is the basis for ecosystem geography at all scales. Process and pattern have mutually reinforcing aspects, such that one cannot be determined without the other. The US National Academy of Sciences report Global Change and Ecosystems Research (National Academy of Sciences, 2000b) determined that "changes in the structure and function of natural ecosystems," particularly in response to changes in the distribution of human population, are among the most significant changes requiring investigation. The recent US Climate Change Science Program (Moss et al., 2002) strategic plan for "Improving Connections Between Science and Society" identifies a range of ecosystem research and data needs, emphasizing the question: "how do natural and human-induced changes in the environment interact to affect the structure and functioning of ecosystems at a range of spatial and temporal scales, including those functions that can in turn influence regional and global climate?" Illustrative research questions in the USCCSP emphasize "the effects of multiple environmental changes on the structure, functioning, and biodiversity of terrestrial and aquatic ecosystems..." Regarding modelling needs, it emphasizes the need for: "spatially explicit ecosystem models capable of representing complex interactions between diverse ecosystems and the physical/chemical environment" - particularly "for examining the impact of management and policy decisions on a wide range of ecosystems..." The recent IPCC report (McCarthy et al., 2001) recommends priority research into "adaptation options and (adaptation) capacity for coastal zones and marine ecosystems". These programmes are speaking with one voice to recommend stronger ecosystem studies aimed at the functional level. This recommendation represents the evolution of global change science to its current stage, where cumulative effects of complementary causes must now be considered and appropriate tools for doing that must be developed.
4.4.8 Importance generally
Land and sea are linked together in the coastal zone in an intricate network of cross-boundary interactions that underlie ecosystem function. Recent assessment reports (World Resources Institute, 2002; Gitay 2001; The Heinz Center, 2002) indicate that high rates of change in coastal ecosystem function are of major concern both internationally and nationally as anthropogenic and natural change combine inharmoniously to disrupt and either temporarily or permanently degrade ecosystem goods and services. The human-altered mosaic of coastal ecosystems increasingly restricts policy and management options for responding to these changes.
The World Resources Institute summarized the status of information on coastal ecosystems in their report Pilot Analysis of Global Ecosystems (Burke et al., 2001), making the following recommendations:
Information on the location and extent of coastal ecosystems is very incomplete and inconsistent at the global level.
Historical data describing previous extent of habitats, against which we might hope to measure change, are very limited. Where no historical data exist, the possibility of predictive mapping should be considered, using existing climatic, oceanographic and topographic data combined with biogeographic information.
There is an urgent need for better and more consistent classification schemes and datasets characterizing the world's coasts.
These problems are typified in the problems facing the sustainable management of deltaic systems, which represent microcosms and early warning systems for many of these issues.
4.4.9 Anticipated users
The unique combination of data resources and methodological development represented in this demonstration effort is intended to catalyse or support an international focus on assessment of deltaic ecosystems that will continue to develop data and model sharing as an evolving community. Many of these potential users have been previously identified for C-GTOS (section 1.4.1). Finally, users of the general approach are expected from other science and management communities involved in the coastal zone, and methods should be applicable to similar mapping needs for ecosystems in other biomes.
4.4.10 Timeline and implementation options
The proposed demonstration should be feasible as a short-term (1- to 2-year) effort conducted by a small spatial ecological modelling team. The participants in this C-GTOS planning effort are familiar with, and in several cases represent, suitable capabilities and facilities for producing the proposed product and can thus either participate in production or help guide it. Work may also be combined with existing projects to explore such informatics needs for regional integrated ecosystem assessments. Management of the deltas database is currently being discussed. Various proposals have been submitted to develop the proposed spatial modelling capabilities for other applications. Synergistic support can thus strengthen a request for proposals on this topic. The efforts will continue throughout the development of C-GTOS through the periodic (every 5-10 years) updating of maps and indices.
TABLE 14
Web sites and organizations providing
additional information on deltas
|
Web sites and organizations |
URL |
|
World Commission on Dams |
|
|
Smithsonian Deltas-Global Climate Change Program |
|
|
NASA Geomorphology from Space (Ch. 5: Deltas) |
|
|
Indian Deltas (Prof. G.F. Hart) |
|
|
|
|
|
World Conservation Monitoring Centre |
|
|
Ramsar Convention on Wetlands |
|
|
World Resources Institute |
|
|
San Francisco Bay - Sacramento/San Joaquin Delta GIS |
|
|
Environmental Atlas of the Lake Ponchetrain Basin |
|
|
Louisiana Statewide GIS |
4.5.1 Overview
This proposal advocates the creation of a multilayered Web-based information system for the management of conservation and cultural sites in the coastal zone, and the organization of an international collaborative effort to meet these data needs. This effort extends those of UNEP-WCMC and the FAO's GeoNetwork and puts them into the observing system context. By definition, these conservation and cultural sites constitute places that people have, for various reasons, specially designated as worthy of preservation and protection, such as marine parks and UNESCO World Heritage Sites. These may serve as sentinel sites for many aspects of global change. The first two layers of the system feature an interactive map of sites, distinguished by category, giving ready access to additional information about the site in the second "encyclopaedia" layer. Subsequent layers provide regional and global syntheses of data collected. Key outcomes relating to improved global and regional information on conservation and cultural site management include the extension and validation of existing global datasets; gap analysis of site management issues within (and between) regions, and communication and reporting tools for sites and national governments that assist them in meeting international conservation convention requirements. The coupled development of this and other phase 1 products of C-GTOS will also add a particular focus on transboundary issues, with respect to both natural and human threats across the land-sea interface.
4.5.2 Introduction
The project focuses on sites that have high "human" values. It is worth noting that the rationales for protecting sites span a variety of scientific and socio-economic reasons. Thus, coastal parks may be designated for reasons of natural beauty, because they have important fossil sites or because they represent key biomes. Heritage sites are designated on the basis of historical and cultural importance.
Adequate governance of reserves and parks has been recognized internationally as a key component in the protection of marine and coastal environments (WSSD, 2002; IUCN, 2003; CBD, 2004). Significant advances have been made towards collecting information to quantify what is "adequate" coverage, most notably through the World Database on Protected Areas (WDPA), which was created by a consortium of international organizations (including UNEP-WCMC, IUCN, and others). Funding is being sought to further develop WDPA to meet the needs of international conventions, with a particular focus on improved ability to quantify the coverage of habitat type within reserves. This will be a large step towards meeting CBD targets set in 2004; "to effectively conserve ten percent of the world's ecological regions by 2010" (CBD, 2004). In addition to necessary ecosystem information for reserves, a collaborative effort is required to expand corresponding information about management of protected areas. This will be achieved through building on existing efforts and provide new information and tools to users through the planned activities described in this proposal, and other related C-GTOS phase 1 products.
4.5.3 Objectives and proposed products
This project is a Web-based information system envisaged with multiple "layers" of information, content and complexity. The different layers would be aimed at differing subsets of potential users and can be supported by different sponsors. These layers are identified below as (i) map, (ii) encyclopaedia, (iii) interpretation, and (iv) monitoring and reporting. They represent the order of complexity and maturity of the products, as the first two layers will be produced through the collection and synthesis of data and the latter two layers will be products derived from this work, producing improved outputs as the system matures.
Map products
The map itself constitutes only the first layer of the overall project design. Clearly a modular approach would allow various maps to be added as required, depending on users, priorities and sponsors. Map elements could be classified according to various schemes. The following categories (key features) make up a non-exclusive list of elements in which management boundaries will be mapped:
Interactive maps will be displayable in various ways to meet particular user needs, including by category, region, monitoring activities, socio-economic indicators or vulnerability index where available. The map layer will provide the primary user-friendly graphical interface by which users will be able to "drill" down to locate further information from the other product layers and connect to additional information from TEMS and other collaborating data providers. Other state-of-the-art GIS mapping functions will be used in the interface, building on existing tools such as those provided by UNEP-WCMC and the FAO's GeoNetwork (GTOS, 2003).
Encyclopaedia product
The second layer would be an encyclopaedia product, whereby individual features on the map will be linked to a database of appropriate site-specific information. All information will be presented in Web pages to enable users to select and further explore related information using standard Web-browsing software. Features include the following:
importance of site (e.g. why selected);
relevant convention or agreement, if applicable;
site management plan;
socio-economic indicators and statistical information (e.g. number of international, national and local visitors);
links to adjacent conservation and cultural sites (within and between categories);
links to data providers, sponsors and the sites themselves (e.g. other GTOS and GOOS themes, UN Atlas, UNEP-WCMC, UNEP-Regional Seas Programmes, FAO fisheries, LOICZ, GEF-International Waters projects); where possible, links will be made directly to the related data and tools within the organizations' Web sites.
As with sites registered in TEMS, managers of individual conservation or cultural sites will be able to administer their own information directly through the Web interface, ensuring the same sustainable data management strategy implemented by TEMS. Some data may be sensitive and not accessible to all users, while managers may wish to share other information, encouraging promotion of best management practices across geographic and national boundaries. The information system underpinning this initiative will need to provide this functionality and, in doing so, will create a strong basis for future global and regional user forums for information sharing on conservation and cultural sites.
Interpretation product
The third layer, reflecting a major potential value added from C-GTOS, is interpretation. A holistic approach permits gap analysis within the different categories and allows an assessment of the relationships between sites, their management strategies and influences of other sites and management practices (including terrestrial management practices provided by TEMS). Thus, a first order of interpretation would be regional gap analysis of data available from the mapping and encyclopaedia products. The questions to be considered initially relate to coverage:
Thereafter, the task is to identify gaps in site management within particular regions:
Do sites within the category have equally robust management plans? Thus, there is the potential for cross-fertilization of best management practices for similar types of sites or those that may be geographically close.
Is the marine-terrestrial interface adequately taken into account, particularly with respect to adjacent terrestrial and marine sites?
What is the level of community participation and financial sustainability of sites within categories?
For a given location, does the management plan consider coastal vulnerability issues (e.g. natural hazards, pollution threats, offshore shipping, coastal erosion, sea level rise) or have access to information and support for such studies?
A third facet would be the cross-fertilization of socio-economic considerations.
What lessons with respect to public outreach campaigns could be transferred from one site to another within, and between, regions?
Would sites consider twinning arrangements, leading to reciprocal scientific exchanges or tourist activities within or between regions?
Monitoring and reporting product
A fourth layer of complexity relates to monitoring and reporting products derived from the previous layers that provide value-added services to managers of sites. Conservation and cultural sites should collect environmentally relevant information to evaluate the success of site management in maintaining the rationale for which the feature was designated for protection. In this way, the viability of the site management plan can be continually assessed. Moreover, these sites would be expected to need an early warning system for site protection, on the understanding that prevention is preferable to mitigation. These sites would also collect a range of socio-economic data (e.g. number of visitors, number of employees, budget and contributions to scientific knowledge). Overall, these sites may serve a highly important role for the observing system. As sentinel sites that may monitor critical variables, these can act as early warning systems for global change in the broader sense once their data are harmonized and integrated.
These sites will be linked through the planned information system to global environmental monitoring initiatives such as TEMS and WDPA, thereby acting as sources of environmental data for the global database and initiating contact with new sites not yet incorporated into global coverage. Several parameters are likely to be of importance to individual sites, as well as national and global monitoring needs. A non-exhaustive list includes general meteorological measurements (GCOS linkage), several oceanographic parameters (GOOS linkage), and C-GTOS site-specific information (coastal erosion, local land use changes, biodiversity indices). The tables in Chapter 3 provide a non-exhaustive listing of variables and indicators associated with the key issues of the mature C-GTOS.
The site indicators incorporated in the system, and the reporting of final synthesised data, can be tailored to meet the needs of individual site, national and global reporting requirements. This feature will aid countries in meeting their national reporting requirements under related global conventions. The same tools will be a valuable resource for site managers to commence vulnerability mapping exercises and for the relevant international or regional agencies to disseminate information and obtain data.
4.5.4 Methods
This product depends on the creation of a multilayered Web-based information system and collaboration with other international agencies. Parts will be relatively fast to develop, based on existing datasets and products. This requires the collaboration and support of both donors and relevant data and information services providers (see Table 15). Therefore, organising a collaborative effort among the appropriate international agencies will be the first step in developing the product. The first two product layers (map and encyclopaedia) require the production of GIS-based spatial databases and the development of Web-based as well as desktop-based information systems to house all product layers. Subsequent interpretative layers would be longer-term developments and are dependent on data collected from the initial two layers.
Additional information will be needed to validate and improve the current datasets of management information. A concerted effort will be made to engage individual sites to review and contribute information directly. This outreach effort will facilitate the widespread utilization of the information products in site management, as well as encourage the cross-fertilization of ideas and best management practices between sites. Outreach strategies also need to be developed for national and regional networks and associated governing agencies, for in many cases data may be available only through their participation.
4.5.5 Importance to GTOS
Given that sites of special significance are featured, this project has some outputs with potentially high visibility for C-GTOS that could be produced quickly at relatively low cost, particularly through the mapping and encyclopaedia products. The coastal zone is featured and thereby can serve to emphasise coast-relevant issues and problems. A global perspective is required to make certain that adequate coverage is extended worldwide for key features, and the interpretation and monitoring components of the project will contribute as the programme matures. A holistic view across the land-sea interface will ensure that sites in either domain are protected from threats across the land-sea interface. Subsequent capacity building will extend global coverage of the terrestrial sites registered in the TEMS database (section 4.2).
4.5.6 Importance generally
Educators and civil society are likely to be most interested in the map and aspects of the encyclopaedia, while environmental managers make up the main target group of regular and substantive use of the interpretive products. Engagement should stimulate cross-fertilization of site management strategies and potential twinning arrangements. As the project matures, nations responsible for reporting data to conventions, and the conventions themselves, will benefit from the outputs. Users of related regional and global data, such as modellers, will benefit from improved monitoring that will expand global coverage of databases. Lastly, sites and organizations responsible for networks of sites can place their efforts in a larger context.
4.5.7 Timeline and implementation options
Because parts of this product are based on existing datasets, they can be developed quickly. A modular design for both categories of sites and interpretation would permit evolution of the product, driven by user needs and appropriate sponsors. Development of the first two layers could be expected within a six-month time frame, if built on existing resources through collaborations with data providers (see Table 15). Subsequent interpretative layers would be a longer-term project and would preferably be linked to the outreach activities of C-GTOS, TEMS and other collaborators.
TABLE 15
Summary table for the phase 1 implementation
product: management of conservation and cultural sites in the coastal
zone
|
Product |
Management of conservation and cultural sites in the coastal zone |
|
Users |
Civil society, educators, researchers, site managers, tour operators, ecotourists, GTOS meeting planners |
|
Possible sponsors |
FAO, UNEP, UNESCO, Ramsar Convention on Wetlands, others |
|
Variables/indicators |
Meteorological, oceanographic, biodiversity, socio-economic |
|
Spatial extent of data |
Global/regional/national/subnational |
|
Data sources |
Sites of special interest |
|
Data providers |
Sites of special interest, UNEP-WCMC, IUCN, WWF, and others |
|
Spatial resolution (GTOS) |
Variable |
|
Accuracy/precision of data |
Variable, non-harmonized |
|
Reliability of data |
Variable and patchy |
|
Spatial extent of use |
Global |
|
Linkage values |
High (GTOS-TEMS, GCOS, GOOS, others) |
|
Start year/date |
2004 |
|
Update frequency |
Annual for sites; ongoing for new categories (data providers and users) and sites |
TABLE 16
Web sites and organizations with additional
related information
|
Web sites and organizations |
URL |
|
World Conservation Monitoring Centre |
|
|
Terrestrial Ecosystem Monitoring Sites |
|
|
World Database on Protected Areas |
|
|
Ramsar Convention on Wetlands |
|
|
World Resources Institute |
|
|
Environmental Protection in Antarctica |
4.6.1 Overview
This proposal selects a network of sites, across a range of geographical, socio-economic and environmental conditions, to analyse the delivery systems and provide focused and timely support to the Coastal Module of the GTOS. This kind of network will take advantage of already existing national or regional initiatives with the aim of enhancing their integration in a worldwide context and filling information gaps. The network aims at comprehensively representing different regions, covering a range of climatic and ecosystem characteristics and ensuring that multiple anthropogenic pressures and water pollution problems are considered. "Delivery system" fits the HSESDS framework described in section 2.2.3.
4.6.2 Introduction
A variety of land uses have contributed to increased changes in the watershed structure, hydrographic networks and the delivery capacity of the coastal zone (Turner, Adger and Lorenzoni, 1997; Söderqvist, Mitsch and Turner, 2000). The urban and agricultural development of coastal areas is responsible for direct contamination of the near-shore system. Reclamation of coastal wetlands and mangroves and exploitation of inshore and near-shore waters for tourism, shipping, aquaculture and other uses also cause relevant losses of ecosystem functions, such as the capacity to retain or buffer against pollutants (De Wit et al., 2001; Valiela and Cole, 2002) and loss of fish nursery habitats affecting associated productivity of off-shore commercial fisheries and coral reef biomass and resilience (Mumby et al., 2004).
Altered quantity and quality of water delivery have numerous impacts. Changes in the freshwater-to-saline water ratio can have the above-mentioned impacts, but can also affect the aquatic biota and ecosystem productivity. The increased concentrations of phosphorus and nitrogen are responsible for eutrophication and dystrophy of coastal waters. Persistent pollutants can accumulate in sediments and aquatic food webs. These quality changes are closely linked to human use of these regions (e.g. urbanization, fishery, aquaculture, recreation and tourism). Economic consequences of these changes can be directly monitored through fishery catch, aquaculture productivity or tourist numbers and related revenue. There are direct and documented human consequences, including matters relating to public health.
Boundary conditions of the delivery system
Material and pollutants are delivered to coastal waters through a complex system that is made of different components, both upstream and seawards. The most reactive part is indeed located in the coastal zone itself, where most of the biogeochemical processes occur (see De Wit et al., 2001). The structure of the coastal zone as identified by the LOICZ project (Gordon et al., 1996; Turner, Adger and Lorenzoni 1997) is an acceptable (even broad) framework, within which one can identify the main components of the delivery system:
inland areas, which affect the oceans mainly via rivers and non-point sources of pollution;
near-coastal lands and wetlands where human activity is concentrated and directly affects inshore and near-shore waters, and
transitional waters - generally estuaries, lagoons and shallow waters - where the effects of land-based activities are dominant and where the sea level increase might have relevant effects.
The marine component can also influence the delivery system through waterborne transports (e.g. oil transport), waste dumping, fishery, etc.
The identification of components and their boundaries is relevant in order to select and prioritize the features of the delivery system and the related indicators. The combination of all these features calls for an integrated observational system of watershed-coastal zone-open sea. However, we consider it a priority to focus on the so-called transitional waters, whose dominion is very narrow and shallow. Here, biogeochemical sedimentary processes are important, since the water volume to sediment surface ratio is low (for example, in comparison with the deeper continental shelf). As a consequence, in shallow coastal ecosystems macrophytes, microphytobenthos and benthic fauna play major roles.
Status of monitoring networks and sources of information
Monitoring programmes in coastal waters should be based on how best to address the relevant issues and specific controversial problems. Most often, the issues to be analysed are complex and cannot be resolved by considering only simple variables and linear relationships. To be suited to monitoring programmes, indicators should be quantitative, based on scientific consensus and sound methodologies, validated, sensitive to changes in time and space, appropriate in scale, cost-effective and user friendly.
Numerous networks that may have monitoring components are available. Observational networks for consideration are the Regional Seas and Action Plans, many of which are UNEP sponsored. Many have their own Websites but can be accessed through the central portal: http://www.unep.ch/seas. Another series of related projects stem from GEF-IW (Global Environment Facility International Waters). There is a Web site at GEF (http://www.gefweb.org/), which links to its resource network (http://www.iwlearn.org) and the implementing agencies (UNDP, UNEP, World Bank).
At present, there are also good examples of networks and projects aiming to assess the delivery capacity of the coastal system, namely the LOICZ project (http://www.loicz.org), the ELOISE (http://www.nilu.no/projects/eloise/) cluster of projects, ILTER and several national activities. Additional sources can be supplemented by national environmental agencies.
4.6.3 Objectives and proposed products
This proposal aims to:
identify a selected number of sites among those that are available in existing monitoring networks, project networks, core projects, etc.;
assess the suitability of the selected sites for distinguishing and monitoring variables that depend upon (i) local factors and impacts within the coastal zone; (ii) watershed-based factors and impacts, and (iii) global issues;
promote common approaches, methodologies and techniques for monitoring the delivery through the coastal system;
implement a guidance document for carrying out studies and monitoring of the delivery system in the coastal zone;
develop a common and harmonized database of water quality and quantity parameters that can provide support to assessment and management of system delivery and inherent policy applications.
4.6.4 Methods
Proposed activities are structured in three phases described in the sections following. Clearly a modular approach would allow various deliverables to be added as required, depending on users, priorities and sponsors. By definition, the systems that can be potentially considered constitute sites specially designated as worthy of monitoring local to global issues.
Specific tasks for achieving the above-mentioned objectives would be the following:
to provide a forum for discussion and cooperation between research groups, agencies and institutions that are developing monitoring programmes in coastal and transitional aquatic ecosystems;
to evaluate available information and present understanding of flows of carbon, nutrients and pollutants across the transitional and coastal waters under different anthropogenic pressures and threats;
to promote an agreed common approach to studies of biogeochemical and ecological processes that are relevant for implementing monitoring programmes of the delivery systems, and
to develop a network of sites for achieving the above-mentioned goals that can be maintained for the foreseeable future.
4.6.5 Variables and indicators
Observational variables and related indicators of water quantity and quality can be organized in groups of selected key variables. As an initial listing we suggest:
A first attempt to give an inventory of key observational variables and indicators is given in Table 17. Indicators were chosen to address both issues in the context of what is measured currently by various entities. Most of these variables are included in monitoring programmes of developed countries (see, for example, the US Clean Coastal Act and the EU Water Framework Directive). Tentative criteria for prioritization are also given in terms of feasibility and scientific consensus. At a first instance, most of the geomorphic, hydraulic and meteorological variables, as well as nutrients and chemical oxygen demand (COD), can be proposed for global monitoring. These variables are easy to measure, and for this reason there is often some redundancy in this kind of data. Measurements of organic nitrogen, major ions and metals present an intermediate level of difficulty because of equipment and technical expertise requirements.
Only certain variables are easily determined at low monetary or time cost using standardized techniques. Most of the variables require ground-based measures, but satellite imaging and remote sensing have strong potential to address some issues for observing system needs. Many of these variables are related to those in tables in Chapter 3.
TABLE 17
Preliminary inventory of key variables to be
used for assessing the delivery capacity of the system
|
Variable |
Level of difficulty |
Remote sensing |
Scientific consensus and information provided |
|
Alkalinity, CO2 |
Low |
No |
High |
|
BOD5 and/or COD |
Low |
No |
High |
|
Carbon (DOC, POC) |
High |
Yes |
Some discrepancies among techniques |
|
Direct sewage discharge |
Low |
No |
High |
|
Dissolved reactive Silica |
Low |
No |
High |
|
Freshwater discharge |
Low |
No |
High |
|
Inorganic Contaminants (mostly heavy metals) |
High |
No |
High |
|
Major ions (Na+,K+,Mg2+, Ca2+, Cl-, HCO3-, SO42-, CO32-) |
Intermediate |
No |
High |
|
Metals of biological interest (Fe, Cu, Zn, Mo, Mn) |
Intermediate |
No |
High |
|
Nitrogen species |
Low |
No |
High |
|
Organic contaminants (nonpersistent and POP) |
High |
No |
High |
|
Organo-metallic compounds (MeHg, TBT) |
High |
No |
High |
|
Pathogen bacteria (coliforms and faecal matter) |
Intermediate |
No |
High |
|
Phosphorus species |
Low |
No |
High |
|
Radionuclides |
High |
No |
High |
|
Salinity |
Low |
Yes |
High |
|
System depth |
Low |
Yes |
High |
|
System surface area |
Low |
Yes |
High |
|
Viruses |
High |
No |
High |
|
Wet deposition and evaporation |
Low |
No |
High |
To assess changes (intensity, direction, reversibility, etc.) in the delivery system, one needs a "reference system" that has pristine or minimally altered conditions, is uncontaminated or has not been transformed). The major questions are: do such reference systems exist? Are the reference systems site-specific, or, in other words, how generalized can a reference system be? This is one of the main issues raised by the European Commission when starting the implementation plan of the Water Framework Directive.
4.4.6 Proposed activities
TASK 1. Identification of the existing sites
The identification of existing sites that are appropriate for achieving the above-mentioned objectives will begin with consideration of the LOICZ approach to the C, N and P biogeochemistry in the coastal zone. The suitability of each site will be assessed according to the following criteria for prioritizing them:
representativeness of different geographical zones, coastal ecosystems/typology, socio-economic conditions and anthropogenic impacts;
existing knowledge and research and monitoring skills and facilities;
perspectives of a long-term monitoring programme and its management.
The LOICZ approach can be considered a first step in implementing the analysis of the delivery system within the Coastal Module of GTOS. Three major points are to be considered for further developments:
The LOICZ project started some biogeochemical budgeting activities in about 170 coastal sites in all continents (see Table 18). By now coverage of the world coastal systems is almost well distributed. Other sites are known to exist but are not part of the LOICZ network.
The LOICZ budget approach considers basic data related to the river basin (riverine water discharge, N and P loading, direct sewage discharge, etc.), atmospheric inputs of P and N, water quality of the coastal system and the adjacent seas and oceans.
At the meetings at The Hague in 1997 and 2001, assessments of coastal typology were started considering climate features, population index, oceanographic data, etc.
By now, most of these activities can be considered "snapshots" representing "spots" of the coastal system and related river basins. However, they are very promising exercises because they were developed with the LOICZ cooperative network which involved and helped local teams of scientists. Most of the LOICZ sites (or regional cluster of sites) can potentially have a self-evolving structure that can be implemented step-by-step. Moreover, the LOICZ approach does not need "sophisticated" tools and data, but only requires data that are already available also for the developing countries (see the various LOICZ reports). This approach has some weakness, which are the assumptions and the simplifications made for allowing the budgeting exercises with very few and primitive data.
The LOICZ approach can be used for answering two major questions:
What are the distribution and coverage of sites appropriate for analyses of delivery systems?
What is the existing knowledge of the functional typology of the coast in order to evaluate the distribution of homogeneous functional units?
An assessment of relationships between sites and site management strategies is then necessary in order to evaluate redundancy, coverage degree and potential gaps. The questions to be considered initially concern coverage:
Is there sufficient global coverage of sites within a given typology? Thereafter, the task is to identify gaps in site management:
Do sites within a given typology have equally robust management and monitoring plans? Thus, there is the potential for cross-fertilization of management practices for similar types of sites or those that may be geographically close.
For a given site, does the monitoring plan adequately consider coastal vulnerability issues (e.g. natural hazards, pollution threats, offshore shipping, coastal erosion, sea level rise)?
TABLE 18
Tentative inventory of the sites monitored in
the LOICZ project. Other sites are also indicated based on knowledge of C-GTOS
Panel members. Several sites would not be considered coastal using certain
definitions (e.g. some sites are > 50 m depth and others are > 50 m
elevation)
|
Region |
Subregion |
National network |
LOICZ sites |
Other sites |
|
North Polar |
|
|
4 |
0 |
|
North America |
West |
|
3 |
6 |
|
East |
|
6 |
5 |
|
|
North-Central America |
Mexican system |
Mexico |
22 |
0 |
|
Central-South America |
|
|
15 |
4 |
|
Pacific Ocean |
|
|
3 |
0 |
|
Europe |
Baltic Sea |
Denmark |
9 |
0 |
|
Sweden |
3 |
|
||
|
Poland |
2 |
0 |
||
|
Baltic-Kattegat |
1 |
0 |
||
|
Bothnian Sea |
1 |
0 |
||
|
Gulf of Finland |
1 |
0 |
||
|
Gulf of Riga |
1 |
0 |
||
|
as a system |
1 |
0 |
||
|
North Sea |
as a system |
1 |
0 |
|
|
Irish Sea |
as a system |
1 |
0 |
|
|
Europe-Atlantic coast |
|
3 |
2 |
|
|
Mediterranean Sea |
LaguNet-Italy |
17 |
5 |
|
|
PNEC-France |
1 |
13 |
||
|
PlaNet-Portugal |
0 |
7 |
||
|
ElNet-Greece |
2 |
10 |
||
|
Black Sea |
|
4 |
1 |
|
|
Africa |
Mediterranean coast |
|
1 |
0 |
|
Atlantic ocean |
|
6 |
2 |
|
|
Indian ocean |
|
4 |
0 |
|
|
South Africa |
South Africa |
11 |
5 |
|
|
Australia and New Zealand |
Australia |
Australia |
10 |
1 |
|
Great Barrier Reef |
1 |
0 |
||
|
Subtropical |
1 |
0 |
||
|
New Zealand |
New Zealand |
3 |
0 |
|
|
India |
|
India |
2 |
0 |
|
East Asia and Japan |
|
North Korea |
1 |
0 |
|
South Korea |
2 |
0 |
||
|
Japan |
5 |
0 |
||
|
Russia |
1 |
0 |
||
|
China |
1 |
1 |
||
|
East China Sea |
|
1 |
0 |
|
|
Yellow Sea |
|
1 |
0 |
|
|
Southeast Asia |
|
China |
4 |
0 |
|
Philippines |
11 |
0 |
||
|
Taiwan |
4 |
0 |
||
|
Vietnam |
5 |
0 |
||
|
Gulf of Thailand |
|
8 |
0 |
|
| |
Indonesia |
1 |
0 |
As a preliminary step, to avoid redundancies or gaps, the existing LOICZ and additional sites (e.g. ELOISE, ILTER, etc.) will be organized in homogeneous cluster according to typology.
Task 1 is expected to produce maps, features and site-specific information. These will be based on the following:
TEMS is expected to aid these efforts with identification and coordination of: organizations providing data, datasets and metadata (Section 4.2).
TASK 2. Selection and validation of permanent sites and implementation of national/regional networks
Subsequent interpretative and validation exercises would be a longer-term project. LOICZ, UNEP, TEMS, ILTER, ELOISE and other networks could provide an opportunity to involve site managers in the project. Initially, site managers would participate as data providers, but with the anticipation that engagement would lead to direct communication between sites and cross-fertilization of ideas with respect to site management.
The involvement of local scientists, end users and stakeholders will be also required in order to achieve a common and agreed approach on the coastal typology definition. As a matter of fact, coastal sites that are expected to contribute to system delivery are quite different for hydrogeomorphology (they span coastal lagoons, wetlands, estuaries, bays, upwelling areas, etc.), communities (they span microphytobenthos, phytoplankton, sea grasses, seaweeds, kelp, etc.), and tidal amplitude (microtidal, mesotidal, macrotidal, nontidal).
If applicable, a system of networks would be proposed as a neuronal system with local and national networks connected to a regional node, which is connected to a subcontinental/continental node, which in turn is connected to the GTOS secretariat office. For example, some networks in Europe may still be working in this direction, such as the Networks for Ecological Research in Coastal Zone and Transitional Areas which were developed in Italy (LaguNet), Greece (El-Net), Portugal (Pla-Net), and the Programme National Environnement Côtier (PNEC) in southern France. Others are developing through a bottom-up approach, such as those in Spain and Eastern Europe. These networks can potentially form a network of the European Mediterranean region (the Southern European Arc Network). In parallel a Baltic network should be developed, along with a North Atlantic network. The three regional networks should be connected in the European network (continental level), etc. An assessment of the feasibility of this kind of network is necessary.
Task 2 is expected to provide the organization for the network of delivery systems. Contact among representatives of individual sites and smaller networks will be made through a series of forums (Web-based), meetings and workshops. This bottom-up approach was developed in the Water Framework Directive and is currently being pursued as a national exercise in Italy with the LaguNet (http://www.dsa.unipr.it/lagunet) and a forum on the definition of coastal typology (http://www.ecologia.ricerca.unile.it/).
TASK 3. Optimization of strategies and planning and implementation of common methodologies
Parts of this product would be relatively easy to create, based on existing sites and data (see task 1). Further development of local and regional networks would permit evolution of the product but requires the implementation of common strategies and methodologies. The LOICZ approach was first developed through the application of a common biogeochemical model for carbon, nitrogen and phosphorus (Gordon et al., 1996) and the organization of regional workshops. The analysis of the delivery system for other pollutants will require a similar approach, specifically:
assurance of continued reliable and operational monitoring.
The implementation of the guidance would require an optimization between the top-down and bottom-up approaches to improve the skills and building capacity of the local and regional stakeholders and actors. An example of this approach is also given by the development of the Water Framework Directive of the European Union.
4.6.7 Importance to GTOS
Given that sites of special significance are featured, this project represents an output with potentially high visibility for C-GTOS that could be quickly achieved at relatively low cost, at least for Tasks 1 and 2. The land-ocean boundaries are considered, and thereby outputs can serve to emphasise issues and problems that are relevant for coastal systems. Among these, the existing data that are relevant for the analysis of the delivery systems are:
These products will be integrated and communicated through TEMS. They also provide an increase in the number and enhancement of TEMS variables. A global perspective is required to make certain that adequate coverage is extended worldwide for key features.
4.6.8 Importance generally
The creation of a network of well-monitored sites in the coastal zone will allow a range of short- and medium-term assessments of:
relations between anthropogenic input (organic matter, nutrients, chemicals), retention and release during their transfer across the coastal zone, and the potential evolution in the adjacent ocean;
calibration and validation of models, e.g. for assessing diffuse sources of nutrients, sediment transport, pollutant release from sediments and their transfers to the coastal waters;
impact of preventive and remedial measures and environmental policies on those polluting effects (DPSIR approach).
Such a network could also contribute to the implementation of environmental policies under different economic and political conditions and help develop a common and harmonized database as a support for decision- and policy-makers. Also, such a network would provide a direct opportunity for interaction with C-GOOS.
4.6.9 Timeline and implementation options
Task 1. Identification of the existing sites (Years 1-2):
A report will give an inventory of the site and a summary of information regarding its suitability for the delivery system of C-GTOS.
A mid-term report will be circulated among the Coastal Panel members.
Contact will take place with scientists and stakeholders involved in site management. An evaluation of their interest in the C-GTOS initiative will be conducted.
Task 2. Selection and validation of permanent sites and implementation of national and regional networks (Year 3): This task includes meetings and workshops with those who are interested in the initiative, giving an opportunity to start building up a network.
Task 3. Optimization of strategies and planning and implementation of common methodologies (Years 3-10):
Phase 3: creation of active network.
![]()
![]()
![]()