![]()
![]()
![]()


Financial analysis applies mainly to projects designed to generate income. It is possible to analyse social projects, environmental undertakings or production support activity, by calculating and assigning artificial prices, but such ‘economic analysis’ is generally far too complex for small or medium scale projects[13].
For income generating projects, the profitability of the activity is the first and most important factor determining sustainability, because no ‘comercial’ project will survive which does not generate enough income to cover operating expenses and pay financial costs. However, there is more than one way to determine the profitability of an investment. Each approach has its strengths and weaknesses. It is therefore convenient to use more than one method.
It is also important to understand that the figures generated through financial analysis are not very useful on their own; they need to be interpreted. It is the responsibility of the technician who carries out the formulation and evaluation process for the project to explain to the applicants, as well as to the committee reviewing the application for financing, the significance of the results, as well as to combine the profitability calculations with other indicators of likely success and sustainability, such as the capability and commitment of the applicants, the reliability of the market, the complexity of the technology, the environmental impact and the degree of organization of the management.
Once all of the costs and incomes have been determined for the analysis period (whether 8, 12 or 20 years), the following questions should be asked: What measurements will be used to determine the feasibility of the investment, in financial terms? How can we interpret these results?
There are two distinct measurements used in the RuralInvest models for this purpose, each having its advantages and disadvantages. Together they provide a comprehensive vision of the proposed project’s feasibility.
1. Annual Cash Flow
The annual cash flow largely avoids the problem of comparing costs in one year with benefits in another year by evaluating costs and incomes each year, using only cash costs and incomes. The cost of the investment enters into this analysis through the payment of the loan taken out to finance it.
The annual cash flow is calculated by adding all cash income from each year and subtracting all cash costs for the same year; the result is the net yearly income. Then subtract the cost of financing (capital and interest) from this result. If the remaining amount is still positive, then the project will generate sufficient income during that year to cover all production costs, as well as the costs of credit, and still leave some amount of profit (the remaining amount).
The annual cash flow is the measure of greatest interest to the potential lender (bank, project, cooperative etc.), as it shows whether the project will be able to generate enough cash to pay all costs and still meet the financing costs. It is also typically the measure most easily understood by the applicants themselves, although they should understand that by taking only cash, this approach can miss out important costs and benefits that are not in cash terms.
2. Financial Profitability
The cash flow measurement represents only a snap-shot of the cash position each year; it does not offer an overall evaluation of the project. It is therefore not very useful for comparing different projects, or for assessing a project against some form of benchmark. If a government, a development project or even the applicant himself or herself wishes to choose the most productive use for available funds, they will need a different measurement This requires an evaluation of the financial profitability of the project.
A financial analysis takes the results of all of the years under study and presents them in terms of a single figure. However, to achieve this objective, the methodology must take the decreasing value of money and the general benefits that occur with the passage of time into account. How should this analysis be carried out?
We will use the following as an example: If a person were offered the opportunity to invest in a project in which the expense is US$1,000 today, but which generates an income of US$2,000 tomorrow, there are few who would hesitate (assuming faith in the honesty of the project managers). However, if the offer instead is an investment of US$1,000 to earn US$1,001 in 5 years, there would be no takers. The question, therefore, is to decide: What rate of return will make it worth while to invest in a project? In other words, what rate of return represents a favourable investment and good use of the available resources?
There are two main measurements that attempt to respond to this question: Net Present Value (NPV) and Internal Rate of Return (IRR). Both have several key elements in common:
They charge the total cost of the investment in the year in which it takes place, so that the financing method and cost do not affect the result of the analysis. Remember, the purpose of the analysis is to identify a good project, not to select the best financing option.
They both include the value of the main project assets at the end of the analysis period (such as buildings, machinery and other substantial items). These are not in cash, of course, and so are excluded from the annual cash flow analysis, but they are of value and should not be forgotten.
They both place a value on self supply (e.g. unpaid family labour) and auto-consumption (outputs used or consumed but not paid for in cash).
They adjust the value of future benefits in such a way that a US$1 today is worth more than a US$1 in one year, which in turn, will be worth more than a US$1 in two years, etc. This process is called discounting the future benefits in comparison to benefits today.
a) Net Present Value
The simplest measurement is Net Present Value (NPV). After calculating the net annual income for each year (as in the annual cash flow, but with the differences noted above), a discount rate is applied to reduce the value of both net benefits and losses in future years. Remember that a discount rate is the opposite of an interest rate. If I have $1, an interest rate of 10% will give me $1.10 in one year. By the same token, a discount rate of 10% will mean that $1.10 received a year from now is worth only $1 today (its present value). So, the NPV is a figure that represents the value of the project after discounting the net future benefits.
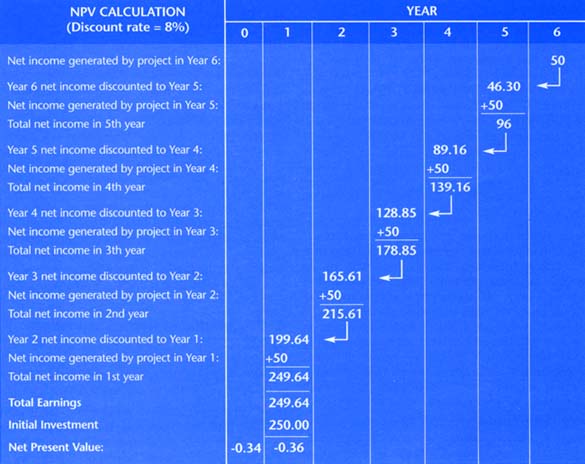
If for example I require an 8% interest rate on my money, then applying an 8% discount rate to the future net benefits of a project will ensure that I get that return. If the amount left (the NPV) is 0, the project is generating exactly the 8% required. If the NPV is positive, I have obtained my required rate (the 8%) and have that sum as a bonus. When the NPV is negative, it means that the investment cannot yield the expected 8%; it would have to earn (after discounting) an additional amount equivalent to the NPV amount to reach break-even.
For example, let us imagine that a project in which an investment of $250 results in six years of benefits of $50 each year, or a total of $300 (see previous page). It would appear that there is a profit of $50. But this is true only if you do not take the time-value of money into account. If instead you apply an 8% discount rate you can see that, in reality, the project is not very attractive. The NPV of the $250 investment is -$0.34. That is to say, if you require an investment to yield an 8% interest rate, it fails to meet this goal by an amount of $0.34.
Clearly, the critical aspect of the calculation of NPV is the selection of the discount rate (or interest rate). A high rate will result in the rejection of more projects and will favour those projects that generate their earnings in the first years. A low discount rate will normally result in acceptance of more projects and will give more weight to the benefits generated in the more distant future.
But, how do you choose the discount rate? The most correct definition, as stated by the World Bank, is that it is the rate equal to the increase in the Gross Domestic Product (GDP) resulting from the investment of one additional dollar in a given country. So if a dollar causes an increase of US$1.07 in the GDP of the country in which you live, the discount rate should be 7% - because then your investment will be equal to or better than the average for the economy as a whole. Such a definition, however, is easier said than measured, because there is no easy way of making the necessary calculation.
For practical purposes, it is better to say that the discount rate is the rate of annual net earnings (excluding inflation) that is required for an investment to be worth the effort. However, this rate will not remain the same for all investors or all investments. It will depend greatly on the alternatives that are available and, even more, on the risks that the project faces. An investor in a big solid bank would probably require a lower discount rate on future earnings than someone putting money into a petroleum exploration company, where rewards can be high but bankruptcy is always a possibility.
It has become customary in many cases to use 8%, but any figure between 6% and 12% would be acceptable. However, remember that investments with high levels of risk need a higher rate of return, and that if few other uses can be identified for the available funds, it might be acceptable to lower the rate.
b) Internal Rate of Return
The Internal Rate of Return (IRR)[14] uses a methodology very similar to that of the NPV. The key difference is that, in using the IRR, one is asking what discount rate (or interest rate) will this investment support? If the IRR is 15%, that means that the initial investment will yield an interest rate of 15% over the life of the project.
Calculating the IRR is tricky, as one must first guess at the IRR, then run the NPV calculation and see if the resulting NPV is positive or negative. The estimated IRR is then adjusted (up if the NPV is positive, down if it is negative) and the calculation repeated again. This goes on until the NPV reaches exactly zero. This then is the IRR.
Making these calculations used to be a most tedious procedure, but nowadays the computer has made it easy, doing in a second what the analyst might have taken many minutes to do a few years ago.
The RuralInvest methodology places little emphasis on the calculation of taxes, especially on those related to income. Although these taxes may prove important in well established and successful projects (for example, in the case of an agro-industrial plant), they are irrelevant for the determination of the feasibility of small investments. The problem that these projects face is more one of survival than estimating taxes on earnings.
When dealing with other types of taxes (for example, property taxes) the RuralInvest methodology considers them simply as other indirect or general costs and they should be included in the tables for these costs.
A blind faith in the results of a financial analysis, as a guide to the approval of an investment proposal, is dangerous for the following reasons:
a) A computer can only process the data that is fed into it. Therefore the quality of the calculation generated by the formats depends, to a large extent, on the quality of the information provided by the applicants and their support technicians. In the real world, very little information is 100% reliable. Estimations of prices, costs, volumes and duration can be wrong, in spite of the best efforts of the persons involved. So it is important to remember that a financial analysis represents the results under the assumptions made by those who supplied the information.
b) A project that is profitable may be successful, but is in no way guaranteed to be a success. Even if the figures used for the calculation are reliable, a project can still fail. Among other factors, problems arising from poorly committed participants, an ineffective management, or unexpected price changes can destroy a profitable project. Therefore, it is vital that you consider all of the factors that may influence the success of the investment, and not only the financial profitability.
How can these risks be recognized and taken into account in presenting the results of the evaluation? First, it is crucial to take advantage of the considerable speed and power of the computer. Once the data have been entered it is very easy to test alternative possibilities without having to repeat all the earlier work. One can immediately see the impact of a change, sometimes by altering a single number. This is called "sensitivity analysis" and its purpose is to indicate how the results of the study will change with small changes in the assumption made.
For example, if a product has an average price of $10, what will happen if the price drops to only $8 If the profit disappears completely (or even becomes a loss), you know that the profitability of the investment depends very closely on the price of the good or service it produces and sells. The same procedure can also be used for a non-profit project. How would the running costs of a community health clinic be affected if the number of patients attending were lower than expected? If the community relies on a standard subsidy per patient from the Ministry of Health, then lower than expected patient numbers might mean the clinic can not meet its overhead costs (nurse, lighting, repairs etc.) and has to close down.
To make a sensitivity analysis, the technician must:
a) Identify those elements of the project for which: (i) doubt exists as to the correct number to use (e.g. should the price be 6, 8 or 10), and (ii) which are expected to be of importance to the project (there might be doubt over the price of paperclips, but it would probably not be worthwhile testing the impact of this change on project performance). Commonly, such elements include: prices of outputs, number of anticipated users, cost of inputs; production volumes, the efficiency of the production process (i.e. how much input is needed to produce 1 kg. of output), the time needed to start-up or yield (in the case, for example, of tree crops) and once production is underway, the time needed to reach the full production level.
b) Determine a likely range of possibilities for each factor. For example, for a price analysis, one might say that, although the average price is $10, the possible range is from $7 to $12.
c) Insert new figures into the RuralInvest computer tables and note the results. The best way of presenting the results is to organize the figures into a chart, demonstrating the profitability of the investment for each factor (price, cost, etc.) with average, pessimistic and optimistic assumptions, but this is not essential.
d) In the transmittal letter that must accompany the detailed analysis, the analyst should identify those factors for which the project is most sensitive and indicate how variations in these factors might change the profitability of the investment, for example:
"Although the proposal to install an irrigation system looks quite profitable, it must be noted that it is very sensitive to variations in the yields of the vegetables grown. If, instead of 12 metric tons per hectare (mt/ha), only 10 mt/ha are obtained, the project becomes marginal. If the yield drops further to 9 mt/ha or less, the investment ceases to be profitable."
e) When a proposal shows high sensitivity to changes in key factors, the technician’s report should consider the probability of these variations occurring, for example:
"However, the applicants have extensive experience in growing vegetables and already obtain yields in excess of 12 mt/ha in the few areas where there is now access to water during the summer. The risk of lower than expected yields is not therefore considered to be very high".
The steps described above insure that the people considering the financing proposals have the information that they need to make an informed decision.
With respect to the relative importance of financial and other factors in project success, it is the responsibility of the technician in charge of formulation and evaluation to carefully consider and identify any other aspect of the proposal that could influence in its feasibility, and not rely solely on the financial analysis. The transmittal letter for the proposal should make reference to the ability of the applicants to manage and administer the investment, to the sustainability of the project, in terms of environmental impact and the utilization of resources and the risks that the investment might encounter.
Remember, you are doing no one a favour by recommending an investment that does not have a good possibility of success. Where the project is financed with credit, a failure can leave a group or community in debt, with no possibility of paying it off (probably restricting its access to financing in the future). Even in the case of a project that only uses donated funds, you must remember that every failure means that there was another good project that was unable to obtain the resources it needed for success.
|
Investing in an Existing Activity -the Importance of Incremental Costs and Revenues The procedures explained in this chapter largely assume that the proposed investment is completely new, and thus all costs and income will be directly attributable to the project. This is certainly the simplest case. But what if the investment is applied to an earlier, existing activity where there are already costs and revenues? How can the impact of the new investment be properly reflected in the financial analysis? The answer is that, where the proposed investment will give rise to changes in an existing activity, it is necessary to look at costs and revenues both with and without the new project. Take, for example, the case of a group currently growing melons on a 3 hectare field. They wish to install a pump which will bring water from a nearby stream during the dry season to provide supplemental irrigation. Clearly the cost of purchasing and operating the pump are new costs, but what about the actual production? As more water is available, it may be worthwhile adding more fertilizer and other nutrients, to allow the melon plants to make full use of the new supply. Currently, the group is applying 2.5 bags of fertilizer per hectare, but the group decides to increase this to 3.5 bags if water is available. The incremental fertilizer usage would thus be 1 bag/ha, and the incremental cost would be the price of 3 additional bags (for 3 hectares). Equally, yields are currently 5 tons/ha, but the group is confident that this can be increased to 8 tons/ha with irrigation. Incremental revenue is thus 3 tons per hectare, or 9 tons in total, times the price per ton received for the melons. Other incremental costs incurred by the new project may arise from changes in the amount of seed sown, the increased number of melons to be harvested, and the increased number of bags or boxes needed for packaging. Remember, if you apply all costs and income anticipated after the new investment, you may well come up with the wrong answer as to the profitability of the additional investment. In the case above, it is important to compare only the incremental costs (the pump and additional fertilizer etc.) with the incremental output of 9 tons of melons. If fuel for the pump is expensive, or if the projected increase in yield is small, it is not impossible that the group would be better of without irrigation, but they can not know unless they use incremental costs and revenues. |
|
[13] The prices calculated
under economic analysis not only provide values for those inputs and products
that have no market prices, but also frequently adjust market prices which do
not adequately reflect the true value of the good or service (due, for example,
to taxes, protective measures, or minimum wage levels). [14] Also called the Internal Financial Rate of Return, IFRR, to distinguish it from the Internal Economic Rate of Return, IERR |
![]()
![]()
![]()